. 2019 Jan 15;11(1):94.
doi: 10.3390/cancers11010094.

Circulating Tumor Cells Develop Resistance to TRAIL-Induced Apoptosis Through Autophagic Removal of Death Receptor 5: Evidence from an In Vitro Model

Affiliations

Circulating Tumor Cells Develop Resistance to TRAIL-Induced Apoptosis Through Autophagic Removal of Death Receptor 5: Evidence from an In Vitro Model

Julianne D Twomey et al. Cancers (Basel). .

Abstract

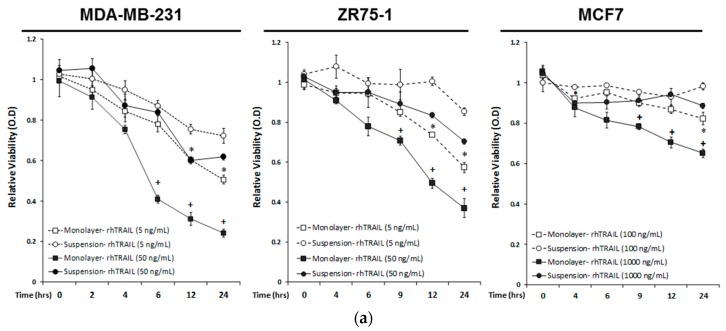
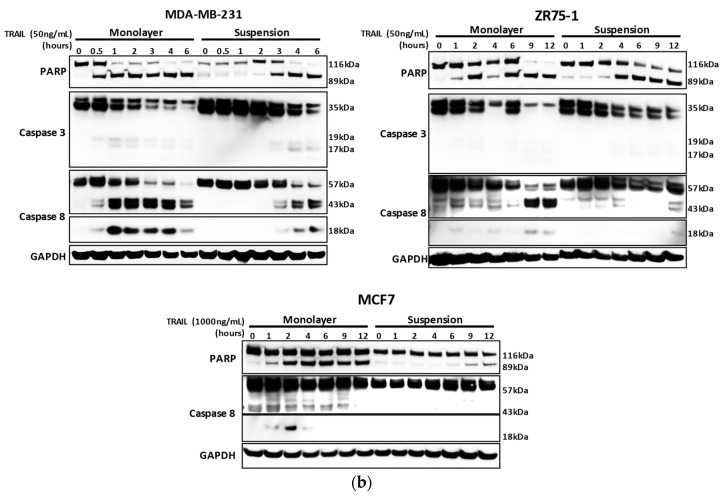
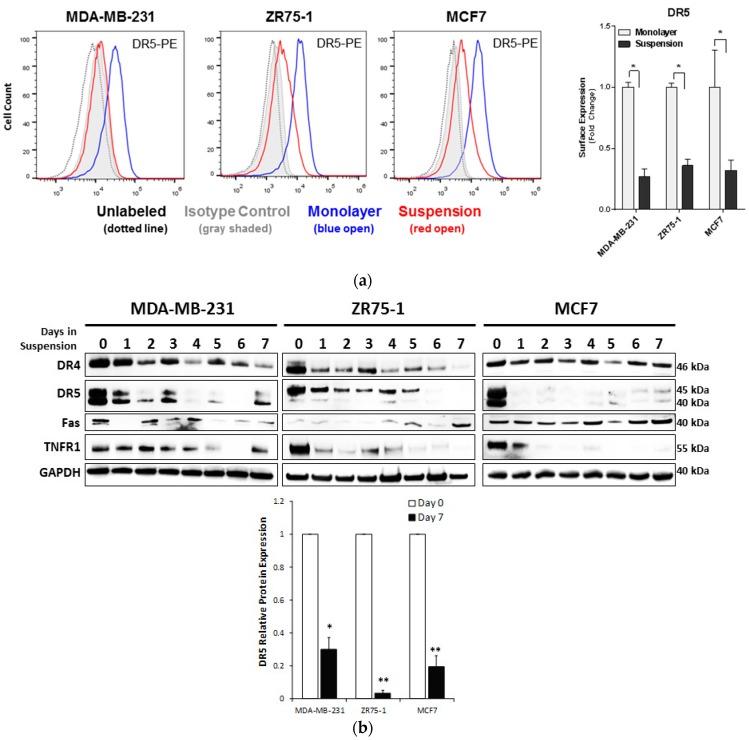
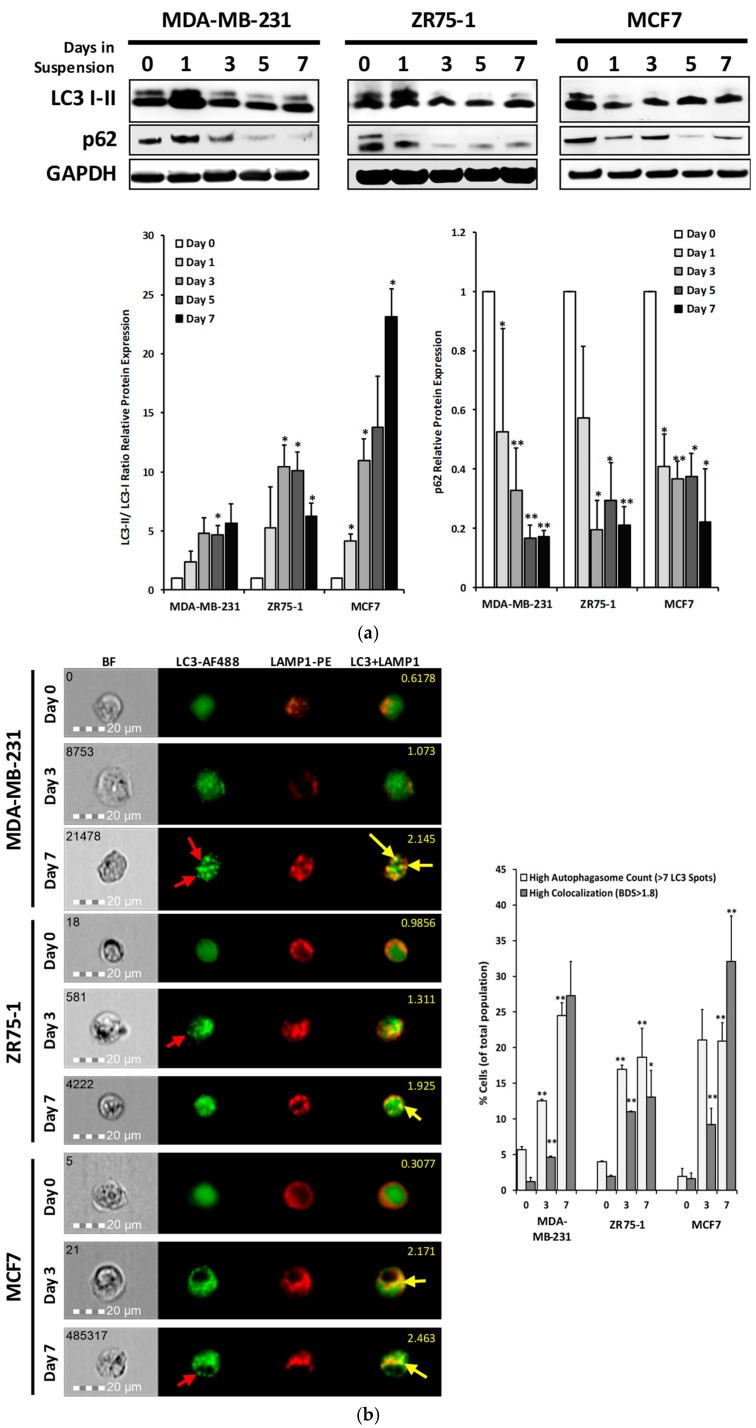
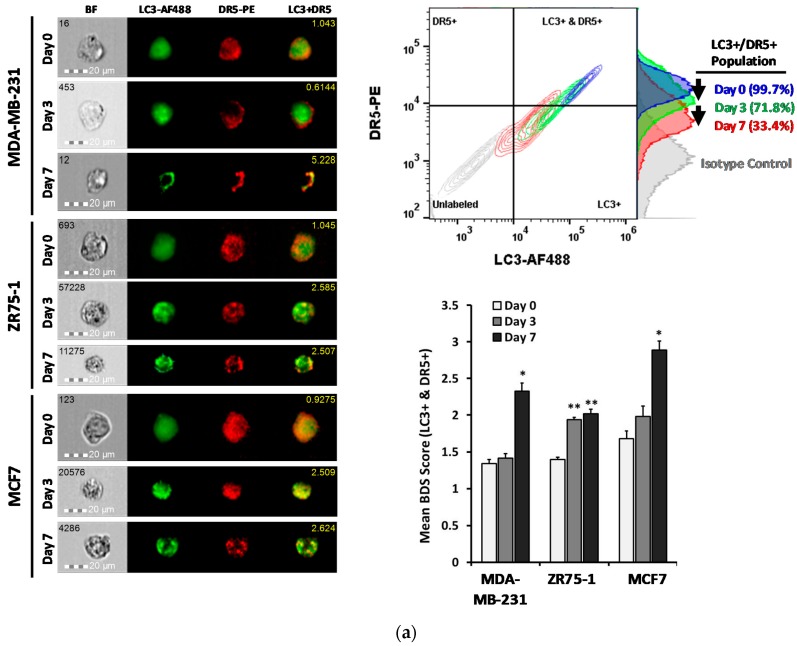
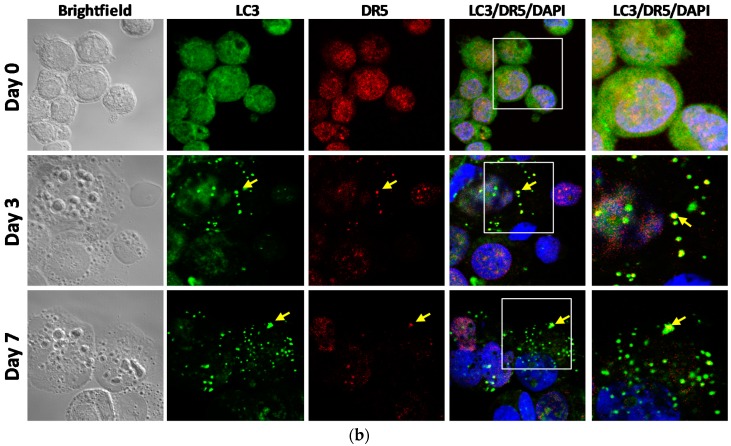
Circulating tumor cells (CTCs) in the peripheral blood are the precursors to distant metastasis but the underlying mechanisms are poorly understood. This study aims at understanding the molecular features within CTCs, in relation to their metastatic potential. Using in vitro CTC models, in which breast cancer cell lines were cultured in non-adherent conditions simulating the microenvironment in the blood stream, we found that the suspension culture resulted in resistance to TNF-related apoptosis inducing ligand (TRAIL)-mediated cell death. Such a resistance was directly correlated with a reduction in surface and total levels of DR5 protein. In the non-adherent state, the cells underwent a rapid autophagic flux, characterized by an accumulation of autophagosome organelles. Notably, DR5 was translocated to the autophagosomes and underwent a lysosomal degradation. Our data suggest that CTCs may evade the TNF cytokine-mediated immune surveillance through a downregulation of the death receptor (DR) expression. The data warrants further studies in cancer patients to find the status of DRs and other molecular features within primary CTCs, in relation to disease progression or chemoresistance.

Keywords: CTCs; TRAIL; apoptosis; breast cancer; circulating tumor cells; death receptor; in vitro model; metastasis.


Conflict of interest statement

The authors declare no conflict of interest.

Figures

Figure 1
Figure 1
Breast cancer cells cultured under the suspension condition acquire resistance to recombinant human TNF-related apoptosis inducing ligand (rhTRAIL)-induced apoptosis. (a) The indicated breast cancer cell lines were cultured under monolayer adherent or non-adherent suspension conditions (see details in Materials and Methods section). Cells were seeded at 10,000 cells per well and were then treated with the rhTRAIL (5 ng/mL and 50 ng/mL for MDA-MB-231 and ZR75-1 cell lines; 100 ng/mL and 1000 ng/mL for MCF7 cell lines reflecting the previously determined IC50 to rhTRAIL treatment [37]), over 24 h. Relative viability was measured at hour intervals, using an MTT assay, and was normalized to the non-treated controls. Values are means ± SEM of triplicates. (* p < 0.05 monolayer culture relative to suspension at same time point with rhTRAIL treatment of 5 ng/mL for MDA-MB-231 and ZR75-1 or 100 ng/mL for MCF7 cells; + p < 0.05 monolayer culture relative to suspension at same time point with rhTRAIL treatment of 50 ng/mL for MDA-MB-231 and ZR75-1, or 1000 ng/mL for MCF7 cells; n = 3). (b) Western blot analysis of caspase and PARP cleavage following the rhTRAIL treatment.
Figure 1
Figure 1
Breast cancer cells cultured under the suspension condition acquire resistance to recombinant human TNF-related apoptosis inducing ligand (rhTRAIL)-induced apoptosis. (a) The indicated breast cancer cell lines were cultured under monolayer adherent or non-adherent suspension conditions (see details in Materials and Methods section). Cells were seeded at 10,000 cells per well and were then treated with the rhTRAIL (5 ng/mL and 50 ng/mL for MDA-MB-231 and ZR75-1 cell lines; 100 ng/mL and 1000 ng/mL for MCF7 cell lines reflecting the previously determined IC50 to rhTRAIL treatment [37]), over 24 h. Relative viability was measured at hour intervals, using an MTT assay, and was normalized to the non-treated controls. Values are means ± SEM of triplicates. (* p < 0.05 monolayer culture relative to suspension at same time point with rhTRAIL treatment of 5 ng/mL for MDA-MB-231 and ZR75-1 or 100 ng/mL for MCF7 cells; + p < 0.05 monolayer culture relative to suspension at same time point with rhTRAIL treatment of 50 ng/mL for MDA-MB-231 and ZR75-1, or 1000 ng/mL for MCF7 cells; n = 3). (b) Western blot analysis of caspase and PARP cleavage following the rhTRAIL treatment.
Figure 2
Figure 2
Surface expression of death receptors are decreased in breast cancer cells under suspension conditions. (a) Surface expression of the DR5 was analyzed by flow cytometry on breast cancer cells (BCCs) cultured in monolayer and suspension, for seven days. Surface expression was analyzed using Relative Median Fluorescence Intensity (RMFI) of the DR5, determined by the Median Fluorescence Intensity (MFI) obtained for the suspension-cultured cells, normalized to the corresponding MFI obtained for monolayer cells (Day 0) (mean ± SEM; * p < 0.05; n = 3). The reduction in surface level protein is indicated with a median shift of the suspension cultured cells (red line), from the monolayer (blue line) towards the isotype (gray shading), and the unlabeled control (dotted line). (b) Western blot analysis of the BCC lines cultured in the suspension condition and collected each day. Cell lysates were analyzed for DR4, DR5, Fas, and TNFR1 with GAPDH as a loading control (quantification of each blot can be found in Figure S3). Relative protein expression of the DR5 (relative densitometric analysis) to monolayer (day 0). (* p < 0.05, ** p < 0.01 to monolayer; n = 3).
Figure 3
Figure 3
Non-adherent cultured cells increased the autophagic flux as measured by the LC3 I-II turnover and autolysosomal formation. (a) Western blot analysis of the BCC lines, cultured in monolayer or suspension condition up to seven days. Cell lysates were analyzed for LC3-I (top band) and LC3-II (bottom band), p62, and GAPDH. LC3-II to LC3-I relative protein ratio indicating the LC3 turnover compared to the monolayer (day 0) (mean ± SEM; n = 3; * p < 0.05). Relative expression of the p62 to the monolayer-cultured cells (mean ± SEM; n = 3; * p < 0.05). (b) Images of the MDA-MB-231, ZR75-1 and the MCF7 cells cultured in monolayer (day 0) or suspension for three or seven days, captured using imaging flow cytometry. Figure shows brightfield (BF), LC3-AF488 (green), LAMP1-PE (red), and a composite image of the co-localization of LC3 and LAMP1 (yellow). Autophagosomes are indicated with red arrows and the co-localization of LC3 and LAMP1, representing the autolysosome formation, is shown with yellow arrows. Corresponding bright detail similarity score between the LC3-AF488 and the LAMP1-PE puncta is shown in yellow. (Single fluorophore controls are provided in Figure S4). Population analysis of cells undergoing autophagy (high autophagosome counts (≥ 7 LC3+ spots per cell)) and autophagic flux (high co-localization of LC3-AF488 and LAMP1-PE (bright detail similarity score ≥ 1.8)) (mean ± SEM; n = 3; * p < 0.05, ** p < 0.01 relative to monolayer).
Figure 4
Figure 4
DR5 localized to autophagosome for degradation under suspension culture. (a) Representative images of the MDA-MB-231, ZR75-1 and MCF7 cells, cultured in monolayer (Day 0) or suspension for three or seven days, captured using imaging flow cytometry. Figure shows brightfield (BF), LC3-AF488 (green), DR5-PE (red), and a composite image of the co-localization of the LC3 and the DR5 (yellow), with the associated bright detail similarity score, per cell (yellow number in the top right). (Single fluorophore controls are shown in Figure S4). Bivariate flow cytometry plots of the LC3-AF488 and the DR5-PE, with the associated DR5-PE histogram, per time-point. Population percentages are shown for the dual-positive population. Mean bright detail similarity scores of the breast cancer cells cultured in monolayer or suspension culture for three or seven days. Bright detail similarity (BDS) scores were calculated on the dual-positive populations only (mean ± SEM; n = 3; * p < 0.05, ** p < 0.01 relative to monolayer). (b) Immunocytochemistry and confocal microscopy of the cyto-spun ZR75-1 cells cultured in monolayer (day 0) or suspension for three or seven days. LC3 (AF488, green), DR5 (AF594, red), DAPI, brightfield, and composite micrographs are shown. Yellow arrows indicate co-localized LC3 and DR5. Images taken at 40×.
Figure 4
Figure 4
DR5 localized to autophagosome for degradation under suspension culture. (a) Representative images of the MDA-MB-231, ZR75-1 and MCF7 cells, cultured in monolayer (Day 0) or suspension for three or seven days, captured using imaging flow cytometry. Figure shows brightfield (BF), LC3-AF488 (green), DR5-PE (red), and a composite image of the co-localization of the LC3 and the DR5 (yellow), with the associated bright detail similarity score, per cell (yellow number in the top right). (Single fluorophore controls are shown in Figure S4). Bivariate flow cytometry plots of the LC3-AF488 and the DR5-PE, with the associated DR5-PE histogram, per time-point. Population percentages are shown for the dual-positive population. Mean bright detail similarity scores of the breast cancer cells cultured in monolayer or suspension culture for three or seven days. Bright detail similarity (BDS) scores were calculated on the dual-positive populations only (mean ± SEM; n = 3; * p < 0.05, ** p < 0.01 relative to monolayer). (b) Immunocytochemistry and confocal microscopy of the cyto-spun ZR75-1 cells cultured in monolayer (day 0) or suspension for three or seven days. LC3 (AF488, green), DR5 (AF594, red), DAPI, brightfield, and composite micrographs are shown. Yellow arrows indicate co-localized LC3 and DR5. Images taken at 40×.

References

    1. León-Mateos L., Casas H., Abalo A., Vieito M., Abreu M., Anido U., Gómez-Tato A., López R., Abal M., Muinelo-Romay L. Improving circulating tumor cells enumeration and characterization to predict outcome in first line chemotherapy mCRPC patients. Oncotarget. 2017;8:54708–54721. doi: 10.18632/oncotarget.18025. - DOI - PMC - PubMed
    1. Smerage J.B., Barlow W.E., Hortobagyi G.N., Winer E.P., Leyland-Jones B., Srkalovic G., Tejwani S., Schott A.F., O‘Rourke M.A., Lew D.L., et al. Circulating tumor cells and response to chemotherapy in metastatic breast cancer: SWOG S0500. J. Clin. Oncol. Off. J. Am. Soc. Clin. Oncol. 2014;32:3483–3489. doi: 10.1200/JCO.2014.56.2561. - DOI - PMC - PubMed
    1. Cristofanilli M. Circulating Tumor Cells, Disease Progression, and Survival in Metastatic Breast Cancer. Semin. Oncol. 2006;33:9–14. doi: 10.1053/j.seminoncol.2006.03.016. - DOI - PubMed
    1. Ng S.P., Bahig H., Wang J., Cardenas C.E., Lucci A., Hall C.S., Meas S., Sarli V.N., Yuan Y., Urbauer D.L., et al. Predicting treatment Response based on Dual assessment of magnetic resonance Imaging kinetics and Circulating Tumor cells in patients with Head and Neck cancer (PREDICT-HN): Matching ‘liquid biopsy‘ and quantitative tumor modeling. BMC Cancer. 2018;18:903. doi: 10.1186/s12885-018-4808-5. - DOI - PMC - PubMed
    1. Keup C., Mach P., Aktas B., Tewes M., Kolberg H.-C., Hauch S., Sprenger-Haussels M., Kimmig R., Kasimir-Bauer S. RNA Profiles of Circulating Tumor Cells and Extracellular Vesicles for Therapy Stratification of Metastatic Breast Cancer Patients. Clin. Chem. 2018;64:1054–1062. doi: 10.1373/clinchem.2017.283531. - DOI - PubMed

LinkOut - more resources