. 2019 Jan 15;8(1):53.
doi: 10.3390/cells8010053.

Dystrophin Deficiency Leads to Genomic Instability in Human Pluripotent Stem Cells via NO Synthase-Induced Oxidative Stress

Affiliations

Dystrophin Deficiency Leads to Genomic Instability in Human Pluripotent Stem Cells via NO Synthase-Induced Oxidative Stress

Sarka Jelinkova et al. Cells. .

Abstract

Recent data on Duchenne muscular dystrophy (DMD) show myocyte progenitor's involvement in the disease pathology often leading to the DMD patient's death. The molecular mechanism underlying stem cell impairment in DMD has not been described. We created dystrophin-deficient human pluripotent stem cell (hPSC) lines by reprogramming cells from two DMD patients, and also by introducing dystrophin mutation into human embryonic stem cells via CRISPR/Cas9. While dystrophin is expressed in healthy hPSC, its deficiency in DMD hPSC lines induces the release of reactive oxygen species (ROS) through dysregulated activity of all three isoforms of nitric oxide synthase (further abrev. as, NOS). NOS-induced ROS release leads to DNA damage and genomic instability in DMD hPSC. We were able to reduce both the ROS release as well as DNA damage to the level of wild-type hPSC by inhibiting NOS activity.

Keywords: DMD; NO synthases; ROS; dystrophin; genome stability; pluripotent stem cells.


Conflict of interest statement

The authors declare no conflict of interest.

Figures

Figure 1
Figure 1
DMD hPSC lines are pluripotent. (a) Two patients derived (DMD02 and DMD03) and hESC derived (cDMD) DMD stem cell lines were analyzed for presence of pluripotency markers (Nanog (red on the left), TRA1-81 (green on the left) with their corresponding DAPI staining, and Oct4 (green on the right), SSEA4 (red on the right) with their corresponding DAPI staining). All DMD hiPSC and cDMD lines present comparable expression to WT (WT hESC and WT hiPSC). Nuclei are counterstained with DAPI (blue). Ruler represents 50 µm. (b) Structure of the DMD gene and positions of mutations in each DMD hPSC line. Locations of binding sites for actin, NOS, dystroglycans and syntrophins are shown. The diagram shows how the 79 exons fit together in terms of the normal open reading frame. Exons are colored according to the domain they encode: N-terminus (dark blue), rod domain (light blue dark green with hinge regions in grey), cysteine-rich domain (purple) and C-terminus (brown). NOS binding site is visualized in green. DMD02 line carries deletion of exons 45–50 (red line), DMD03 deletion of exons 48–50 (orange line) and cDMD lacks a whole allele and all exons are deleted from the chromosome (grey line).
Figure 2
Figure 2
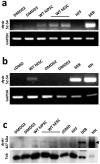
WT hPSC, but not DMD hPSC, express dystrophin. (a) Dystrophin mRNA exons 52–54 were detected by rtPCR in both WT hiPSC and hESC lines and in CM containing beating embryonic bodies (bEB). No signal was detected in DMD hiPSC lines. GAPDH was used as a loading control. Human foreskin fibroblasts (HFF) were used as negative control. (b) demonstrates the absence of expression of dystrophin mRNA exons 52–54 in cDMD line. For positive control, bEB and human heart (HH) sample were used. DMD02 and DMD03 hiPSC lines were used for lack of expression comparison. (c) High molecular weight dystrophin (dystr) protein (Dp427 isoform; antibody against N-terminal part) is expressed in pluripotent stem cells as shown by immunoblot of dystrophin expression in WT hiPSC and two WT hESC lines, while all DMD hPSC lines show complete lack 427 kDa form of dystrophin. As a positive control, human heart (HH) biopsy of non-dystrophic patient was used together with WT hESC derived bEB. HFF were used as a negative control. Tubulin (Tu) was used as a loading control. Loading of bEB and HH was adjusted not to overload dystrophin due to its high expression. DMD hPSC lines are pluripotent.
Figure 3
Figure 3
Elevated spontaneous NOS induced ROS release in DMD hPSC. (a) Representative example of ROS level in hiPSC line DMD03 compared to WT hESC. Fluorescence intensity per area (Image J) was normalized to WT hESC. (b) Spontaneous level of ROS measured by CellROX Green dye fluorescent signal in DMD hPSC lines is elevated compared to the WT hESC. Statistical significance was evaluated by One sample t-test comparing the values to normalized relative control in WT hESC and WT hiPSC (* p < 0.05, ** p < 0.01, *** p < 0.001). Error bars show standard deviation. (c) ROS production with ROS scavenger N-acetyl-l-cysteine (NAC) treatment was significantly decreased in all tested DMD hPSC lines but not WT hPSC lines compared to the cells with no treatment. ROS production with NOS inhibitor l-NAME decreased significantly in all DMD hPSC lines. Graph shows change in fluorescent intensity per area expressed as percentual value of untreated controls of corresponding hPSC line. Statistical difference was evaluated by two-way ANOVA comparing the NAC/l-NAME treated cells to non-treated control cells as well as WT cells compared to DMD cells. (d) ROS levels in DMD fibroblasts from both DMD patients used for reprogramming do not differ from three independent WT foreskin fibroblasts from newborn boys at similar passage number. Statistical difference was evaluated by one-way ANOVA. At least 3 biological repetitions were used in each experiment, exact value for each is represented by • in each graph.
Figure 4
Figure 4
Enzymatic NOS activity is increased in DMD hPSC lines. (a) NOS activity assay showed increased production of NO (in pmol/min/µg) in DMD hPSC lines when compared to WT hPSC. 6 independent repetitions (for each WT and DMD hPSC) were used for the analysis. Student t-test was used for statistical evaluation of significance (** p < 0.01). Errorbars show standard deviation. (b) All three NOS isoforms (nNOS, iNOS and eNOS) are expressed in WT as well as in DMD hPSC. For a positive control (+ctrl), HH (for NOX and nNOS), hepatocytes (for iNOS) or RPMI myeloma cells (for eNOS) were used. Water instead of cDNA was used for negative control (−ctrl). GAPDH was used as loading control. (c) mRNA analysis revealed that NOX2, is not expressed in pluripotent state. Human heart tissue (HH) was used as positive control, GAPDH was used as loading control. At least 3 biological repetitions were used in each experiment, exact value for each is represented by • in each graph.
Figure 5
Figure 5
Elevated ROS level in DMD hPSC leads to DNA damage. (a) Numbers of γH2AX foci representing the spontaneous DNA damage in DMD02, DMD03 and cDMD hPSC lines were significantly elevated compared to WT hESC and WT hiPSC. Spontaneous formation of γH2AX foci in all DMD hPSC lines significantly decreased after the NAC treatment to the level of WT hPSC. No effect of NAC on the WT hPSC lines was observed. All DMD lines show significant decrease in γH2AX foci formation after treatment with l-NAME corresponding to the decrease detected after NAC treatment. WT hiPSC show increase after l-NAME treatment. Statistical difference was evaluated by one-way ANOVA and Sidak’s multiple comparison test (* p < 0.05, ** p < 0.01, *** p < 0.001) for γH2AX foci number in between different lines, and unpaired Student’s t-test comparing the NAC/L/NAME treated cells to corresponding untreated control cells. Error bars represent standard deviation. (b) Representative image of γH2AX foci staining in CCTL14 (WT) and DMD02 (DMD) hiPSC showing higher number of γH2AX foci number in DMD nuclei compared to WT nuclei. γH2AX foci are stained in green, nuclei in blue with DAPI. Line represents 20 µm. (c) DNA damage is not increased in DMD fibroblasts before reprogramming. γH2AX foci number per nucleus in DMD fibroblasts from both DMD patients used for reprogramming does not differ from WT foreskin fibroblasts. Statistical difference was evaluated by one-way ANOVA. The errorbars show standard deviation. At least 3 biological repetitions were used in each experiment, exact value for each is represented by • in each graph.
Figure 6
Figure 6
All isoforms of NOS are responsible for increased DNA damage in DMD hPSC. (a) DNA damage analysis after downregulation of each individual NOS isoform’s expression show significant decrease in γH2AX foci formation in DMD hPSC while no significant effect was observed in WT hPSC. Graph shows γH2AX foci per nucleus for each individual hPSC line in untreated samples (control), after application of transfection reagent (X-treme) and with application of individual siRNA (nNOS, iNOS and eNOS). Statistical difference was evaluated by two-way ANOVA and Tukey’s multiple comparison test using the mutation and treatment presence as evaluation criteria (* p < 0.05, ** p < 0.01, *** p < 0.001, **** p < 0.0001). The error bars represent standard deviation. (b) DNA damage analysis after application of specific inhibitors to individual NOS isoforms (CAN = l-canavanine, l-NIO = (N(5)-(1-Iminoethyl)-l-ornithine HCl), SM = spermine, SMD = spermidine) show decreasing trend in γH2AX foci presence in DMD hPSC. CAN suppressed significantly DNA damage formation in DMD hPSC cell lines while no significant effect was observed in WT hPSC. Graph shows pooled data from WT hESC and hiPSC (WT) and all 3 DMD hPSC lines (DMD). Statistical difference was evaluated by one-way ANOVA and Sidak’s multiple comparisons test; ** p < 0.01, the error bars represent standard deviation. At least 3 biological repetitions were used in each experiment, exact value for each is represented by • in each graph.
Figure 6
Figure 6
All isoforms of NOS are responsible for increased DNA damage in DMD hPSC. (a) DNA damage analysis after downregulation of each individual NOS isoform’s expression show significant decrease in γH2AX foci formation in DMD hPSC while no significant effect was observed in WT hPSC. Graph shows γH2AX foci per nucleus for each individual hPSC line in untreated samples (control), after application of transfection reagent (X-treme) and with application of individual siRNA (nNOS, iNOS and eNOS). Statistical difference was evaluated by two-way ANOVA and Tukey’s multiple comparison test using the mutation and treatment presence as evaluation criteria (* p < 0.05, ** p < 0.01, *** p < 0.001, **** p < 0.0001). The error bars represent standard deviation. (b) DNA damage analysis after application of specific inhibitors to individual NOS isoforms (CAN = l-canavanine, l-NIO = (N(5)-(1-Iminoethyl)-l-ornithine HCl), SM = spermine, SMD = spermidine) show decreasing trend in γH2AX foci presence in DMD hPSC. CAN suppressed significantly DNA damage formation in DMD hPSC cell lines while no significant effect was observed in WT hPSC. Graph shows pooled data from WT hESC and hiPSC (WT) and all 3 DMD hPSC lines (DMD). Statistical difference was evaluated by one-way ANOVA and Sidak’s multiple comparisons test; ** p < 0.01, the error bars represent standard deviation. At least 3 biological repetitions were used in each experiment, exact value for each is represented by • in each graph.
Figure 7
Figure 7
DMD hPSC lines present increased mutation frequency (MF). (a) MF of both patient specific hiPSC lines (DMD02 and DMD03), cDMD line and WT hESC and hiPSC line were measured using HPRT reporter assay. The graph shows significantly elevated spontaneous MF in all DMD hPSC lines compared to both WT hPSC lines. (b) The parental patient specific fibroblasts (DMD02 and DMD03) were compared to WT human foreskin fibroblasts of similar passage to exclude artificial effect of present MF before the reprogramming. No statistical difference was found in between all analyzed fibroblast lines. Statistical difference was evaluated by one-way ANOVA and Sidak’s multiple comparison test (* p < 0.05, ** p < 0.01, *** p < 0.001, **** p < 0.0001). The error bars represent standard deviation. At least 3 biological repetitions were used in each experiment, exact value for each is represented by • in each graph.

Similar articles

Cited by

References

    1. Mah J.K., Korngut L., Dykeman J., Day L., Pringsheim T., Jette N. A systematic review and meta-analysis on the epidemiology of Duchenne and Becker muscular dystrophy. Neuromuscul. Disord. 2014;24:482–491. doi: 10.1016/j.nmd.2014.03.008. - DOI - PubMed
    1. Emery A.E.H. The muscular dystrophies. Lancet. 2002;359:687–695. doi: 10.1016/S0140-6736(02)07815-7. - DOI - PubMed
    1. Tidball J.G., Albrecht D.E., Lokensgard B.E., Spencer M.J. Apoptosis precedes necrosis of dystrophin-deficient muscle. (Pt 6)J. Cell Sci. 1995;108:2197–2204. - PubMed
    1. Mikhaĭlov V.M., Komarov S.A., Nilova V.K., Shteĭn G.I., Baranov V.S. Ultrastructural and morphometrical analysis of apoptosis stages in cardiomyocytes of MDX mice. Tsitologiia. 2001;43:729–737. - PubMed
    1. Finsterer J., Stöllberger C. The heart in human dystrophinopathies. Cardiology. 2003;99:1–19. doi: 10.1159/000068446. - DOI - PubMed

Publication types

MeSH terms