. 2019 Mar;39(3):446-458.
doi: 10.1161/ATVBAHA.118.312023.

IL (Interleukin)-33 Suppresses Abdominal Aortic Aneurysm by Enhancing Regulatory T-Cell Expansion and Activity

Affiliations

IL (Interleukin)-33 Suppresses Abdominal Aortic Aneurysm by Enhancing Regulatory T-Cell Expansion and Activity

Jingyong Li et al. Arterioscler Thromb Vasc Biol. 2019 Mar.

Abstract

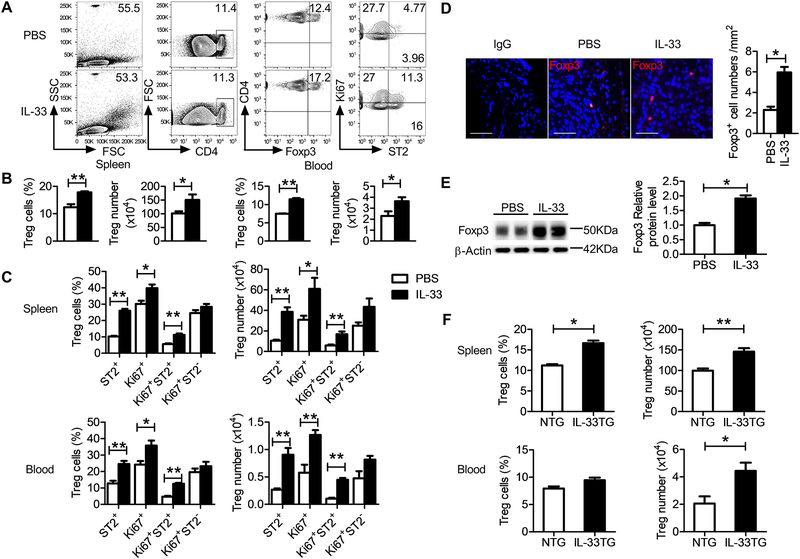
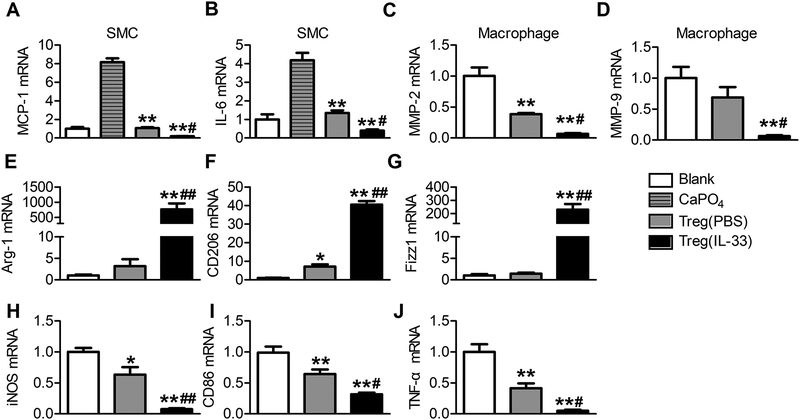
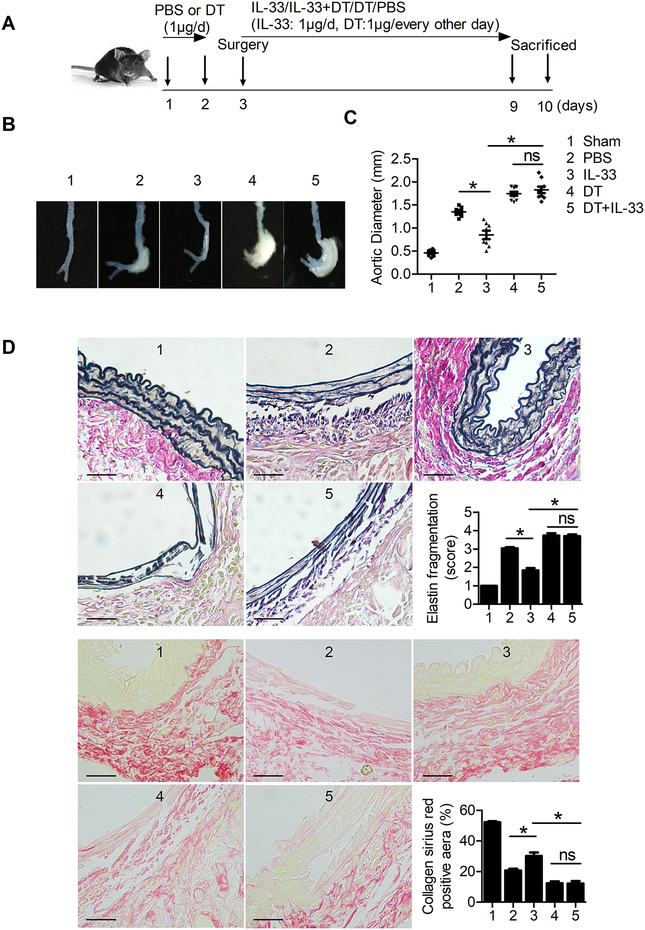
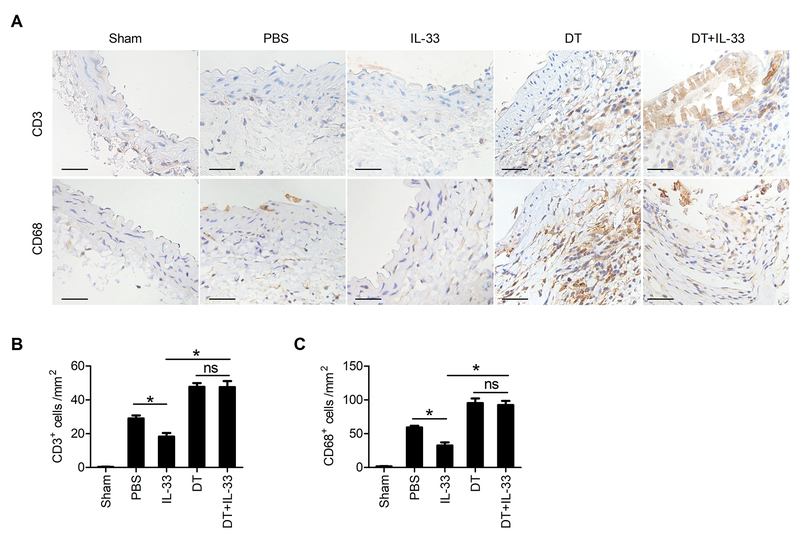
Objective- Inflammation occurs during the progression of abdominal aortic aneurysm (AAA). IL (interleukin)-33 is a pleiotropic cytokine with multiple immunomodulatory effects, yet its role in AAA remains unknown. Approach and Results- Immunoblot, immunohistochemistry, and immunofluorescent staining revealed increased IL-33 expression in adventitia fibroblasts from mouse AAA lesions. Daily intraperitoneal administration of recombinant IL-33 or transgenic IL-33 expression ameliorated periaorta CaPO4 injury- and aortic elastase exposure-induced AAA in mice, as demonstrated by blunted aortic expansion, reduced aortic wall elastica fragmentation, enhanced AAA lesion collagen deposition, attenuated T-cell and macrophage infiltration, reduced inflammatory cytokine production, skewed M2 macrophage polarization, and reduced lesion MMP (matrix metalloproteinase) expression and cell apoptosis. Flow cytometry analysis, immunostaining, and immunoblot analysis showed that exogenous IL-33 increased CD4+Foxp3+ regulatory T cells in spleens, blood, and aortas in periaorta CaPO4-treated mice. Yet, ST2 deficiency muted these IL-33 activities. Regulatory T cells from IL-33-treated mice also showed significantly stronger activities in suppressing smooth muscle cell inflammatory cytokine and chemokine expression, macrophage MMP expression, and in increasing M2 macrophage polarization than those from vehicle-treated mice. In contrast, IL-33 failed to prevent AAA and lost its beneficial activities in CaPO4-treated mice after selective depletion of regulatory T cells. Conclusions- Together, this study established a role of IL-33 in protecting mice from AAA formation by enhancing ST2-dependent aortic and systemic regulatory T-cell expansion and their immunosuppressive activities.

Keywords: T lymphocytes, regulatory; animals; aortic aneurysm, abdominal; interleukin-33; mice.


Figures

Figure 1.
Figure 1.
Expression of IL-33 and its receptor ST2 in mouse AAA lesions. Immunoblot (A), relative protein level (B), and RT-PCR analysis (C) of IL-33 expression in aortic tissues of mice from both the NaCl and CaPO4 groups (n=5 per group). Immunoblot (D) and relative protein level (E) of ST2 in aortic tissues from NaCl- and CaPO4-treated mice. Representative immunostaining of IL-33 in the aorta (F) and quantitative analysis of IL-33-positive cells (G) (n=5 per group). The arrows indicate the IL-33-positive cells (brown). Goat IgG was used as antibody isotype negative control. Scale bar: 50 μm. H. RT-PCR analysis of IL-33 mRNA levels in CD45+ and CD45 fractions from digested aortas (n=8 per group). I. Immunofluorescent co-staining of IL-33 with fibroblast vimentin and SMC α-smooth muscle actin (α-SMA) in AAA lesions. All sections were from CaPO4-induced AAA mice. Rabbit IgG was used as corresponding antibody isotype controls. Scale bar: 100 μm. Data are Mean±SEM. *P<0.05 and **P<0.01, unpaired t test was used in B, and E, Mann–Whitney test was used in C, G, and H.
Figure 2.
Figure 2.
AAA lesion size, elastica fragmentation, and collagen deposition. Mice treated with IL-33 or PBS or IL-33-transgenic (IL-33TG) or non-transgenic (NTG) mice were used to induce AAA by CaPO4 aortic injury. NaCl-treated mice served as baseline control. A. Representative photographs of abdominal aortic fragments. B. Maximal external diameters of infrarenal aortas were detected 7 days after surgery (n=13~15 per group). C. Representative images of elastica Verhoeff–Van Gieson staining and Sirius red collagen staining. Scale bar: 50 μm. D. Assessment of medial elastica fragmentation and collagen Sirius red-positive area (n=5 per group). Elastica fragmentation grading keys are shown to the left. Data are Mean±SEM. *P<0.05 vs. PBS group, #P<0.05 vs. NTG group, one-way ANOVA was used in B, Mann–Whitney test was used in D.
Figure 3.
Figure 3.
Inflammatory responses in AAA lesions from PBS- or IL-33-treated mice and mice with (IL-33TG) and without (NTG) IL-33 transgene. A. Representative images of CD3+ T-cell and CD68+ macrophage staining. Rabbit IgG and mouse IgG were used as isotype controls for CD3 and CD68 antibodies, respectively. Scale bar: 50 μm. B. Quantification of CD3+ T-cell and CD68+ macrophage numbers in aortic tissues (n=5 per group). C-E. RT-PCR analysis of inflammatory chemokine and cytokine and M1/M2 macrophage gene expression and gate strategy and flow cytometry analysis of CD11c+CD206 M1 and CD11cCD206+ M2 macrophages of AAA lesions from different groups of mice as indicated (n=5 per group). Data are Mean±SEM. *P<0.05 and **P<0.01 vs. PBS group, #P<0.05 and ##P<0.01 vs. NTG group, unpaired 2-tailed t test.
Figure 4.
Figure 4.
Increased Treg expansion in mice after IL-33 administration or transgenic expression. A. Gate strategy and flow cytometry analysis of splenic Foxp3+ Tregs and ST2 or Ki67 expression. B-C. Percentages and numbers of Foxp3+ Tregs in the spleen and blood from IL-33- and PBS-treated mice (n=5 per group). D. Representative immunofluorescent staining of Foxp3-positive cells and quantification of Foxp3-positive cells (n=5 per group) in AAA lesions from PBS- and IL-33-treated mice. Rat IgG was used as Foxp3 antibody isotype control. Scale bar: 50 μm. E. Western blot and relative Foxp3 protein level in AAA lesions from PBS- and IL-33-treated mice (n=5 per group). F. Percentages and numbers of CD4+Foxp3+ Tregs in the spleen and blood from NTG and IL-33TG mice (n=5 per group). Data are Mean±SEM. *P<0.05 and **P<0.01, unpaired 2-tailed t test.
Figure 5.
Figure 5.
IL-33 enhances Treg immunosuppressive activity on SMCs and macrophages. Mouse aortic SMCs or RAW264.7 cells were incubated with Tregs from PBS or IL-33-treated mice at ratios of 10:1 in the presence of anti-CD3 (2 μg/ml) and anti-CD28 (1 μg/ml). After 48 hours of co-culture, CaCl2 (0.05 M) and PBS (0.05 M) were added to the supernatant of the SMCs for 30 min. A-B. IL-6 and MCP-1 mRNA levels in SMCs. **P<0.01 vs. CaPO4, #P<0.05 vs. Tregs (PBS), one-way ANOVA. C-J. RT-PCR detected the mRNA levels of MMP-2, MMP-9, TNF-α, Arg-1, CD206, Fizz1, iNOS and CD86 in RAW264.7 cells. Data are representative of five independent experiments. Data are Mean±SEM. *P<0.05 and **P<0.01 vs. blank, #P<0.05 and ##P<0.01 vs. Tregs (PBS), one-way ANOVA.
Figure 6.
Figure 6.
CaPO4-induced AAA size, lesion elastica fragmentation, and collagen deposition in DEREG mice with different treatments, including PBS (n=8), IL-33 (n=8), diphtheria toxin (DT, n=10), or IL-33 with DT (n=9). Sham-operated DEREG mice (n=10) served as the controls. A. Experimental procedure and timeline of surgery and treatment. B. Representative photographs of abdominal aortic fragments from the 5 groups of mice. C. Maximal external diameter of the infrarenal aortas at 7 days after the operation. D. Representative images of Verhoeff–Van Gieson elastin staining and Sirius red collagen staining in 5 groups of mice and the assessment of medial elastica fragmentation and collagen deposition (n=5 per group). Scale bar: 50 μm. Data are Mean±SEM. *P<0.01, one-way ANOVA.
Figure 7.
Figure 7.
CD3+ T cells and CD68+ macrophages in CaPO4-induced AAA lesions from DEREG mice with different treatments, including PBS (n=8), IL-33 (n=8), DT (n=10), or IL-33 with DT (n=9). Sham-operated DEREG mice (n=10) served as the controls. A. Representative images of CD3+ T cells and CD68+ macrophages in 5 groups of mice. B-C. Quantification of CD3+ T cells and CD68+ macrophages in AAA lesions. Scale bar: 50 μm. Data are Mean±SEM. *P<0.01, one-way ANOVA.

Comment in

Similar articles

Cited by

References

    1. Nordon IM, Hinchliffe RJ, Loftus IM, Thompson MM. Pathophysiology and epidemiology of abdominal aortic aneurysms. Nat Rev Cardiol. 2011;8:92–102. - PubMed
    1. Hellenthal FA, Buurman WA, Wodzig WK, Schurink GW. Biomarkers of AAA progression. Part 1: extracellular matrix degeneration. Nat Rev Cardiol. 2009;6:464–474. - PubMed
    1. Hellenthal FA, Buurman WA, Wodzig WK, Schurink GW. Biomarkers of abdominal aortic aneurysm progression. Part 2: inflammation. Nat Rev Cardiol. 2009;6:543–552. - PubMed
    1. Shimizu K, Mitchell RN, Libby P. Inflammation and cellular immune responses in abdominal aortic aneurysms. Arterioscler Thromb Vasc Biol. 2006; 26(5): 987–994. - PubMed
    1. Longo GM, Xiong W, Greiner TC, Zhao Y, Fiotti N, Baxter BT. Matrix metalloproteinases 2 and 9 work in concert to produce aortic aneurysms. J Clin Invest. 2002;110:625–632. - PMC - PubMed

Publication types

MeSH terms