. 2019 Jan 16;16(1):10.
doi: 10.1186/s12974-019-1398-3.

Cathepsin C promotes microglia M1 polarization and aggravates neuroinflammation via activation of Ca2+-dependent PKC/p38MAPK/NF-κB pathway

Affiliations

Cathepsin C promotes microglia M1 polarization and aggravates neuroinflammation via activation of Ca2+-dependent PKC/p38MAPK/NF-κB pathway

Qing Liu et al. J Neuroinflammation. .

Erratum in

Abstract

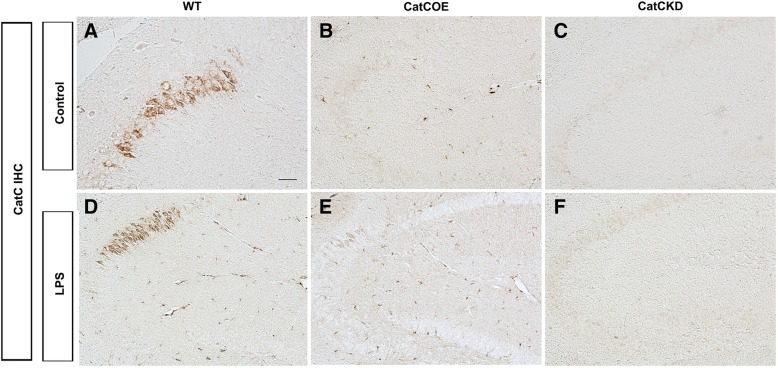
Background: Microglia-derived lysosomal cathepsins are important inflammatory mediators to trigger signaling pathways in inflammation-related cascades. Our previous study showed that the expression of cathepsin C (CatC) in the brain is induced predominantly in activated microglia in neuroinflammation. Moreover, CatC can induce chemokine production in brain inflammatory processes. In vitro studies further confirmed that CatC is secreted extracellularly from LPS-treated microglia. However, the mechanisms of CatC affecting neuroinflammatory responses are not known yet.

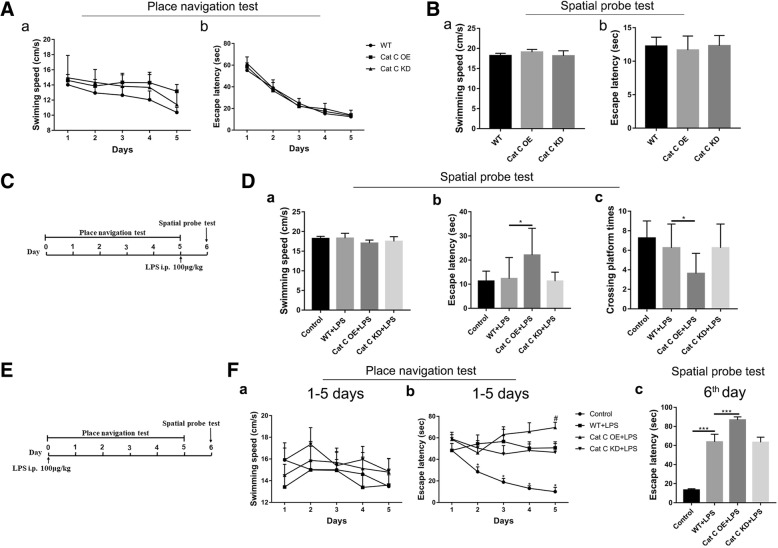
Methods: CatC over-expression (CatCOE) and knock-down (CatCKD) mice were treated with intraperitoneal and intracerebroventricular LPS injection. Morris water maze (MWM) test was used to assess the ability of learning and memory. Cytokine expression in vivo was detected by in situ hybridization, quantitative PCR, and ELISA. In vitro, microglia M1 polarization was determined by quantitative PCR. Intracellular Ca2+ concentration was determined by flow cytometry, and the expression of NR2B, PKC, p38, IkBα, and p65 was determined by western blotting.

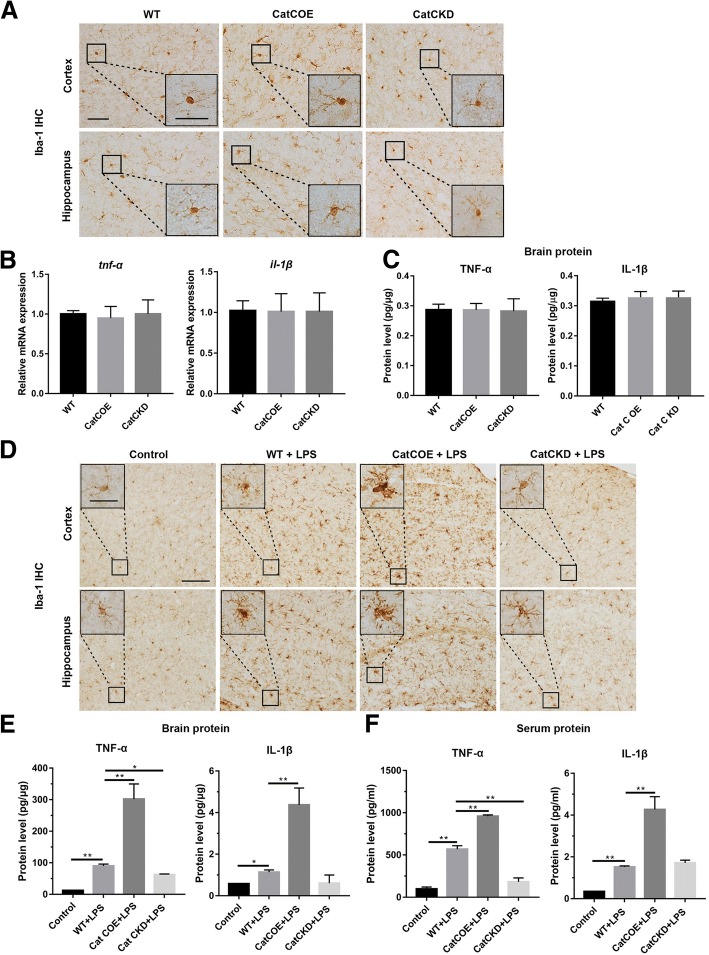
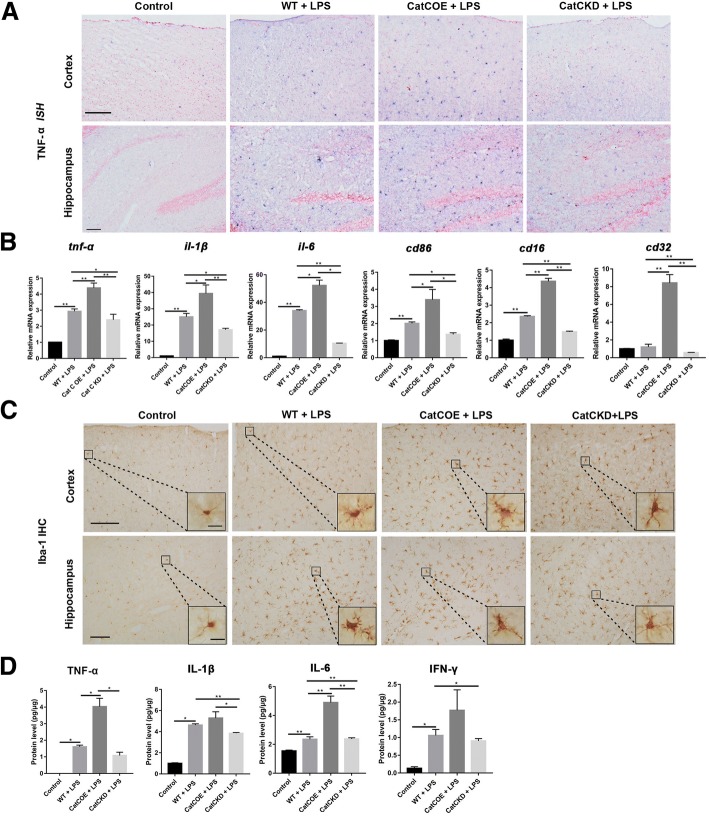
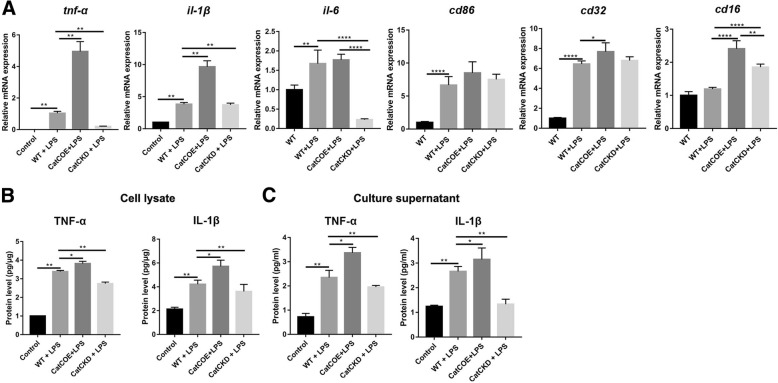
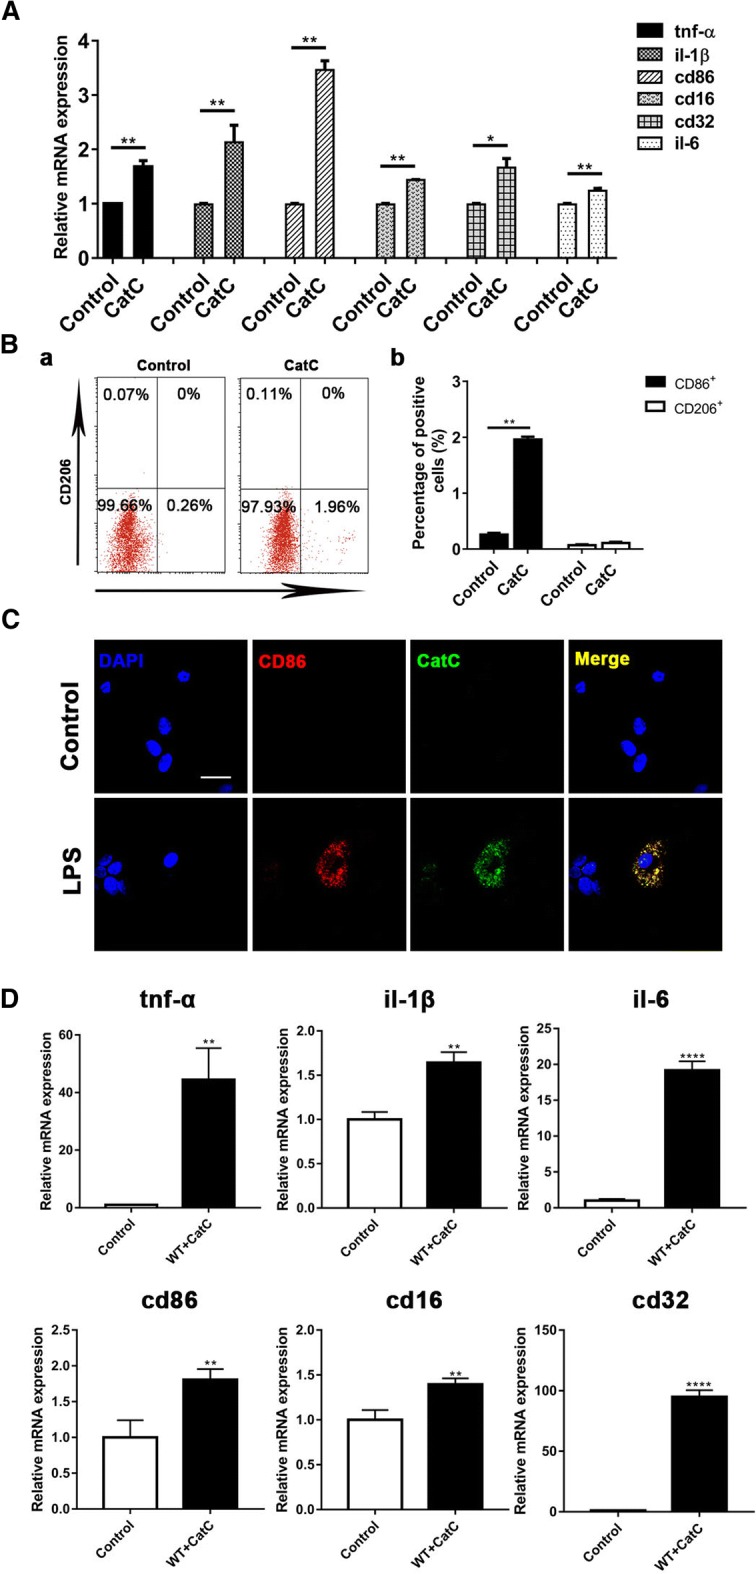
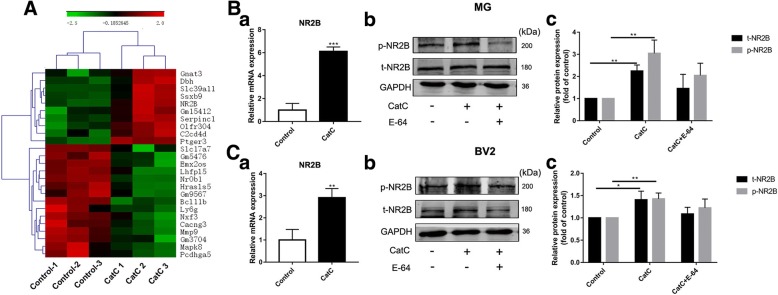
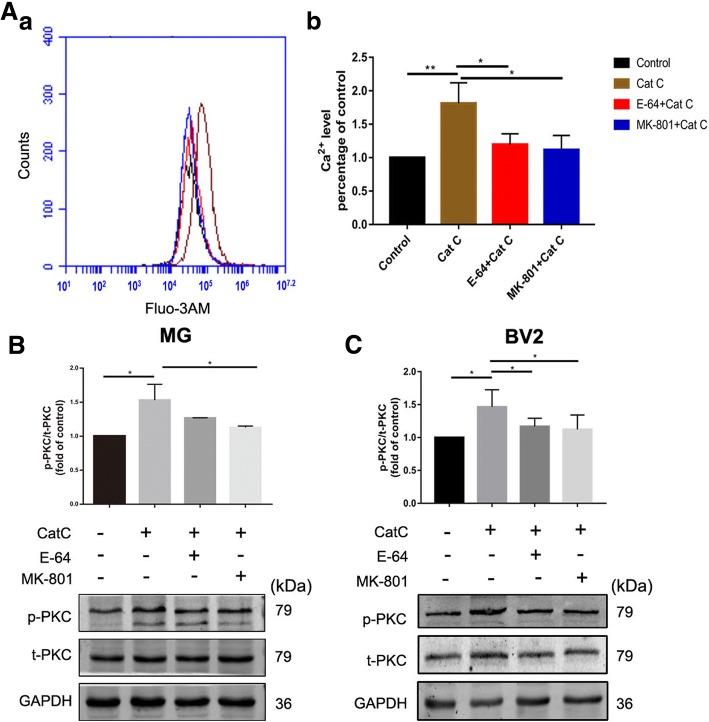
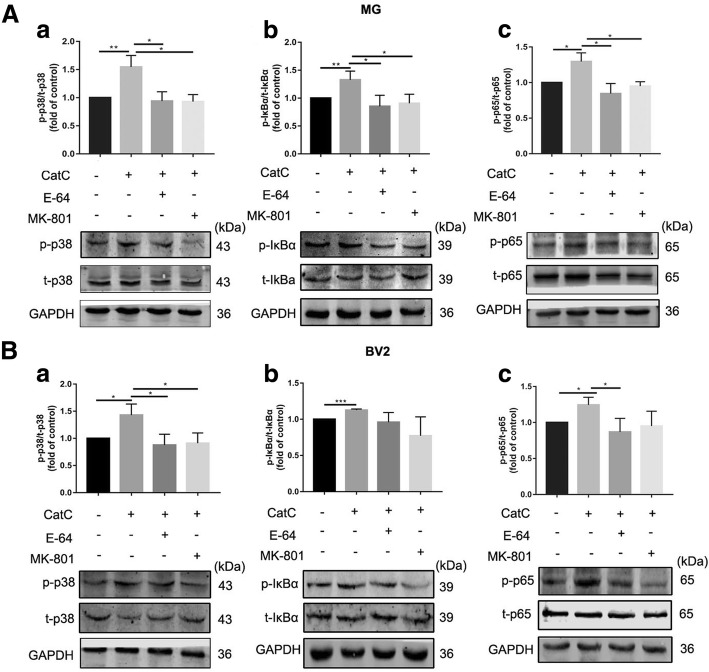
Results: The LPS-treated CatCOE mice exhibited significantly increased escape latency compared with similarly treated wild-type or CatCKD mice. The highest levels of TNF-α, IL-1β, and other M1 markers (IL-6, CD86, CD16, and CD32) were found in the brain or serum of LPS-treated CatCOE mice, and the lowest levels were detected in CatCKD mice. Similar results were found in LPS-treated microglia derived from CatC differentially expressing mice or in CatC-treated microglia from wild-type mice. Furthermore, the expression of NR2B mRNA, phosphorylation of NR2B, Ca2+ concentration, phosphorylation of PKC, p38, IκBα, and p65 were all increased in CatC-treated microglia, while addition of E-64 and MK-801 reversed the phosphorylation of above molecules.

Conclusion: The data suggest that CatC promotes microglia M1 polarization and aggravates neuroinflammation via activation of Ca2+-dependent PKC/p38MAPK/NF-κB pathway. CatC may be one of key molecular targets for alleviating and controlling neuroinflammation in neurological diseases.

Keywords: Cathepsin C; Cytokine; Microglia; NR2B; Neuroinflammation.


Conflict of interest statement

Ethics approval and consent to participate

All animal experiments were approved by the Institutional Animal Care and Use Committee at Dalian Medical University.

Consent for publication

Not applicable.

Competing interests

The authors declare that they have no competing interests.

Publisher’s Note

Springer Nature remains neutral with regard to jurisdictional claims in published maps and institutional affiliations.

Figures

Fig. 1
Fig. 1
The effects of differential expression of CatC on learning and memory ability. MWM test was performed in the untreated WT, CatCOE, and CatCKD mice. Place navigation test lasted for 5 days, and spatial probe test was performed on the sixth day. A Learning ability of untreated mice was determined by the swimming speed (a) and escape latency (b) of place navigation test. B Memory ability of untreated mice was determined by swimming speed (a) and escape latency (b) of spatial probe test. C LPS was injected after 5-day place navigation test as shown in time axis, and spatial probe test was performed after 24 h later. D Memory ability of LPS-injected mice was determined by swimming speed (a), escape latency (b), and crossing platform times (c) of spatial probe test. E Detection of learning ability of LPS-injected mice was illustrated in time axis. F Learning ability of 5-day place navigation test was determined by the swimming speed (a), escape latency (b); the escape latency of the sixth day is shown in c. The data represent mean ± SEM, n = 7–9. *P ≤ 0.05, ***P ≤ 0.001. *P ≤ 0.05, 2~5th days vs. 1st day in control, #P ≤ 0.05, WT + LPS vs. CatCOE + LPS in Fig. 1F (b)
Fig. 2
Fig. 2
The expression of CatC in the transgenic mouse brain before and after administration of LPS. WT, CatCOE, and CatCKD mice were intraperitoneally injected with LPS (100 μg/kg) for 24 h before the brains were isolated. Immunohistochemical staining for CatC was performed on the frozen brain sections. LPS induced CatC expression in WT (D) and CatCOE (E) mice, but not in CatCKD (F) mice. Scale bars, 100 μm
Fig. 3
Fig. 3
The effects of differential expression of CatC on microglia and proinflammatory cytokines in the brain. After spatial probe test, the activation of microglia was detected by Iba1 IHC staining in cortex and hippocampus of untreated mice (A) and LPS (i.p.)-injected mice (D). The levels of TNF-α and IL-1β were measured in untreated mice (B, C) and LPS-injected mice (E, F). The levels of TNF-α and IL-1β were determined by qRT-PCR and ELISA. Scale bars, 100 μm (main panels), 25 μm (insets). *P ≤ 0.05, **P ≤ 0.01. n = 3 (AD), n = 3–5 (E, F)
Fig. 4
Fig. 4
The effects of differential expression of CatC on M1 polarization of microglia in the brain. TNF-α ISH staining in cortex and hippocampus was performed 24 h after LPS (1 mg/kg, i.c.v.) injection (A). The levels of TNF-α and IL-1β were measured by qRT-PCR (B) and ELISA (D), respectively. The activation of microglia in cortex and hippocampus was detected by Iba1 IHC staining (C). Scale bars, 200 μm (main panels, first and second rows), 500 μm (main panels, third row), 100 μm (main panels, fourth row), 50 μm (insets). *P ≤ 0.05, **P ≤ 0.01. n = 3(A, B), n = 3–5 (C, D)
Fig. 5
Fig. 5
The effects of differential expression of CatC on M1 polarization of microglia in vitro. Primary cultured microglia from WT, CatCOE, and CatCKD mice were stimulated with LPS (50 ng/ml) for 24 h. A The mRNA expressions of TNF-α, IL-1β, IL-6, CD86, CD32, and CD16 were measured by qRT-PCR. B The levels of TNF-α and IL-1β in cellular lysate and culture supernatant were measured by ELISA. *P ≤ 0.05, **P ≤ 0.01, ****P ≤ 0.0001
Fig. 6
Fig. 6
The effects of CatC stimulation on the expression of M1 markers of microglia in vitro. Primary cultured microglia from WT mice was stimulated with active CatC (10 ng/ml) for 18 h. A The mRNA expressions of TNF-α, IL-1β, CD86, CD16, CD32, and IL-6 were measured by qRT-PCR. B The percentages of CD86+ and CD206+ cells were measured by flow cytometry. C CD86 and CatC co-expression was detected by immunofluorescent staining after LPS (50 ng/ml) treatment for 18 h. D The mRNA expressions of TNF-α, IL-1β, CD86, CD16, CD32, and IL-6 were measured by qRT-PCR in mice with injection of CatC (0.43 mg/μl, i.c.v.) for 6 h. Scale bars, 25 μm. The data represent mean ± SEM, n = 3. *P < 0.05, ** P < 0.01, ****P < 0.0001
Fig. 7
Fig. 7
The changes of expression of NR2B in CatC-stimulated microglia in vitro. Primary cultured microglia form WT mice were stimulated with 100 ng/ml active CatC for 24 h, then microarray-based gene expression analysis was performed. A The heat map showed 25 differentially expressed genes, including 10 upregulated genes and 15 downregulated genes. B The mRNA expression of NR2B was verified by qRT-PCR with 100 ng/ml active CatC stimulation and/or cathepsin inhibitor E-64 (50μΜ) for 12 h (a). Phosphorylated NR2B (p-NR2B) and total NR2B (t-NR2B) expressions were quantified in CatC-stimulated microglia by western blot analysis (b, c). C The same experiments were performed in BV2 cells. GAPDH as a loading control. The data represent the increased folds of treatment groups relative to the control. The data represent mean ± SEM, n = 3. *P < 0.05, **P < 0.01, ***P < 0.001
Fig. 8
Fig. 8
CatC stimulation increased the concentration of intracellular Ca2+ and induced PKC activation. BV2 cells were stimulated with active CatC (100 ng/ml) and co-stimulated with E-64 (50 μM) or pre-incubated with MK-801 (10 μM) for 6 h. Then, intracellular Ca2+ concentration was measured by flow cytometry (A). Primary cultured microglia form WT mice and BV2 cells were stimulated with active CatC (100 ng/ml), or co-stimulated with E-64 (50 μM), or treated with MK-801 (10 μM) prior to CatC stimulation for 12 h. The expressions of p-PKC and t-PKC were quantified by western blot analysis in primary cultured microglia (B) and BV2 cells (C). The bands shown are representative of three independent experiments. GAPDH as a loading control. The statistics are shown as increased folds of treatment groups to the control. The data represent mean ± SEM, n = 3. *P < 0.05, **P < 0.01
Fig. 9
Fig. 9
CatC activated p38 MAPK/NF-κB signaling pathway in microglia. A Primary cultured microglia from WT mice were treated with active CatC (100 ng/ml), or co-stimulated with E-64 (50 μM), or pretreated with MK-801 (10 μM). The expressions of p-p38, t-p38, p-IκBα, t-IκBα, p-p65, and t-p65 were quantified by western blot analysis. The levels of p-p38/t-p38 (a), p-IκBα/t-IκBα (b), p-p65/t-p65 (c) were shown as increased folds of treatment groups relative to control group. B Activation of p38 MAPK/NF-κB signaling pathway was examined in BV2 cells. The bands shown are representative of three independent experiments. The data represent mean ± SEM, n = 3. *P < 0.05, **P < 0.01

Similar articles

Cited by

References

    1. A P, Kos J. Cysteine cathepsins in neurological disorders. Mol Neurobiol. 2014;49(2):1017–1030. doi: 10.1007/s12035-013-8576-6. - DOI - PubMed
    1. ER A, RM Y. Redundancy between cysteine cathepsins in murine experimental autoimmune encephalomyelitis. PLoS One. 2015;10(6):e0128945. doi: 10.1371/journal.pone.0128945. - DOI - PMC - PubMed
    1. Xu M, Yang L, Rong JG, Ni Y, Gu WW, Luo Y, Ishidoh K, Katunuma N, Li ZS, Zhang HL. Inhibition of cysteine cathepsin B and L activation in astrocytes contributes to neuroprotection against cerebral ischemia via blocking the tBid-mitochondrial apoptotic signaling pathway. Glia. 2014;62(6):855–880. doi: 10.1002/glia.22645. - DOI - PubMed
    1. Hook GR, Yu J, Sipes N, Pierschbacher MD, Hook V, Kindy MS. The cysteine protease cathepsin B is a key drug target and cysteine protease inhibitors are potential therapeutics for traumatic brain injury. J Neurotrauma. 2014;31(5):515–529. doi: 10.1089/neu.2013.2944. - DOI - PMC - PubMed
    1. Hafner A, Glavan G, Obermajer N, Živin M, Schliebs R, Kos J. Neuroprotective role of γ-enolase in microglia in a mouse model of Alzheimer’s disease is regulated by cathepsin X. Aging Cell. 2013;12(4):604–614. doi: 10.1111/acel.12093. - DOI - PubMed

MeSH terms