

Environmental justice and drinking water quality: are there socioeconomic disparities in nitrate levels in U.S. drinking water?
- PMID: 30651108
- PMCID: PMC6335696
- DOI: 10.1186/s12940-018-0442-6
Environmental justice and drinking water quality: are there socioeconomic disparities in nitrate levels in U.S. drinking water?
Abstract
Background: Low-income and minority communities often face disproportionately high pollutant exposures. The lead crisis in Flint, Michigan, has sparked concern about broader socioeconomic disparities in exposures to drinking water contaminants. Nitrate is commonly found in drinking water, especially in agricultural regions, and epidemiological evidence suggests elevated risk of cancer and birth defects at levels below U.S. EPA's drinking water standard (10 mg/L NO3-N). However, there have been no nationwide assessments of socioeconomic disparities in exposures to nitrate or other contaminants in U.S. drinking water. The goals of this study are to identify determinants of nitrate concentrations in U.S. community water systems (CWSs) and to evaluate disparities related to wealth or race/ethnicity.
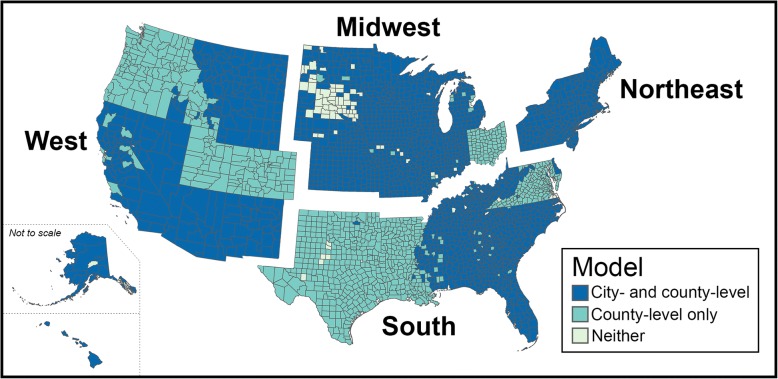
Methods: We compiled nitrate data from 39,466 U.S. CWSs for 2010-2014. We used EPA's Safe Drinking Water Information System (SDWIS) to compile CWS characteristics and linked this information with both city- and county-level demographic data gathered from the U.S. Census Bureau. After applying multiple imputation methods to address censored nitrate concentration data, we conducted mixed-effects multivariable regression analyses at national and regional scales.
Results: 5.6 million Americans are served by a CWS that had an average nitrate concentration ≥ 5 mg/L NO3-N between 2010 and 2014. Extent of agricultural land use and reliance on groundwater sources were significantly associated with nitrate. The percent of Hispanic residents served by each system was significantly associated with nitrate even after accounting for county-level cropland and livestock production, and CWSs in the top quartile of percent Hispanic residents exceeded 5 mg/L nearly three times as often as CWSs serving the lowest quartile. By contrast, the percent of residents living in poverty and percent African American residents were both inversely associated with nitrate.
Conclusions: Epidemiological evidence for health effects associated with drinking water above 5 mg/L NO3-N raises concerns about increased risk for the 5.6 million Americans served by public water supplies with average nitrate concentrations above this level. The associations we observed between nitrate concentrations and proportions of Hispanic residents support the need for improved efforts to assist vulnerable communities in addressing contamination and protecting source waters. Future studies can extend our methods to evaluate disparities in exposures to other contaminants and links to health effects.
Keywords: Agricultural pollution; Community water systems; Disparities; Drinking water; Environmental justice; Exposure; Land use; Nitrate; Safe Drinking Water Act; Water quality.
Conflict of interest statement
Ethics approval and consent to participate
Not applicable
Consent for publication
Not applicable
Competing interests
The authors declare that they have no competing interests.
Publisher’s Note
Springer Nature remains neutral with regard to jurisdictional claims in published maps and institutional affiliations.
Figures
References
-
- U.S. Environmental Protection Agency (US EPA). Providing Safe Drinking Water in America: 2013 National public water systems compliance report. 305-R-15-001. Washington, D.C.: Office of Enforcement and Compliance Assurance. p. 2015.
-
- Bullard RD, Johnson GS. Environmental justice: grassroots activism and its impact on public policy decision making. J Soc Issues. 2000;56(3):555–578. doi: 10.1111/0022-4537.00184. - DOI
Publication types
MeSH terms
Substances
LinkOut - more resources
Full Text Sources
Medical
Research Materials
