. 2019 Jan 16;21(1):6.
doi: 10.1186/s13058-018-1071-2.

Hydrodynamic shear stress promotes epithelial-mesenchymal transition by downregulating ERK and GSK3β activities

Affiliations

Hydrodynamic shear stress promotes epithelial-mesenchymal transition by downregulating ERK and GSK3β activities

Hye Yeon Choi et al. Breast Cancer Res. .

Abstract

Background: Epithelial-mesenchymal transition (EMT) occurs in the tumor microenvironment and presents an important mechanism of tumor cell intravasation, stemness acquisition, and metastasis. During metastasis, tumor cells enter the circulation to gain access to distant tissues, but how this fluid microenvironment influences cancer cell biology is poorly understood.

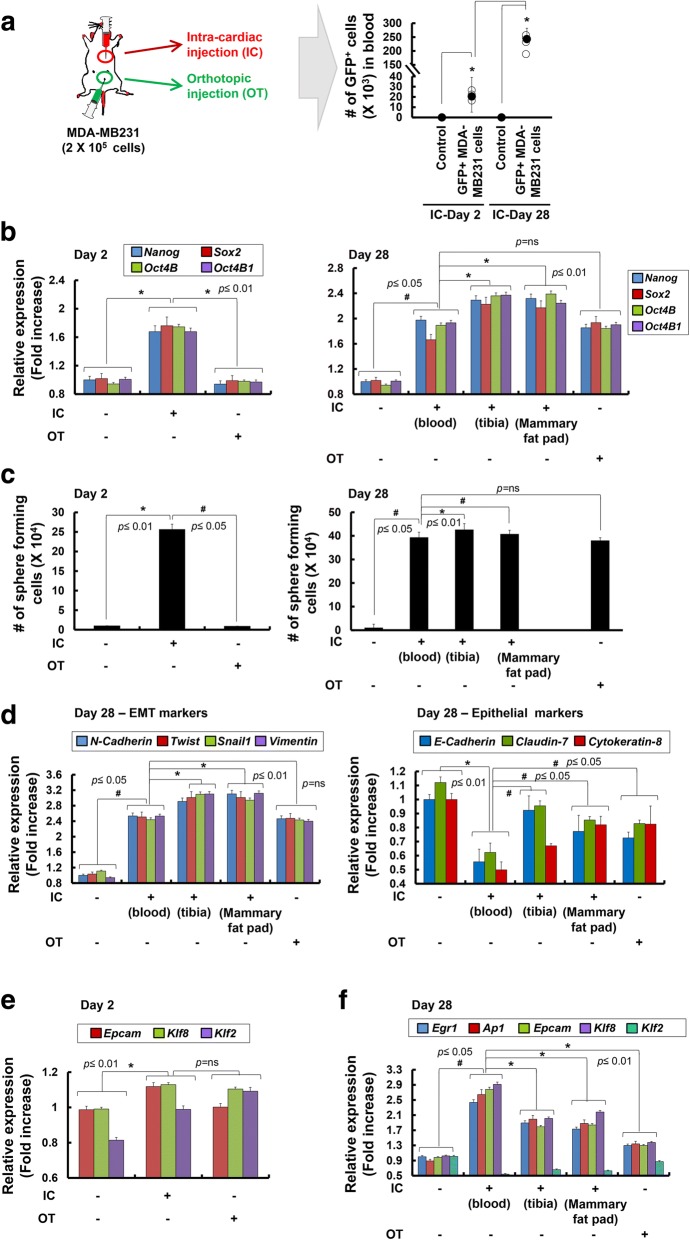
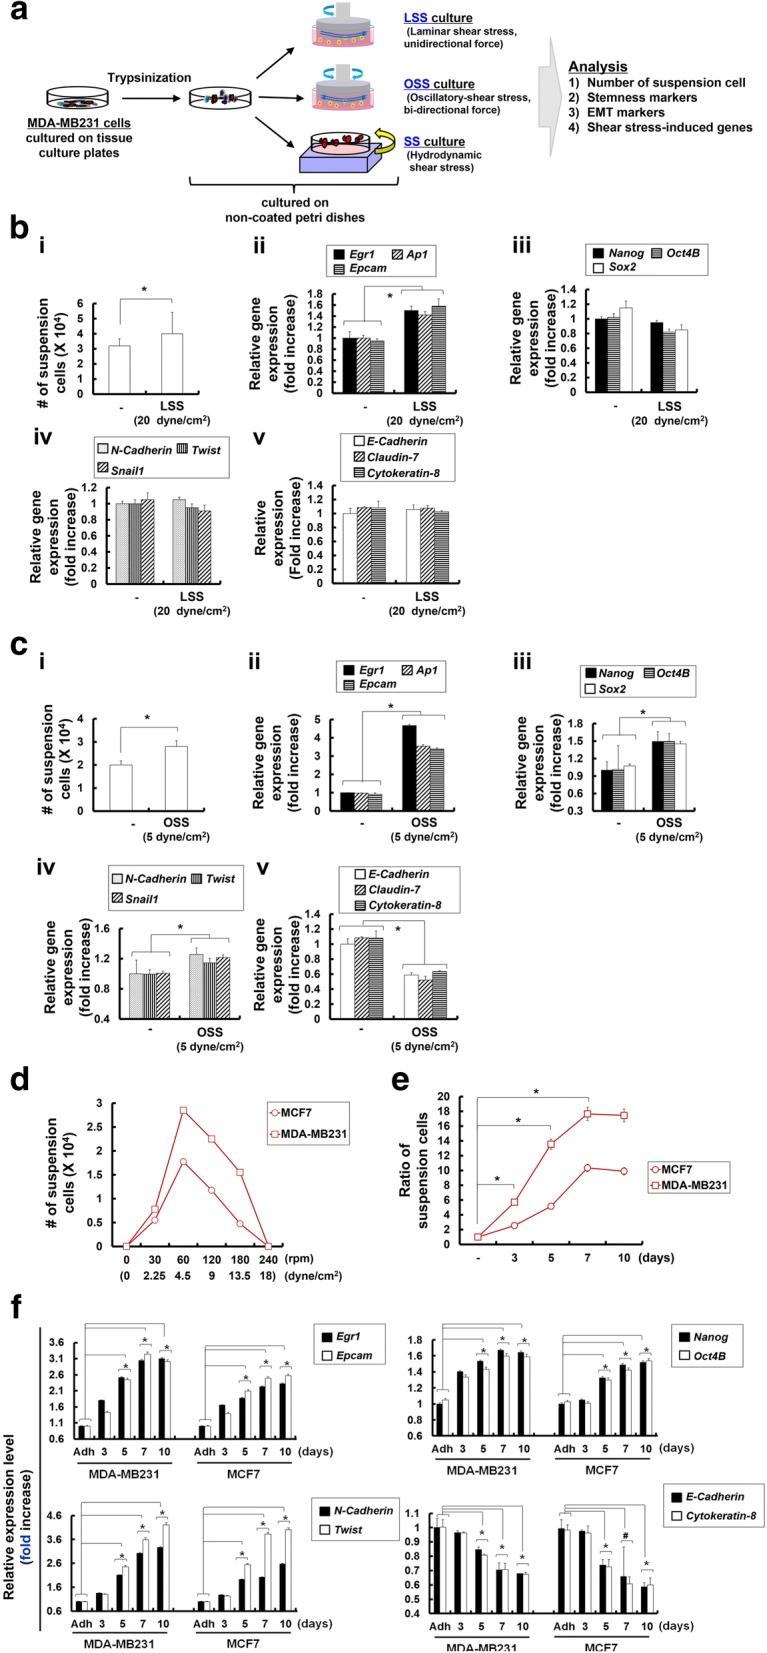
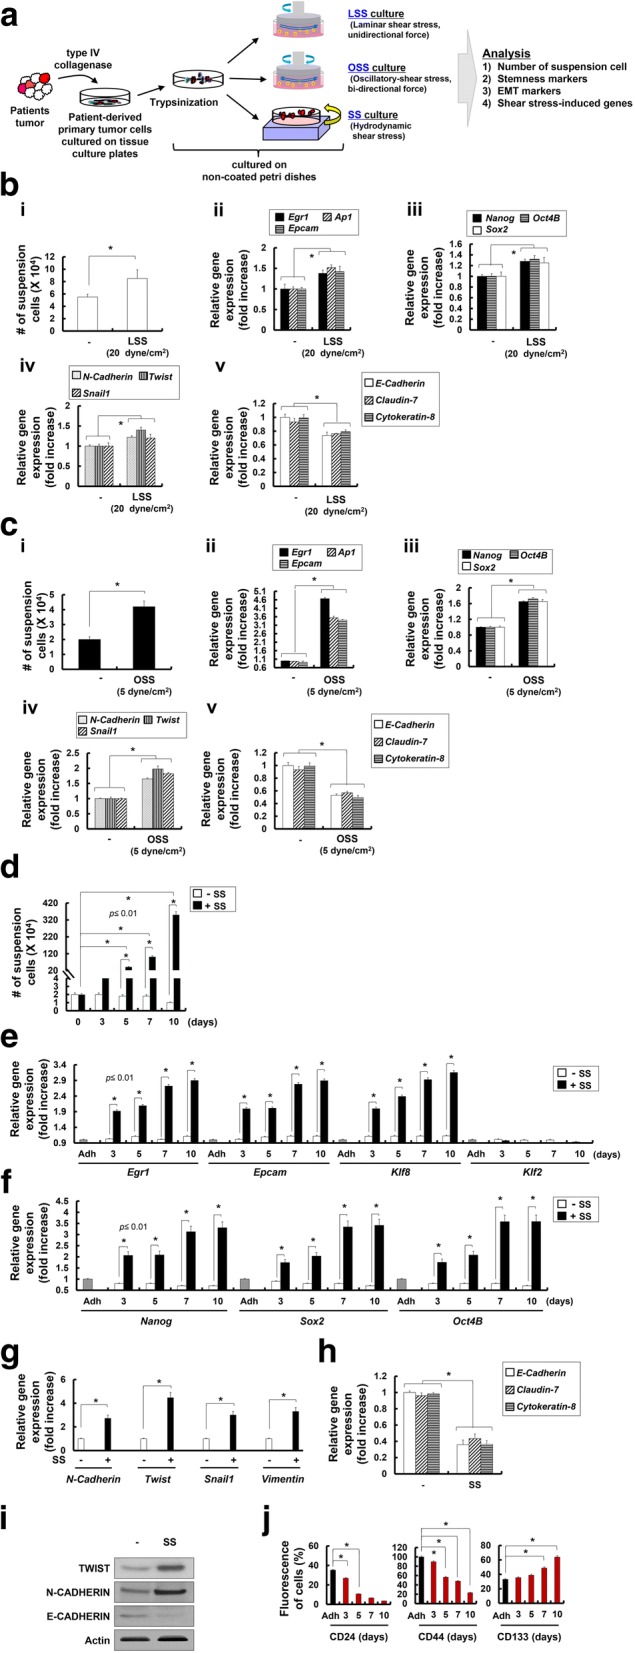
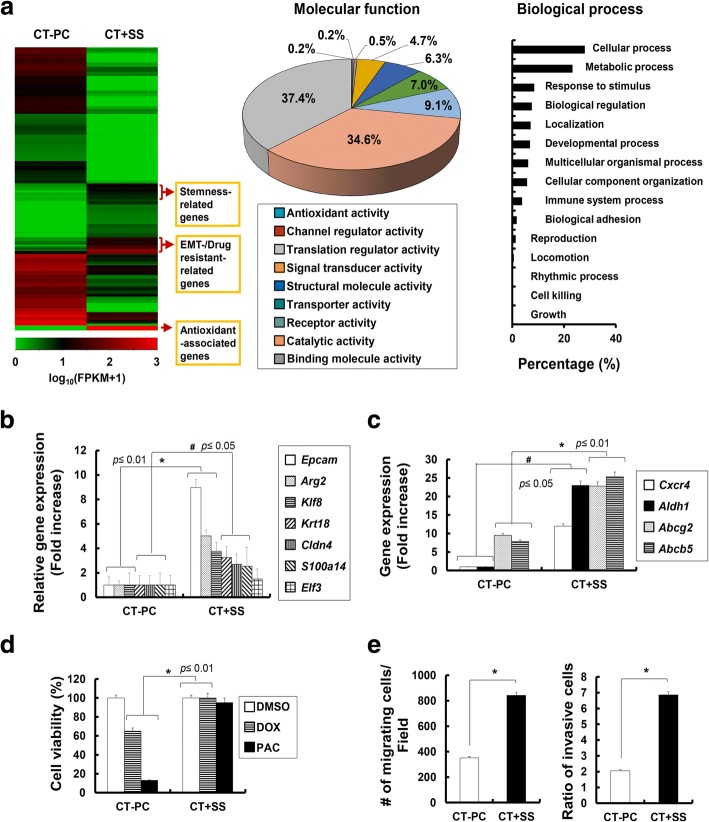
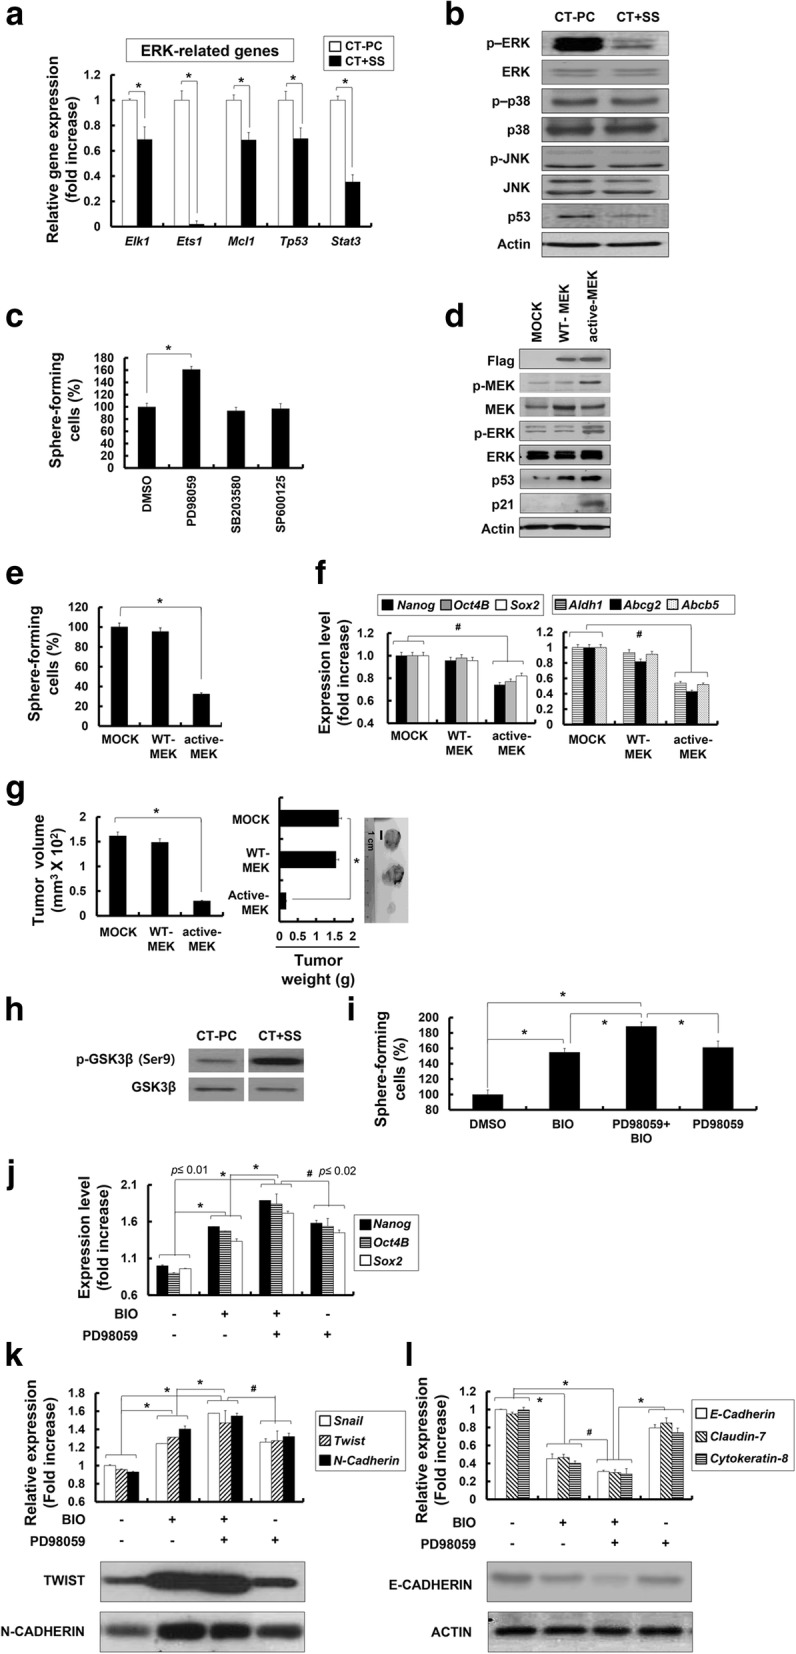
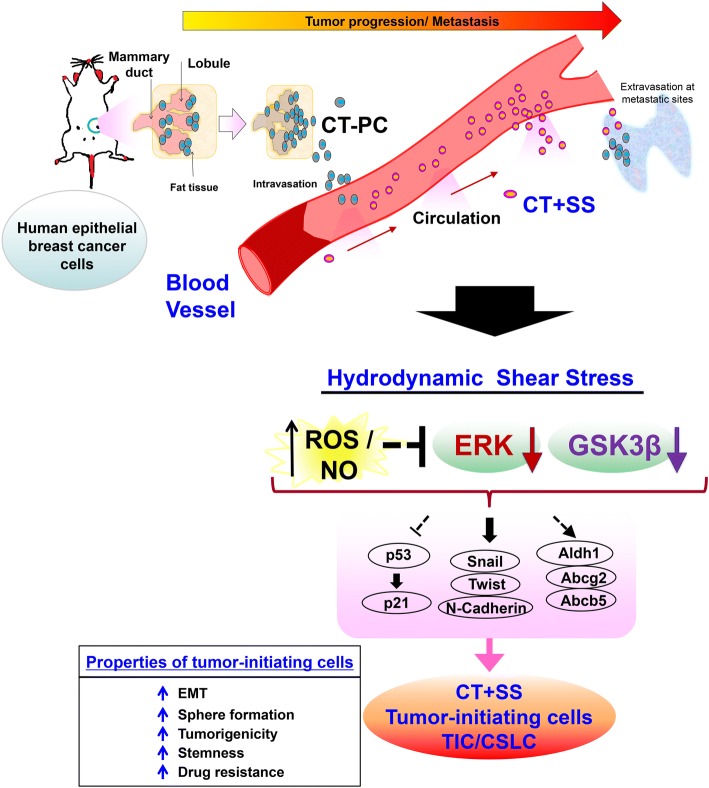
Methods and results: Here, we present both in vivo and in vitro evidence that EMT-like transition also occurs in circulating tumor cells (CTCs) as a result of hydrodynamic shear stress (+SS), which promotes conversion of CD24middle/CD44high/CD133middle/CXCR4low/ALDH1low primary patient epithelial tumor cells into specific high sphere-forming CD24low/CD44low/CD133high/CXCR4high/ALDH1high cancer stem-like cells (CSLCs) or tumor-initiating cells (TICs) with elevated tumor progression and metastasis capacity in vitro and in vivo. We demonstrate that conversion of CSLCs/TICs from epithelial tumor cells via +SS is dependent on reactive oxygen species (ROS)/nitric oxide (NO) generation, and suppression of extracellular signal-related kinase (ERK)/glycogen synthase kinase (GSK)3β, a mechanism similar to that operating in embryonic stem cells to prevent their differentiation while promoting self-renewal.

Conclusion: Fluid shear stress experienced during systemic circulation of human breast tumor cells can lead to specific acquisition of mesenchymal stem cell (MSC)-like potential that promotes EMT, mesenchymal-epithelial transition, and metastasis to distant organs. Our data revealed that biomechanical forces appeared to be important microenvironmental factors that not only drive hematopoietic development but also lead to acquisition of CSLCs/TIC potential in cancer metastasis. Our data highlight that +SS is a critical factor that promotes the conversion of CTCs into distinct TICs in blood circulation by endowing plasticity to these cells and by maintaining their self-renewal signaling pathways.

Keywords: EMT/MET; ERK-GSK3β; Hydrodynamic shear stress; ROS/NO; Tumor-initiating cells.


Conflict of interest statement

Ethics approval

All animal experiments were performed in accordance with protocols reviewed and approved by Institutional Animal Care and Use Committee (IACUC) of Konkuk University.

Consent for publication

Not applicable.

Competing interests

The authors declare that they have no competing interests.

Publisher’s Note

Springer Nature remains neutral with regard to jurisdictional claims in published maps and institutional affiliations.

Figures

Fig. 1
Fig. 1
Analysis of tumor formation, transcriptional changes, and sphere-forming ability of MDA-MB231 cells harvested from the blood after intra-cardiac injection or from mammary fat pads after orthotopic injection. a Green fluorescent protein (GFP)+ MDA-MB231 cells (density, 2 × 105 cells) were injected into the left ventricle of the heart or mammary fat pads of mice (n = 5). Right panel, the total bio-fluorescent GFP+ cells in the whole blood from the intra-cardiac (IC)-injected mice or PBS-injected control mice were isolated by fluorescence-activated cell sorting (FACS) and the number of GFP+ cells is presented. An average is shown as black circles; *p < 0.05. b Expression of stemness marker genes (Nanog, Sox2, Oct4B, and Oct4B1) was analyzed by quantitative real-time RT-PCR at 2 or 28 days following IC or orthotopic (OT) administration of MDA-MB231 cells (n = 5). In mice where MDA-MB231 cells were injected systemically (IC), secondary tumors formed in the tibia and mammary fat pads, and their expression of stemness marker genes was significantly increased (Tibia, Mammary fat pads). c Sphere-forming capacity of GFP+ MDA-MB231 cells harvested at 2 or 28 days from mice directly injected into left ventricle of the heart or orthotopically implanted into mammary fat pads (n = 5). d Expression of the epithelial-mesenchymal transition (EMT) marker (N-Cadherin, Twist, Snail1, and Vimentin; left panel) and epithelial marker (E-Cadherin, Claudin-7, and Cytokeratin-8) genes on GFP+ MDA-MB231 cells harvested at 28 days from blood, tibia, and mammary fat pads analyzed by quantitative real-time RT-PCR (n = 5). Expression of the shear stress (SS)-induced genes (Egr1, Ap1, Epcam, Klf8, and Klf2) on GFP+ MDA-MB231 cells harvested at 2 days (e) and 28 days (f) from blood, tibia, and mammary fat pads analyzed by quantitative real-time RT-PCR analysis (n = 5). Expression of each gene in quantitative real-time RT-PCR analysis was normalized to Gapdh. The data presented here are presented as mean ± SEM and are representative of three independent experiments. Statistically significant differences are tested at p < 0.05 significance
Fig. 2
Fig. 2
Hydrodynamic shear stress (SS) given as oscillatory shear stress (OSS) led to the acquirement of epithelial-mesenchymal transition (EMT) and stemness marker genes in MDA-MB231 cells. a Schematic illustration of in vitro fluid SS, including cone-and-plate viscometer-based laminar shear stress (LSS) or OSS and orbital shaker-based hydrodynamic SS. b (i) Number of suspension cells during LSS (270 rpm corresponds to 20 dyne/cm2) conditions of MDA-MB231 cells in non-coated Petri dishes after 24 h of culture. Cell viability was measured by trypan blue exclusion assay and error bars represent ± SD calculated from at least three independent experiments. Expression level of SS-induced (Egr1, Ap1 and Epcam (ii)), stemness marker (Nanog. Oct4B and Sox2; (iii)), EMT marker (N-Cadherin, Twist and Snail1; (iv)), and epithelial marker (E-Cadherin, Claudin-7, and Cytokeratin-8; (v)) genes in cells in suspension during LSS conditions of MDA-MB231 cells in non-coated Petri dishes, analyzed by quantitative real-time RT-PCR. c (i) Number of suspension cells during OSS (67 rpm corresponds to 5 dyne/cm2) conditions in MDA-MB231 cells in non-coated Petri dishes after 24 h of culture. Expression level of SS-induced (Egr1, Ap1 and Epcam; (ii)), stemness marker (Nanog. Oct4B and Sox2; (iii)), EMT marker (N-Cadherin, Twist and Snail1; (iv)), and epithelial marker (E-Cadherin, Claudin-7, and Cytokeratin-8; v) genes in suspension cells during OSS conditions of MDA-MB231 cells in non-coated Petri dishes, analyzed by quantitative real-time RT-PCR analysis. d Number of suspension cells during +SS (30–240 rpm corresponds to 2.25–18 dyne/cm2) conditions of breast cancer (MDA-MB231, MCF7) cells in non-coated Petri dishes after 24 h of culture. e Ratio of suspension cells in hydrodynamic SS (+SS) conditions (60 rpm corresponds to 4.5 dyne/cm2) of the indicated cells in non-coated Petri dishes were assessed on day 3, 5, 7, and 10. Cell viability was measured by trypan blue exclusion assay and error bars represent ± SD calculated from at least three independent experiments. f Expression of SS-induced (Egr1 and Epcam), stemness marker (Nanog and Oct4B), EMT marker (N-Cadherin and Twist), and epithelial marker (E-Cadherin, Claudin-7, and Cytokeratin-8) genes expressed in the indicated cells over time on the indicated days, analyzed by quantitative real-time RT-PCR; #p < 0.05, *p < 0.01. Each gene expression in quantitative real-time RT-PCR analysis was normalized to Gapdh. The data presented here are presented as mean ± SEM and are representative of three independent experiments. Statistically significant differences were tested at p < 0.05 significance
Fig. 3
Fig. 3
Hydrodynamic shear stress (+SS) given as orbital shaking led to the acquisition of epithelial to mesenchymal transition (EMT) and stemness-associated genes in primary epithelial tumor cells isolated from patients with breast cancer. a Schematic illustration of the in vitro fluid SS (laminar SS (LSS), oscillatory SS (OSS), or SS) that was exposed to breast cancer cells derived from chemotherapy-treated patients (CT-PCs). CT-PCs (density, 2 × 105 cells) were isolated as described in “Methods” and subjected to cone-and-plate viscometer-based LSS or OSS and orbital shaker-based +SS in non-coated Petri dishes. b (i) Number of suspension cells during LSS (270 rpm corresponds to 20 dyne/cm2) conditions of CT-PCs at 24 h was measured by trypan blue exclusion assay and error bars represent ± SD calculated from at least three independent experiments. Expression level of SS-induced (Egr1, Ap1 and Epcam; (ii)), stemness marker (Nanog. Oct4B and Sox2; (iii)), and EMT marker (N-Cadherin, Twist and Snail1; (iv)), and epithelial marker (E-Cadherin, Claudin-7, and Cytokeratin-8; v) genes in suspension cells during LSS conditions of CT-PCs in non-coated Petri dishes, analyzed by quantitative real-time RT-PCR. c (i) Number of suspension cells during OSS (67 rpm corresponds to 5 dyne/cm2) conditions of CT-PCs in non-coated Petri dishes after 24 h of culture. Expression level of SS-induced (Egr1, Ap1 and Epcam; (ii)), stemness marker (Nanog. Oct4B and Sox2; (iii)), and EMT marker (N-Cadherin, Twist and Snail1; (iv)), and epithelial marker (E-Cadherin, Claudin-7, and Cytokeratin-8; (v)) genes in suspension cells during OSS conditions of CT-PCs in non-coated Petri dishes, analyzed by quantitative real-time RT-PCR analysis. d Number of cells in suspension without SS culture (-SS) or following SS culture (+SS) counted at 3, 5, 7, and 10 days using trypan blue exclusion assay. e-h Quantitative real-time RT-PCR analysis was performed on CT-PCs harvested at 3, 5, 7, and 10 days after culture to measure the expression of SS-induced (Egr1, Epcam, Klf8 and Klf2) (e), stemness marker (Nanog, Sox2, and Oct4B) (f), EMT marker (N-Cadherin, Twist, Snail1, and Vimentin) (g) and epithelial marker (E-Cadherin, Claudin-7, and Cytokeratin-8 (h) genes. i Western blot analysis was performed on CT-PCs (−) and CT-PCs harvested on 10 days after SS culture (SS) to detect the expression of EMT marker (TWIST and N-CADHERIN) and epithelial marker (E-CADHERIN) proteins. j Surface marker expression of CD24, CD44, and CD133 were analyzed using flow cytometry and presented as percentage (fluorescent+ cells/all cells × 100%). Expression of each gene in quantitative real-time RT-PCR analysis was normalized to Gapdh. The data are presented as mean ± SEM and are representative of three independent experiments. Statistically significant differences were tested at p < 0.05
Fig. 4
Fig. 4
Patient-derived primary epithelial tumor cells cultured under hydrodynamic stress (SS) demonstrate significantly elevated in vivo tumorigenicity. a NOD/SCID mice were injected subcutaneously with increasing numbers of breast cancer cells derived from chemotherapy-treated patients CT-PCs or CT + SS, and tumor volumes (middle panel) and weights (right panel) were measured at 4 weeks after tumor cell inoculation. Representative images of tumors from the mice injected with the indicated number of cells (102–104 cells per site) are shown on the right (n = 3, *p < 0.05). Tumor tissues from the CT + SS-injected mice were analyzed by H&E staining or immunohistochemical analysis with the indicated antibody. Each indicated region (small squares) is magnified in the insets. b Tumor volumes and weights of successive passages of xenografts harboring CT + SS. The secondary xenograft was generated from injection of 50 cells isolated from the tumors formed from the preceding passage. Representative images of tumors harvested from mice are shown on the right (n = 4, *p < 0.05). c Protein expression of E-CADHERIN, N-CADHERIN, and TWIST was analyzed by western blot using the tumor tissues harvested from the 1st and 3rd passaged mice. Numbers refer to the densitometry analysis of each signal normalized against the corresponding anti-ACTIN values. d In vivo tumorigenicity of NOD/SCID mice injected orthotopically into the mammary fat pads with CT-PCs or CT + SS. Left panel, representative BFI images of mice at 4 and 8 weeks post-injection of the indicated cells (n = 3). Right panel, the percentage of green fluorescent protein (GFP)+ cells in the blood at 4 and 8 weeks post-injection was analyzed by flow cytometry. e The ratio of ionized calcium levels in whole blood from the CT-PCs- or CT + SS-injected mice were measured by the ABL800 analyzer. Error bars correspond to mean ± SD. Statistically significant differences were tested at p < 0.05
Fig. 5
Fig. 5
Patient-derived primary epithelial tumor cells acquire chemo-resistance with elevated migration and invasive potentials upon repeated orbital shaking. a Heatmap represents relative expression levels of genes showing least twofold difference between breast cancer cells derived from chemotherapy-treated patients (CT-PC) and CT + sheer stress (SS) with a p value < 0.05 is shown. Red and green represent the highest and lowest value of each gene analyzed, respectively. Gene Ontology (GO) analysis of RNA sequencing data revealed differential molecular function and biological processes on CT + SS compared with CT-PCs. GO categories for genes using the Network Ontology Analysis program (http://www.pantherdb.org/). RNA seq analysis of CT-PCs and CT-PCs under orbital shaking (CT + SS) for 10 days revealed upregulation of multiple SS-induced genes; Epcam, Arg2, Cldn4, S100a14, Klf8, and Krt18 (b) and multi-drug resistance genes; Cxcr4, Aldh1, Abcg2, and Abcb5 (c) upon +SS (p value compared with the non-shaking control group). d Cell viability of CT-PCs and CT + SS following treatment with doxorubicin or paclitaxel for 24 h (p value compared with dimethyl sulfoxide (DMSO)-treated cells). e Migration analysis was performed on CT-PCs and CT + SS by measuring the number of migrating cells per field of the wound made in the monolayer of cells. The migrating or invasive cells were measured in triplicate. Statistically significant differences were tested at p < 0.05
Fig. 6
Fig. 6
CT + shear stress (SS) demonstrate upregulation of reactive oxygen species (ROS)-responsive and nitric oxide (NO)-responsive genes. a Transcriptional profile of the selected ROS-responsive genes (Sod1, Cat, Nox1, Nox4, and Gpx1; i). (ii) Flow cytometry analysis of ROS generation of breast cancer cells derived from chemotherapy-treated patients (CT-PCs) treated with N-acetylcysteine (NAC) on day 3, 5, 7, and 10 during +SS (p value compared with adherent cells). iii, The number of suspended cells was counted on day 3, 5, 7, and 10 in the presence or absence of NAC treatment. b Transcriptional profile of the selected NO-responsive genes (Nos1, Nos2, and Noxtrin; (i)). Intracellular NO analysis was performed on CT-PC and CT + SS with 1 mM N(G)-nitro-l-arginine-methyl ester (L-NAME) by measuring the fluorescence NO probe (ii). The number of suspended cells was counted on day 3, 5, 7, and 10 in the presence or absence of L-NAME (iii). The data presented here are presented as mean ± SEM and are representative of three independent experiments. Statistically significant differences were tested at p < 0.05
Fig. 7
Fig. 7
Downregulation of the extracellular signal-related protein kinase (ERK) pathway is critical for the conversion of breast cancer cells derived from chemotherapy-treated patients (CT-PCs) into CT + shear stress (SS) displaying cancer stem-like cell (CSLC)/tumor-initiating cell (TIC) properties. a Transcriptional profile of the selected ERK-related genes (Elk1, Ets1, Mcl1, Tp53, and Stat3). b Western blot analysis of p-ERK, ERK, p-p38, p38, p-JNK, JNK, and p53 from CT-PCs or CT + SS (10 days) n. c CT-PCs under +SS for 3 days were treated with PD98059 (mitogen-activated protein kinase (MEK) inhibitor), SB203580 (p38 MAPK inhibitor), and SP600125 (JNK inhibitor) for 24 h and subjected to sphere-formation assay (*p < 0.01 compared with dimethyl sulfoxide (DMSO)-treated cells). Error bars represent ± SD from the three independent experiments. d CT + SS obtained from 3-day culture under +SS were transfected with Flag-tagged wild-type MEK (WT-MEK) or active MEK (active-MEK), and the level of Flag, p-MEK, MEK, p-ERK, ERK, p53, and p21 were assessed by western blot. e Changes in the number of sphere-forming cells in WT-MEK or active-MEK-expressing CT-PCs are shown as percent changes (%) (*p < 0.01, compared to mock transfection). f Relative changes in the expression of self-renewal marker (Nanog, Oct4B, and Sox2) and multi-drug resistance (Aldh1, Abcg2, and Abcb5) genes are normalized to Gapdh. Data represent mean ± SD from three independent experiments (*p < 0.01). g In vivo tumorigenicity of mock, WT-MEK, and active-MEK carrying CT + SS implanted subcutaneously on NOD/SCID mice. Tumor volumes and weights were measured in NOD/SCID mice after inoculation with 2 × 105 cells for 4 weeks. h Western blot analysis of p-GSK3β and GSK3β from CT-PCs or suspension CT + SS are shown. CT-PCs under +SS for 3 days were treated with PD98059 (MEK inhibitor) or/and BIO (GSK3β inhibitor) for 24 h and subjected to sphere-formation assay (i), quantitative real-time RT-PCR (j and upper panels of k and l), or western blot (lower panels of k and l) analyses of stemness (Nanog, Oct4B, and Sox2; j, EMT (Snail, Twist, and N-Cadherin (k)), and epithelial (E-Cadherin, Claudin-7, and Cytokeratin-8; l) marker genes. Relative changes in the expression of stemness and EMT marker genes are normalized to Gapdh; *p < 0.01, Error bars correspond to mean ± SD
Fig. 8
Fig. 8
Role of the hydrodynamic shear stress (+SS) in the conversion of epithelial tumor cells into cancer stem-like cells (CSLCs)/tumor-initiating cells (TICs). Proliferating tumor cells near the periphery of solid tumor mass are translocated into nearby blood vessels due to the nature of loose mosaic vessels. Once translocated into blood vessels, epithelial tumor cells are constantly exposed to severe SS in the systemic circulation and prone to dying in the absence of a strong survival signal. +SS given to tumor cells generate reactive free radial species, reactive oxygen species (ROS) and nitric oxide (NO), and cause transcriptional changes in ROS-dependent and NO-dependent pathways along with multiple SS-associated gene pathways. These early signaling events lead to active suppression of extracellular signal-related protein kinase (ERK) and glycogen synthase kinase (GSK)3β pathways to confer plasticity on the epithelial tumor cells, and maintain undifferentiated mesenchymal stem cell properties. As a result, tumor cells acquire survival benefit within the blood circulation with elevated stemness, Epithelial to mesenchymal transition (EMT)/mesenchymal to epithelial transition (MET) properties, invasive properties, and multi-drug resistance phenotype. CT-PCs, breast cancer cells derived from chemotherapy-treated patients

Similar articles

Cited by

References

    1. Kreso A, Dick JE. Evolution of the cancer stem cell model. Cell Stem Cell. 2014;14(3):275–291. doi: 10.1016/j.stem.2014.02.006. - DOI - PubMed
    1. Alix-Panabieres C, Pantel K. Challenges in circulating tumour cell research. Nat Rev Cancer. 2014;14(9):623–631. doi: 10.1038/nrc3820. - DOI - PubMed
    1. Aceto N, Bardia A, Miyamoto DT, Donaldson MC, Wittner BS, Spencer JA, Yu M, Pely A, Engstrom A, Zhu H, et al. Circulating tumor cell clusters are oligoclonal precursors of breast cancer metastasis. Cell. 2014;158(5):1110–1122. doi: 10.1016/j.cell.2014.07.013. - DOI - PMC - PubMed
    1. Yu M, Bardia A, Wittner BS, Stott SL, Smas ME, Ting DT, Isakoff SJ, Ciciliano JC, Wells MN, Shah AM, et al. Circulating breast tumor cells exhibit dynamic changes in epithelial and mesenchymal composition. Science. 2013;339(6119):580–584. doi: 10.1126/science.1228522. - DOI - PMC - PubMed
    1. Fidler IJ. The pathogenesis of cancer metastasis: the ‘seed and soil’ hypothesis revisited. Nat Rev Cancer. 2003;3(6):453–458. doi: 10.1038/nrc1098. - DOI - PubMed

Publication types

MeSH terms

Substances