. 2019 Feb;29(2):261-269.
doi: 10.1101/gr.237511.118. Epub 2019 Jan 16.

Gene duplication and genetic innovation in cereal genomes

Affiliations

Gene duplication and genetic innovation in cereal genomes

Hui Guo et al. Genome Res. 2019 Feb.

Abstract

Organisms continuously require genetic variation to adapt to fluctuating environments, yet major evolutionary events are episodic, making the relationship between genome evolution and organismal adaptation of considerable interest. Here, by genome-wide comparison of sorghum, maize, and rice SNPs, we investigated reservoirs of genetic variations with high precision. For sorghum and rice, which have not experienced whole-genome duplication in 96 million years or more, tandem duplicates accumulate relatively more SNPs than paralogous genes retained from genome duplication. However, maize, which experienced lineage-specific genome duplication and has a relatively larger supply of paralogous duplicates, shows SNP enrichment in paralogous genes. The proportion of genes showing signatures of recent positive selection is higher in small-scale (tandem and transposed) than genome-scale duplicates in sorghum, but the opposite is true in maize. A large proportion of recent duplications in rice are species-specific; however, most recent duplications in sorghum are derived from ancestral gene families. A new retrotransposon family was also a source of many recent sorghum duplications, illustrating a role in providing variation for genetic innovations. This study shows that diverse evolutionary mechanisms provide the raw genetic material for adaptation in taxa with divergent histories of genome evolution.


Figures

Figure 1.
Figure 1.
Number of duplicated gene types in different nsSNP density categories. All genes in (A) sorghum, (B) rice, and (C) maize are ordered by nsSNP density, ranked in 1000-gene intervals from low to high nsSNP density as shown in the x-axis.
Figure 2.
Figure 2.
Genes containing large impact SNPs. Distribution of five large impact SNP categories in sorghum, maize, and rice. (***) P < 0.01 for enrichment relative to the other two species.
Figure 3.
Figure 3.
Genetic diversity of syntenic gene pairs. Syntenic genes pairs that show different genetic diversity (difference of Tajima's D > 3) are connected by red lines. Blue lines show genomic distribution of Tajima's D across each chromosome. A sliding window method is used with window size of 1 Mb and step size of 100 kb. The short lines outside each circle mark the genomic position of the following types of genes (from inside to outside): tandemly duplicated (cyan); transposed duplications (orange); species-specific duplications (magenta); and singleton (green). (A) Sorghum; (B) maize; (C) rice. (D) Number of syntenic gene pairs with different selection patterns. “Positive”: both syntenic genes showing recent positive selection indicated by significant negative Tajima's D. “Balancing”: both syntenic genes showing balancing selection indicated by significant positive Tajima's D. “Divergence”: syntenic gene pairs showing different selection patterns as indicated by the red lines in the circle plot.
Figure 4.
Figure 4.
Evolution of plant gene family size. (A) Histogram of Ks values of all paralogous gene pairs identified by BLASTP with P-value < 1 × 10⁻¹⁰ and alignment accounting for >80% of gene length (removing partially aligned pairs). (B) Expansion and contraction of gene families in major flowering plant lineages using the CAFE algorithm (De Bie et al. 2006). The number of expansions is marked as red and contractions as blue.
Figure 5.
Figure 5.
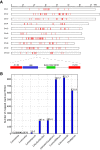
A recently amplified sorghum retrotransposon. (A) Genomic distribution and structure. (B) Copy number variation in sorghum and outgroup species, estimated by the number of mapped reads normalized to the total number of reads for each genome (per million reads).
Figure 6.
Figure 6.
Expression of a gene (Sb010G13800) located in the retrotransposon from seven sorghum accessions. (A) Semiquantitative RT-PCR. (B) Quantitative real-time PCR (qRT-PCR).

Similar articles

Cited by

References

    1. Baxter L, Tripathy S, Ishaque N, Boot N, Cabral A, Kemen E, Thines M, Ah-Fong A, Anderson R, Badejoko W, et al. 2010. Signatures of adaptation to obligate biotrophy in the Hyaloperonospora arabidopsidis genome. Science 330: 1549–1551. 10.1126/science.1195203 - DOI - PMC - PubMed
    1. Blanc G, Wolfe KH. 2004. Functional divergence of duplicated genes formed by polyploidy during Arabidopsis evolution. Plant Cell 16: 1679–1691. 10.1105/tpc.021410 - DOI - PMC - PubMed
    1. Bost B, de Vienne D, Hospital F, Moreau L, Dillmann C. 2001. Genetic and nongenetic bases for the L-shaped distribution of quantitative trait loci effects. Genetics 157: 1773–1787. - PMC - PubMed
    1. Brar DS, Singh K. 2011. Oryza. In Wild crop relatives: genomic and breeding resources: cereals (ed. Kole C), pp. 321–367. Springer, Heidelberg, Germany.
    1. Chapman BA, Bowers JE, Feltus FA, Paterson AH. 2006. Buffering of crucial functions by paleologous duplicated genes may contribute cyclicality to angiosperm genome duplication. Proc Natl Acad Sci 103: 2730–2735. 10.1073/pnas.0507782103 - DOI - PMC - PubMed

Publication types

LinkOut - more resources