. 2019 Jan 22;3(2):136-147.
doi: 10.1182/bloodadvances.2018023184.

NCF1 (p47phox)-deficient chronic granulomatous disease: comprehensive genetic and flow cytometric analysis

Affiliations

NCF1 (p47phox)-deficient chronic granulomatous disease: comprehensive genetic and flow cytometric analysis

Douglas B Kuhns et al. Blood Adv. .

Abstract

Mutations in NCF1 (p47phox) cause autosomal recessive chronic granulomatous disease (CGD) with abnormal dihydrorhodamine (DHR) assay and absent p47phox protein. Genetic identification of NCF1 mutations is complicated by adjacent highly conserved (>98%) pseudogenes (NCF1B and NCF1C). NCF1 has GTGT at the start of exon 2, whereas the pseudogenes each delete 1 GT (ΔGT). In p47phox CGD, the most common mutation is ΔGT in NCF1 (c.75_76delGT; p.Tyr26fsX26). Sequence homology between NCF1 and its pseudogenes precludes reliable use of standard Sanger sequencing for NCF1 mutations and for confirming carrier status. We first established by flow cytometry that neutrophils from p47phox CGD patients had negligible p47phox expression, whereas those from p47phox CGD carriers had ∼60% of normal p47phox expression, independent of the specific mutation in NCF1 We developed a droplet digital polymerase chain reaction (ddPCR) with 2 distinct probes, recognizing either the wild-type GTGT sequence or the ΔGT sequence. A second ddPCR established copy number by comparison with the single-copy telomerase reverse transcriptase gene, TERT We showed that 84% of p47phox CGD patients were homozygous for ΔGT NCF1 The ddPCR assay also enabled determination of carrier status of relatives. Furthermore, only 79.2% of normal volunteers had 2 copies of GTGT per 6 total (NCF1/NCF1B/NCF1C) copies, designated 2/6; 14.7% had 3/6, and 1.6% had 4/6 GTGT copies. In summary, flow cytometry for p47phox expression quickly identifies patients and carriers of p47phox CGD, and genomic ddPCR identifies patients and carriers of ΔGT NCF1, the most common mutation in p47phox CGD.


Conflict of interest statement

Conflict-of-interest disclosure: The authors declare no competing financial interests.

Figures

None
Graphical abstract
Figure 1.
Figure 1.
Analysis of NCF1 by ddPCR. Two distinct probes (one that recognizes the GTGT [blue] found in NCF1 and a second that recognizes the ΔGT [green] found in NCF1B and NCF1C) were added to diluted genomic DNA. A 20-µL PCR mixture was dispersed into 20 000 oil-coated nanodrops, and PCR was performed. The droplets were analyzed to determine the number of “Blue” and “Green” nanodrops. The image at the bottom left depicts the bead distribution of the ddPCR reaction. The clear beads represent beads without GTGT or ΔGT sequences, and therefore have no amplified probe or color. The blue beads represent beads containing a GTGT sequence and PCR amplification of the GTGT-specific probe. The green beads represent beads containing a ΔGT sequence and PCR amplification of the ΔGT-specific probe. Although the DNA has been diluted to minimize the number of double-colored droplets, they do occur and are included in the analysis. However, they are detected in independent channels and, therefore, do not affect the results. The text at the bottom right depicts the possible sequences in the example in the top of the panel. Because a total of 6 alleles were expected, normal subjects were predicted to yield 2 GTGT/4 ΔGT, p47phox carriers were predicted to yield 1 GTGT/5 ΔGT, and patients with p47phox CGD were predicted to yield 0 GTGT/6 ΔGT.
Figure 2.
Figure 2.
ROS production in patients and carriers of gp91phoxand p47phoxCGD. (A) Scatter plots represent the residual oxidase activity of phorbol 12-myristate 13-acetate (PMA)–stimulated (100 ng/mL) neutrophils isolated from individual patients and carriers of gp91phox and p47phox CGD determined using ferricytochrome c reduction. The region in gray is the normal range (129.9-346.3 nmoles/106 cell/60 minutes) based on data from neutrophils isolated from 922 healthy volunteers (mean ± 2 standard deviation [SD]). As previously reported, neutrophils from p47phox CGD patients have increased ROS production compared with most gp91phox CGD patients. Neutrophils from all carriers of p47phox CGD exhibit ROS production that falls within the normal range. (B) Histograms represent the residual oxidase activity of neutrophils from patients and carriers of gp91phox and p47phox CGD, determined using dihydrorhodamine oxidation by flow cytometry. Neutrophil populations were gated using forward and right-angle light scattering. Open histograms represent ROS production of neutrophils treated with buffer under basal conditions; the solid gray histograms represent ROS production of neutrophils in response to PMA (400 ng/mL). The vertical dotted line represents the peak of buffer-treated neutrophils, and the vertical dashed line represents the peak of PMA-treated neutrophils.
Figure 3.
Figure 3.
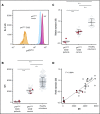
Quantitative analysis of p47phoxexpression by FACS analysis and immunoblotting. To determine p47phox expression, whole blood was permeabilized/fixed and then stained with anti-p47phox antibody. Neutrophils were gated using forward and right-angle light scatter. The level of p47phox expression on neutrophils is presented as the mean fluorescence intensity (MFI). (A) Relative histograms of a p47phox CGD patient, a p47phox CGD carrier, and a healthy volunteer. Summary data of the different populations are presented as scatter plots (B). Solid red circles in panels B, C, and D represent p47phox patients and carriers with non-ΔGT mutations in NCF1. (C) A subset of patients and carriers of p47phox CGD and healthy volunteers were analyzed for p47phox expression by immunoblotting. The data for of p47phox expression are presented as arbitrary units relative to the expression of β-actin. Neutrophil lysates from at least 2 healthy normal volunteers were analyzed on each gel, and the mean ratio of p47phox:β-actin for the normal samples was set to a value of 1.0. (D) The correlation obtained from parallel studies analyzing the expression of p47phox by both flow cytometry and immunoblotting. ****P < .0001 (1-way analysis of variance using Tukey’s multiple comparison).
Figure 4.
Figure 4.
ROS production and p47phoxexpression in normal subjects with Increased GTGT copy number. (A) Neutrophils from healthy volunteers with increased GTGT copy number (9 with 3/6 and 1 with 4/6) exhibit normal, PMA-stimulated, neutrophil formula image production (shaded area, 238.1 ± 108.2 [mean ± 2 SD], n = 922), detected using ferricytochrome c reduction. (B-C) Neutrophils from healthy volunteers were analyzed for p47phox expression. (B) Scatter plots represent neutrophil p47phox expression normalized to cellular actin of 2 healthy volunteers with increased copy number of GTGT (3/6, outlined in red in panel C) comparable to that observed in neutrophils from healthy volunteers with 2/6 GTGT (outlined in green).
Figure 5.
Figure 5.
Ethnic differences in CNV in GTGT/ΔGT distribution among healthy volunteers.
Figure 6.
Figure 6.
GTGT copies and ΔGT copies in normal subjects, p47phoxCGD patients, carriers, and kindred; gp91phoxCGD patients, carriers, and kindred; and other patients with CGD. Data from all individuals tested by ddPCR and analyzed as described in Table 2 are presented as scatter plots based on the diagnosis. (A) Number of GTGT copies. (B) Number of ΔGT copies.
Figure 7.
Figure 7.
GTGT/ΔGT CNV in families of patients with p47phoxCGD. In the pedigrees presented, the GTGT/ΔGT genotype is above the individual tested. Symbols in black represent patients and carriers with the ΔGT mutation; symbols in red represent patients and carriers with non-ΔGT mutations; symbols in black and red represent compound heterozygotes with a ΔGT mutation and a non-ΔGT mutation; open symbols represent individuals tested that have a normal phenotype and genotype; faded symbols represent individuals that have not been tested but their phenotype is presumed. Consanguineous marriages are indicated by double lines between pedigree symbols.

Similar articles

Cited by

References

    1. Berendes H, Bridges RA, Good RA. A fatal granulomatosus of childhood: the clinical study of a new syndrome. Minn Med. 1957;40(5):309-312. - PubMed
    1. Kuhns DB, Alvord WG, Heller T, et al. . Residual NADPH oxidase and survival in chronic granulomatous disease. N Engl J Med. 2010;363(27):2600-2610. - PMC - PubMed
    1. Bakri FG, Martel C, Khuri-Bulos N, et al. . First report of clinical, functional, and molecular investigation of chronic granulomatous disease in nine Jordanian families. J Clin Immunol. 2009;29(2):215-230. - PubMed
    1. Fattahi F, Badalzadeh M, Sedighipour L, et al. . Inheritance pattern and clinical aspects of 93 Iranian patients with chronic granulomatous disease. J Clin Immunol. 2011;31(5):792-801. - PubMed
    1. Rawat A, Singh S, Suri D, et al. . Chronic granulomatous disease: two decades of experience from a tertiary care centre in North West India. J Clin Immunol. 2014;34(1):58-67. - PubMed

Publication types

MeSH terms