Validation of the United Kingdom copy-number alteration classifier in 3239 children with B-cell precursor ALL
- PMID: 30651283
- PMCID: PMC6341196
- DOI: 10.1182/bloodadvances.2018025718
Validation of the United Kingdom copy-number alteration classifier in 3239 children with B-cell precursor ALL
Abstract
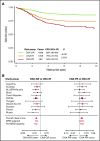
Genetic abnormalities provide vital diagnostic and prognostic information in pediatric acute lymphoblastic leukemia (ALL) and are increasingly used to assign patients to risk groups. We recently proposed a novel classifier based on the copy-number alteration (CNA) profile of the 8 most commonly deleted genes in B-cell precursor ALL. This classifier defined 3 CNA subgroups in consecutive UK trials and was able to discriminate patients with intermediate-risk cytogenetics. In this study, we sought to validate the United Kingdom ALL (UKALL)-CNA classifier and reevaluate the interaction with cytogenetic risk groups using individual patient data from 3239 cases collected from 12 groups within the International BFM Study Group. The classifier was validated and defined 3 risk groups with distinct event-free survival (EFS) rates: good (88%), intermediate (76%), and poor (68%) (P < .001). There was no evidence of heterogeneity, even within trials that used minimal residual disease to guide therapy. By integrating CNA and cytogenetic data, we replicated our original key observation that patients with intermediate-risk cytogenetics can be stratified into 2 prognostic subgroups. Group A had an EFS rate of 86% (similar to patients with good-risk cytogenetics), while group B patients had a significantly inferior rate (73%, P < .001). Finally, we revised the overall genetic classification by defining 4 risk groups with distinct EFS rates: very good (91%), good (81%), intermediate (73%), and poor (54%), P < .001. In conclusion, the UKALL-CNA classifier is a robust prognostic tool that can be deployed in different trial settings and used to refine established cytogenetic risk groups.
© 2019 by The American Society of Hematology.
Conflict of interest statement
Conflict-of-interest disclosure: The authors declare no competing financial interests.
Figures


References
-
- Bonaventure A, Harewood R, Stiller CA, et al. ; CONCORD Working Group. Worldwide comparison of survival from childhood leukaemia for 1995-2009, by subtype, age, and sex (CONCORD-2): a population-based study of individual data for 89 828 children from 198 registries in 53 countries. Lancet Haematol. 2017;4(5):e202-e217. - PMC - PubMed
-
- Moorman AV, Ensor HM, Richards SM, et al. Prognostic effect of chromosomal abnormalities in childhood B-cell precursor acute lymphoblastic leukaemia: results from the UK Medical Research Council ALL97/99 randomised trial. Lancet Oncol. 2010;11(5):429-438. - PubMed
-
- Moorman AV. The clinical relevance of chromosomal and genomic abnormalities in B-cell precursor acute lymphoblastic leukaemia. Blood Rev. 2012;26(3):123-135. - PubMed
-
- Mullighan CG, Goorha S, Radtke I, et al. Genome-wide analysis of genetic alterations in acute lymphoblastic leukaemia. Nature. 2007;446(7137):758-764. - PubMed

