. 2019 Mar;179(3):1093-1110.
doi: 10.1104/pp.18.01252. Epub 2019 Jan 16.

The Role of Plastidic Trigger Factor Serving Protein Biogenesis in Green Algae and Land Plants

Affiliations

The Role of Plastidic Trigger Factor Serving Protein Biogenesis in Green Algae and Land Plants

Marina Rohr et al. Plant Physiol. 2019 Mar.

Abstract

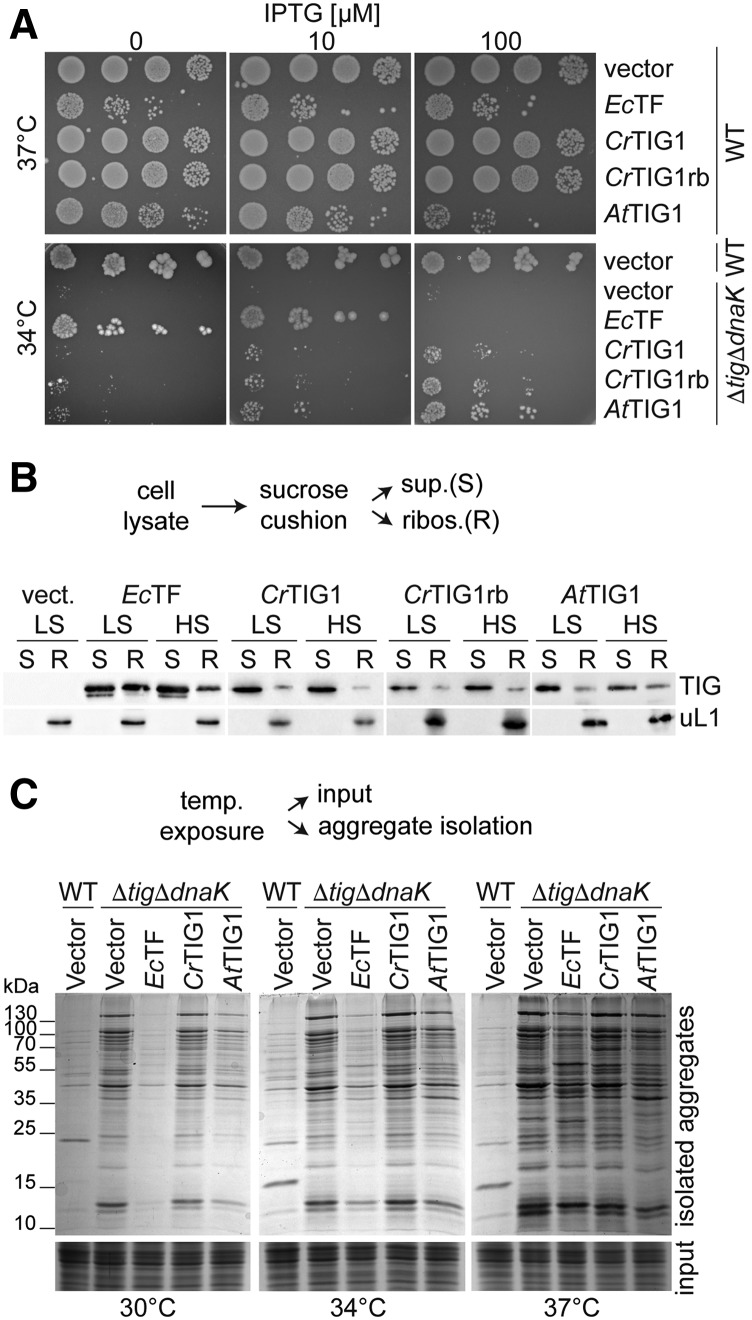
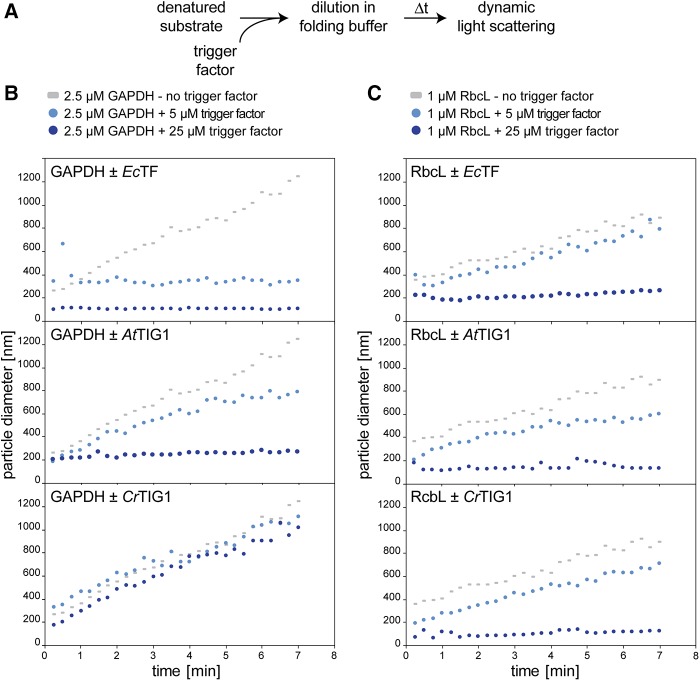
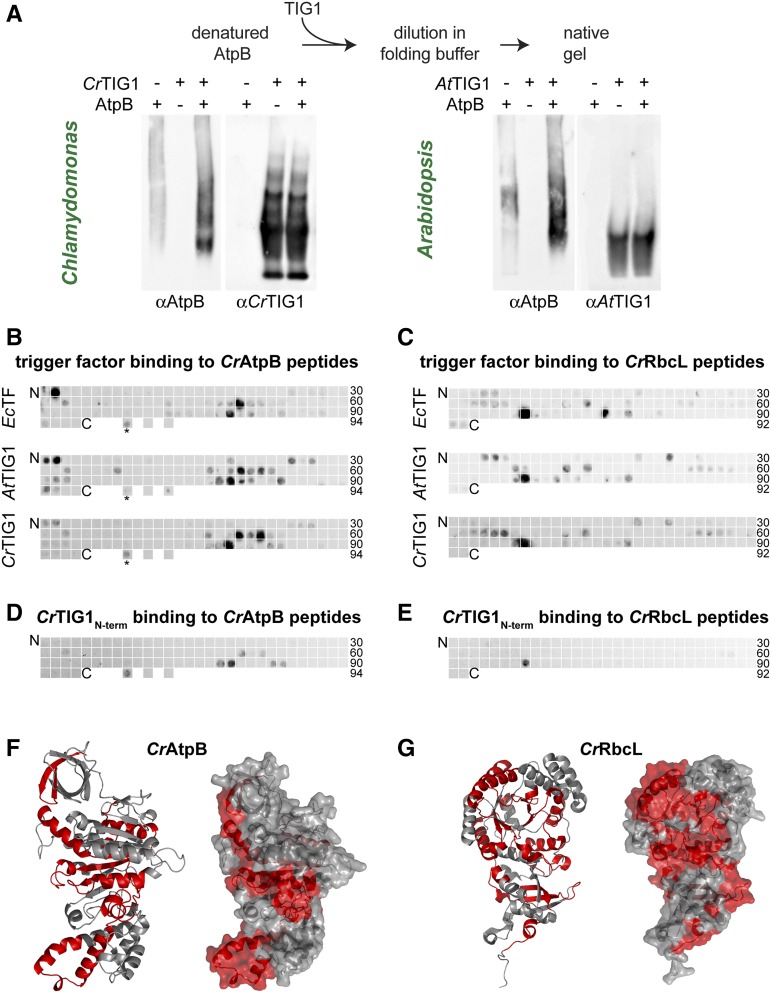
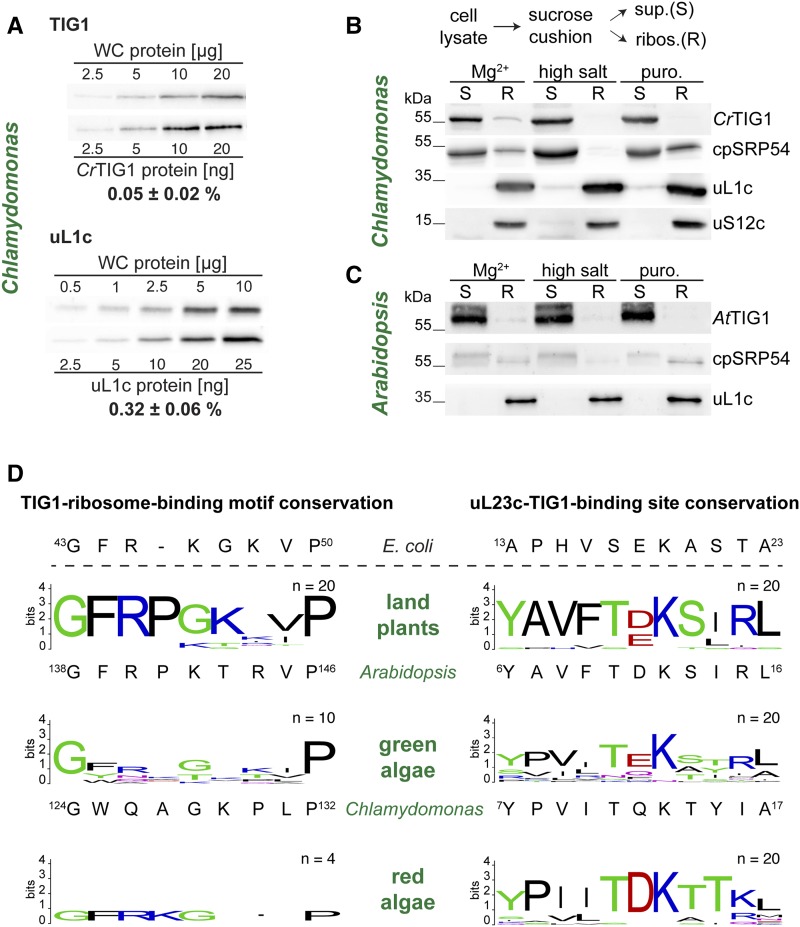
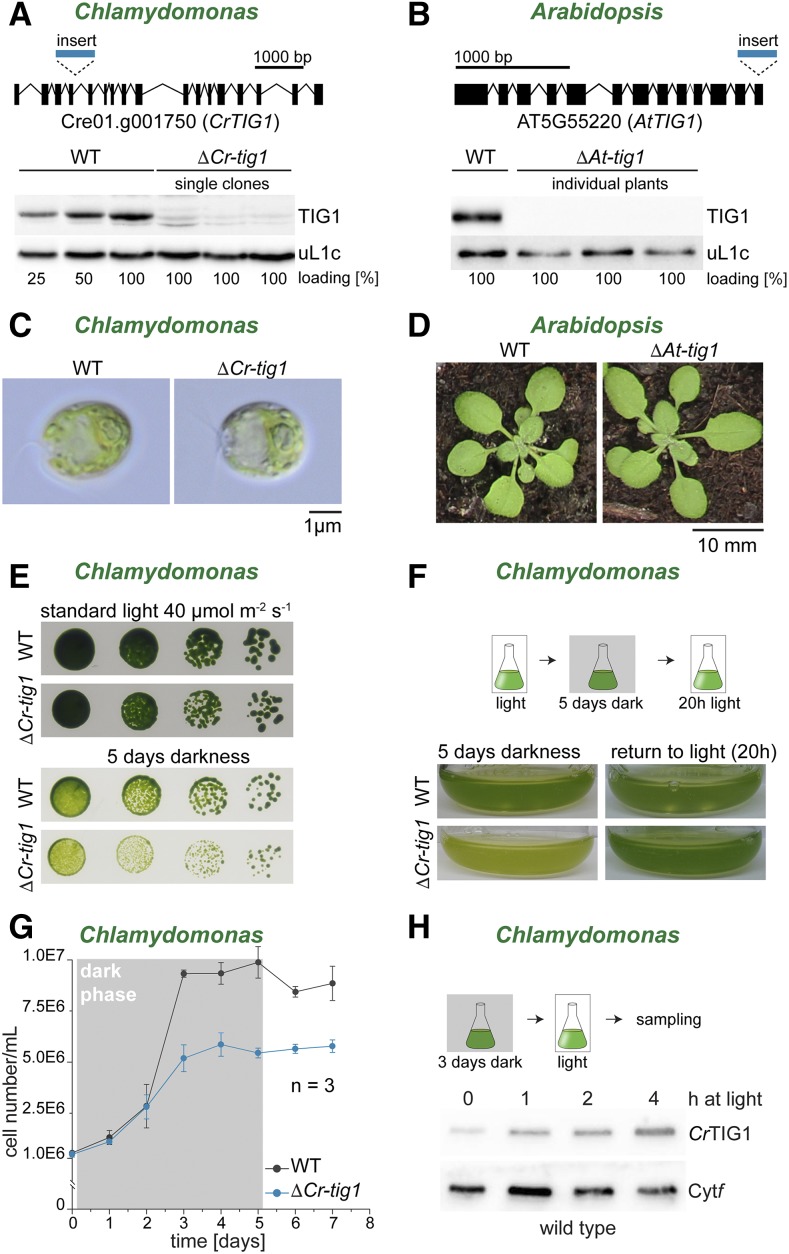
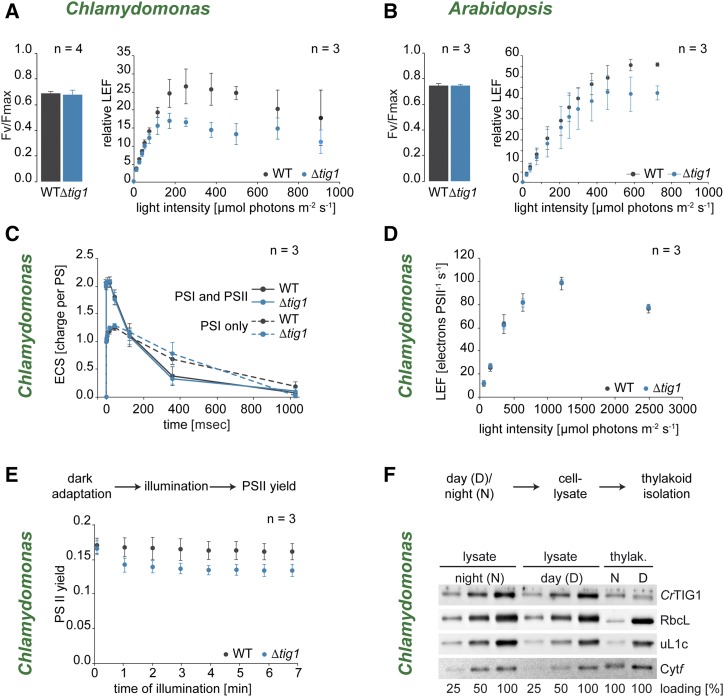
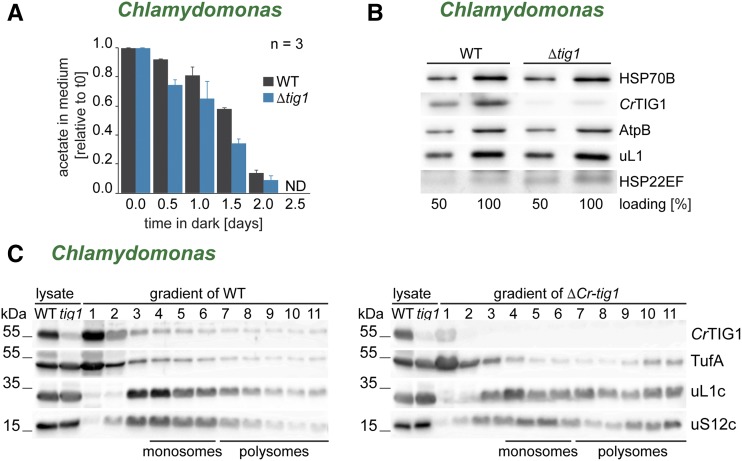
Biochemical processes in chloroplasts are important for virtually all life forms. Tight regulation of protein homeostasis and the coordinated assembly of protein complexes, composed of both imported and locally synthesized subunits, are vital to plastid functionality. Protein biogenesis requires the action of cotranslationally acting molecular chaperones. One such chaperone is trigger factor (TF), which is known to cotranslationally bind most newly synthesized proteins in bacteria, thereby assisting their correct folding and maturation. However, how these processes are regulated in chloroplasts remains poorly understood. We report here functional investigation of chloroplast-localized TF (TIG1) in the green alga (Chlamydomonas reinhardtii) and the vascular land plant Arabidopsis (Arabidopsis thaliana). We show that chloroplastic TIG1 evolved as a specialized chaperone. Unlike other plastidic chaperones that are functionally interchangeable with their prokaryotic counterpart, TIG1 was not able to complement the broadly acting ortholog in Escherichia coli. Whereas general chaperone properties such as the prevention of aggregates or substrate recognition seems to be conserved between bacterial and plastidic TFs, plant TIG1s differed by associating with only a relatively small population of translating ribosomes. Furthermore, a reduction of plastidic TIG1 levels leads to deregulated protein biogenesis at the expense of increased translation, thereby disrupting the chloroplast energy household. This suggests a central role of TIG1 in protein biogenesis in the chloroplast.


Figures

Figure 1.
Figure 1.
Chloroplast trigger factor function differs from that of its bacterial isoform. A, Complementation analysis of chloroplast trigger factor (TF) in E. coli. Wild-type (WT) MC4100 (top) and ΔtigΔdnaK cells (bottom) were transformed with the empty vector or constructs carrying EcTF, mature wild-type CrTIG1, CrTIG1 with the EcTF ribosome-binding signature motif (CrTIG1rb), and mature wild-type AtTIG1. Cells were spotted in serial dilutions onto Luria broth (LB) plates with different IPTG concentrations and grown overnight at 37°C and 34°C, respectively. Control plates containing Glc for full suppression of leaky expression are shown in Supplemental Figure S1A. B, E. coli ΔtigΔdnaK cells carrying the vectors described in A were grown to logarithmic phase, and TF production was induced by the addition of 20 µm IPTG for EcTF and 250 µm IPTG for the plastidic TIG1s. Cells were harvested in the presence of 100 µg/mL chloramphenicol and cleared of cell debris, and ribosome-nascent chains were isolated by centrifugation through a Suc cushion. Low-salt conditions (LS) contained 100 mm KCl and high-salt conditions (HS) 750 mm KCl. Supernatant fractions (S) and a 5× concentrate of the ribosomal pellet (R) were separated by SDS-PAGE and immunodetected with the indicated antibodies (uL1c, chloroplast ribosomal protein L1). C, E. coli transformed with the same constructs as in A, exclusive of CrTIG1rb, were grown for 4 h at the indicated temperatures, and expression was induced with IPTG as described for B. Insoluble protein aggregates were isolated from equal concentrations of cell lysates (input) and visualized by 10% SDS-PAGE and Coomassie staining. For expression control of the individual TF constructs, see Supplemental Figure S2. All immunoblots are representative of at least three biological replicates.
Figure 2.
Figure 2.
Trigger factor prevents protein aggregate formation. Prevention of GAPDH and RbcL aggregation by the addition of purified trigger factor (TF). A, Flow chart of experimental method. Chemically denatured, purified rabbit muscle GAPDH or Chlamydomonas RbcL were diluted to final concentrations of 2.5 µm and 1 µm, respectively, in folding buffer in the absence or presence of the indicated concentrations of EcTF, AtTIG1, or CrTIG1. B and C, Changes of hydrodynamic particle size (given as distribution widths of z-average diameters), as derived by DLS over a 7-min time course at 25°C. To aid comparison between plots, the same datasets for GAPDH and RbcL without TF are included in each plot. For control experiments with bovine serum albumin instead of TF, see Supplemental Figure S3. All graphs are representative of at least three biological replicates.
Figure 3.
Figure 3.
Bacterial and eukaryotic trigger factor bind peptides of similar properties. Bacterial and plastidic trigger factor (TF) binding to specific amino acid sequence stretches within putative TIG1 substrates. A, TF binds and processes unfolded AtpB in vitro. Purified AtpB protein was denatured and diluted to 0.4 µm in folding buffer in the presence and absence of 2 µm CrTIG1 or AtTIG1 (5-fold excess of the chaperone, as in Fig. 2C). Samples were separated by 4% native polyacrylamide gels and immunoblotted with the indicated antibodies. Immunoblot is representative of three biological replicates. B and C, Binding of EcTF, CrTIG1, and AtTIG1 to 20-meric peptide libraries of Chlamydomonas chloroplast-encoded AtpB (beta subunit of the plastidic ATP synthase; B) and RbcL (large subunit of Rubisco; C). Peptide frames are shifted by five amino acids; the numbers indicate the last peptide spot of a row. As a control, the TufA peptide bound by EcTF (Patzelt et al., 2001; indicated by an asterisk) and the adjacent downstream sequence (not binding EcTF) was spotted at three separated locations of the last row of the AtpB blot. D and E, Binding of the CrTIG1 protein N-terminal domain to the CrAtpB (D) and CrRbcL (E) peptide libraries described above. For specificity of the applied antibodies, see Supplemental Figure S5. Hybridization was done for each protein species in two independent replicates. F and G, Ribbon (left) and surface (right) presentation of AtpB (F) and RbcL (G). Peptides bound by all three TF species (B and C) are labeled in red. AtpB was modeled according to the spinach crystal structure (Groth, 2002). The RbcL structure was derived from Taylor et al. (2001).
Figure 4.
Figure 4.
Ribosome association of trigger factor in chloroplasts. A, Quantitative immunoblotting of CrTIG1 and chloroplast ribosomal protein uL1c. Recombinant Chlamydomonas TIG1 and uL1c were produced in E. coli, purified, and loaded in dilution series. Chlamydomonas whole-cell proteins were loaded at the indicated amounts. All samples were separated on 12% SDS-polyacrylamide gels and analyzed by immunoblotting. Relative protein abundances were determined from n = 3 independent biological replicates and given as means with standard deviations. B and C, Ribosome cosedimentation assays of Chlamydomonas (B) and Arabidopsis (C) lysates. Ribosomes were isolated under three different conditions: ribosome-stabilizing condition (“Mg2+” buffer, 50 mm HEPES, pH 8.0; 25 mm KCl; 10 mm MgCl2; 1 mm DTT; 0.25× Protease-Inhibitor) supplemented with 100 µg/mL CAP, 100 µg/mL cycloheximide, and 200 µg/mL Heparin; “high salt”-mediated release of ribosome-associated factors (high ionic strength buffer, 50 mm HEPES, pH 8.0; 800 mm KCl; 10 mm MgCl2; 1 mm DTT; 0.25× Protease-Inhibitor); “Puro.” release of nascent chains by addition of 1 mm Puromycin (buffer, 50 mm HEPES, pH 8.0; 25 mm KCl; 10 mm MgCl2; 1 mm DTT). Precleared cell lysates were separated into non-ribosome-containing supernatant (S) and ribosome pellet (R) by centrifugation through a 25% (w/v) Suc cushion, and fractions were separated on a 12% SDS-polyacrylamide gel. Note that R was concentrated 5× compared to S. Enrichment of trigger factor (TIG1) in the ribosomal fraction upon chemical cross linking is given in Supplemental Figure S6. Immunoblots are representative of at least three biological replicates. D, WebLogo representation of the TF “ribosome-binding signature motif” and the putative TF-binding site of the ribosomal protein uL23c. Comparison between land plants, green algae, and red algae. Sequence conservation is indicated by the height of stacks (bits); height of amino acid letters represents their relative frequency at the indicated position. Low letter height of red algal symbols is due to the low number of available sequences. All analyzed sequence identifiers are given in Supplemental Table S2. The respective amino acid sequence of E. coli, Chlamydomonas, and Arabidopsis is given below the diagrams. Note that for the plastidic TIG1 sequences, amino acids were counted from the translational start site of the chloroplast precursor sequence (including the transit peptide). For a phylogenetic comparison of uL23 between different species, see Supplemental Figure S7.
Figure 5.
Figure 5.
Chloroplast trigger factor mutants show reduced growth upon prolonged dark exposure. Characterization of Chlamydomonas and Arabidopsis TIG1 mutants. A, The Chlamydomonas tig1 mutant LMJ.RY0402.205185 (ΔCr-tig1) carries a paromomycin cassette insertion within the fourth intron of the trigger factor gene (top, lines indicate introns, black boxes mark exons, scale bar indicates distance of 1,000 bp), which results in a strong reduction of CrTig1 protein accumulation (bottom). B, In the Arabidopsis tig1 mutant SALK_037730 (ΔAt-tig1), the last three exons and two introns are replaced by the T-DNA insertion (top, lines indicate introns, black boxes mark exons, scale bar indicates distance of 1,000 bp), which abolishes AtTIG1 expression to protein levels below the detection limit by immunoblotting (bottom). C, Images of Chlamydomonas wild-type CC4533 (Li et al., 2016) and ΔCr-tig1 grown on a rotatory shaker at 25°C and 50 µmol of photons m−2 s−1. Scale bar indicates 1 µm. D, Photographs of 3-week-old Arabidopsis wild-type Col-0 and ΔAt-tig1 mutants grown in soil. E, Reduced growth of ΔCr-tig1 upon prolonged dark exposure. Twenty-microliter volumes of serial dilutions from 106 to 103 wild-type and mutant cells was spotted onto TAP agar plates and grown for 7 d, incubated under light or darkness. F, Mixotrophically grown cultures of wild type and ΔCr-tig1 were kept for 5 d in the dark and were subsequently exposed for 20 h under 30 µmol of photons m−2 s−1 light. G, Growth curve of Chlamydomonas wild type and ΔCr-tig1 during prolonged darkness. Cultures were diluted to equal cell numbers, adapted for 3 h under illumination, grown for 5 d during complete darkness, and transferred back to 30 µmol of photons m−2 s−1 light. Cell numbers are given in nEm nonsuperscript format for 10m. Data are means and standard deviations of n = 3 independent biological replicates. H, CrTIG1 protein accumulation after 3 d of complete darkness (time point 0) and at the indicated time points upon exposure to 80 µmol of photons m−2 s−1 light. WT, Wild type; Cytf, cytochrome f. All figures are representative of at least three biological replicates.
Figure 6.
Figure 6.
Photosynthetic electron flow is altered in chloroplast trigger factor mutants. Characterization of photosynthetic activity in Chlamydomonas and Arabidopsis TIG1 mutants. A, Left: photosynthetic activity of PSII determined by maximum quantum yield of fluorescence (Fv/Fmax). Right: photosynthetic linear electron flow (LEF) in relation to downstream metabolic processes. PSII fluorescence yield was measured after 2 min illumination at each light intensity in mixotrophically grown Chlamydomonas wild-type and ΔCr-tig1tig1) cells. B, Left: photosynthetic activity of PSII determined by maximum quantum yield (Fv/Fmax). Right: photosynthetic LEF in relation to downstream metabolic processes. PSII yield was measured after 2 min preillumination at each light intensity of Arabidopsis wild type and ΔAt-tig1tig1) mutants grown under long-day conditions (14-h light, 10-h dark). C, Electrochromic shift of carotenoids (ECS) was triggered by flash excitations of both PSII and PSI (solid lines) or PSI only (in the presence of PSII inhibitors, dashed lines), which generate a transmembrane electrochemical gradient. Data were normalized to one charge separation per photosystem. Electrochemical gradient is then dissipated through ATP synthase. Prior to the experiment, mixotrophically grown Chlamydomonas wild-type and ΔCr-tig1tig1) cells were dark-adapted for about 2 h. D, LEF in transitory regime independent of the carbon assimilation cycle. PSII yield was measured after 5 s illumination at each light intensity, interspaced with 30-s dark periods in mixotrophically grown Chlamydomonas wild-type and ΔCr-tig1tig1) cells. E, Time course of PSII yield during a 7-min illumination at 800 µmol of photons m−2 s−1, measured by chlorophyll fluorescence in mixotrophically grown Chlamydomonas wild-type and ΔCr-tig1tig1). F, Cells were grown photoautotrophically for 72 h in diurnal cycles of 12-h dark and 12-h light. Samples were collected 3 h after onset of night (N) or day (D), and thylakoids (Thylak.) were isolated. Thylakoid and lysate samples were adjusted to equal protein concentrations and visualized by separation on a 12% SDS-polyacrylamide gel and immunoblotted with the indicated antibodies. All values are given as mean values of the indicated independent biological replicates. Error bars denote standard deviations. Immunoblot in F is representative of two independent biological replicates.
Figure 7.
Figure 7.
Chlamydomonas trigger factor mutants suffer from a disturbed energy balance in the chloroplast. Cells lacking chloroplast trigger factor show a higher energy demand. A, Acetate consumption of wild-type and ΔCr-tig1tig1) strains during heterotrophic growth in darkness. Remaining acetate in medium was quantified by HPLC and plotted relative to that at time point 0, which indicates freshly diluted cells. ND, not detectable. Data are means and standard deviations of n = 3 independent biological replicates. B, Immunoblot comparison of chloroplast molecular chaperone expression between Chlamydomonas wild-type and ΔCr-tig1 cells (Δtig1). C, Polysome analysis of Chlamydomonas wild-type and ΔCr-tig1 cells (Δtig1). Immunoblot of ribosomes (uL1c and uS12c), distribution of CrTIG1, and the TufA in fractions. Expected positions of monosomes and polysomes in the gradient are marked below the blots. All immunoblots are representative of at least three biological replicates (one additional replicate is shown in Supplemental Fig. S18).

Similar articles

Cited by

References

    1. Agashe VR, Guha S, Chang H-C, Genevaux P, Hayer-Hartl M, Stemp M, Georgopoulos C, Hartl FU, Barral JM (2004) Function of trigger factor and DnaK in multidomain protein folding: increase in yield at the expense of folding speed. Cell 117: 199–209 - PubMed
    1. Allen JF, de Paula WB, Puthiyaveetil S, Nield J (2011) A structural phylogenetic map for chloroplast photosynthesis. Trends Plant Sci 16: 645–655 - PubMed
    1. Alonso JM, Stepanova AN, Leisse TJ, Kim CJ, Chen H, Shinn P, Stevenson DK, Zimmerman J, Barajas P, Cheuk R, et al. (2003) Genome-wide insertional mutagenesis of Arabidopsis thaliana. Science 301: 653–657 - PubMed
    1. Bai C, Guo P, Zhao Q, Lv Z, Zhang S, Gao F, Gao L, Wang Y, Tian Z, Wang J, et al. (2015) Protomer roles in chloroplast chaperonin assembly and function. Mol Plant 8: 1478–1492 - PubMed
    1. Bailleul B, Cardol P, Breyton C, Finazzi G (2010) Electrochromism: A useful probe to study algal photosynthesis. Photosynth Res 106: 179–189 - PubMed

Publication types

MeSH terms

LinkOut - more resources