. 2019 Jan 29;116(5):1714-1722.
doi: 10.1073/pnas.1814889116. Epub 2019 Jan 16.

In vivo measurement of trabecular meshwork stiffness in a corticosteroid-induced ocular hypertensive mouse model

Affiliations

In vivo measurement of trabecular meshwork stiffness in a corticosteroid-induced ocular hypertensive mouse model

Guorong Li et al. Proc Natl Acad Sci U S A. .

Abstract

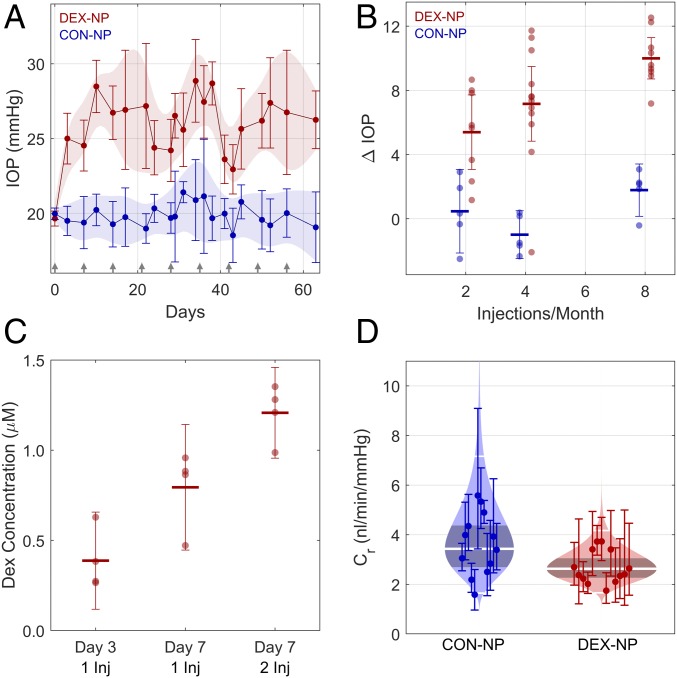
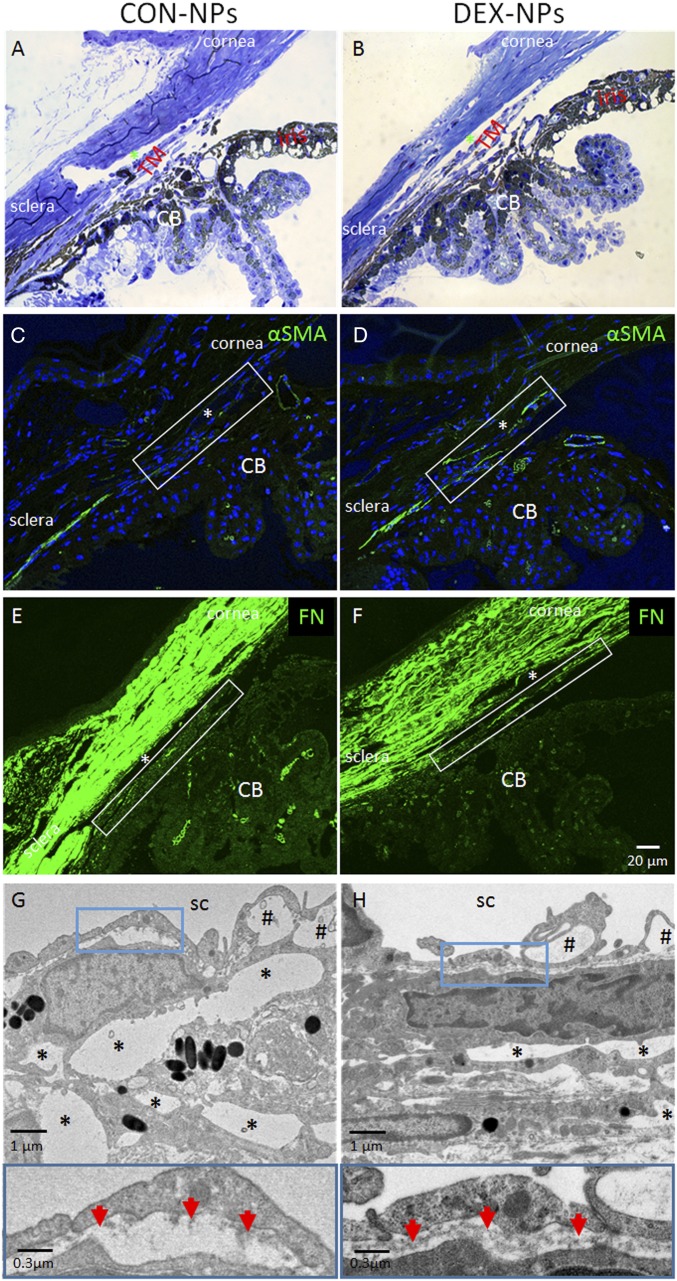
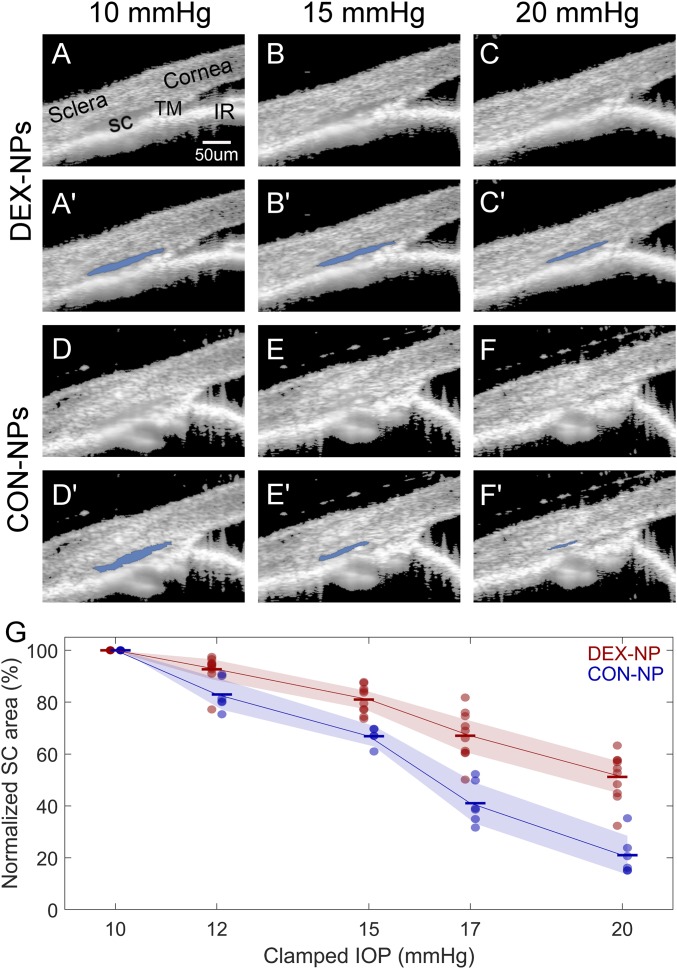
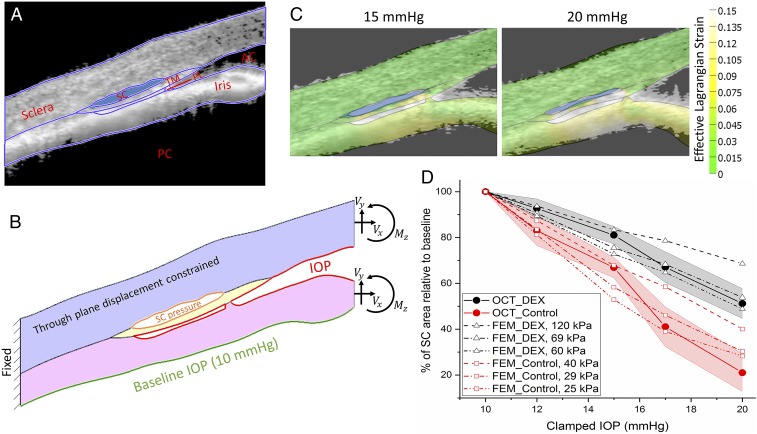
Ocular corticosteroids are commonly used clinically. Unfortunately, their administration frequently leads to ocular hypertension, i.e., elevated intraocular pressure (IOP), which, in turn, can progress to a form of glaucoma known as steroid-induced glaucoma. The pathophysiology of this condition is poorly understood yet shares similarities with the most common form of glaucoma. Using nanotechnology, we created a mouse model of corticosteroid-induced ocular hypertension. This model functionally and morphologically resembles human ocular hypertension, having titratable, robust, and sustained IOPs caused by increased resistance to aqueous humor outflow. Using this model, we then interrogated the biomechanical properties of the trabecular meshwork (TM), including the inner wall of Schlemm's canal (SC), tissues known to strongly influence IOP and to be altered in other forms of glaucoma. Specifically, using spectral domain optical coherence tomography, we observed that SC in corticosteroid-treated mice was more resistant to collapse at elevated IOPs, reflecting increased TM stiffness determined by inverse finite element modeling. Our noninvasive approach to monitoring TM stiffness in vivo is applicable to other forms of glaucoma and has significant potential to monitor TM function and thus positively affect the clinical care of glaucoma, the leading cause of irreversible blindness worldwide.

Keywords: Schlemm’s canal; finite element modeling; glaucoma; nanoparticle; optical coherence tomography.


Conflict of interest statement

The authors declare no conflict of interest.

Figures

Fig. 1.
Fig. 1.
Sustained delivery of DEX by custom NPs (DEX-NPs) induces ocular hypertension and decreased outflow facility in mice. (A) Sustained IOP elevation is observed in DEX-NP−treated eyes (N = 7 animals) versus CON-NP−treated eyes (n = 5 animals) from age- and gender-matched groups of mice injected subconjunctivally and/or periocularly with NPs once per week in both eyes (arrows indicate injection days for both groups). The data are shown as mean and 95% confidence interval over all animals. Shaded regions show 95% confidence bounds, smoothed with a cubic spline for visualization. (B) IOP elevation above baseline following different DEX-NP injection strategies at 3-wk time point. IOP elevation relative to baseline (ΔIOP) increased with increasing injection frequency (P = 0.0005). CON-NP injections had no detectible effect on IOP, irrespective of frequency. IOP elevations were 5.4 [95% confidence interval 3.1, 7.7], 7.2 [4.8, 9.5] and 10.0 [8.7, 11.3] mmHg at two, four, and eight injections per month, respectively. (C) DEX concentration in mouse eyes was measured at different time points using LC/MS/MS following injection (Inj) of DEX-NPs once or twice per week. Central lines show mean and error bars indicate 95% confidence intervals. For eyes receiving one injection, a higher DEX concentration was measured at day 7 than at day 3 (P = 0.03). At the 7-d time point, eyes receiving two injections had a higher DEX concentration than those receiving one injection (P = 0.03). The combined effects of time and number of injections yielded a significantly increased DEX concentration in the day 7, two-injection group compared with the Day 3, one-injection group (P = 0.0004). (D) Cello plots of outflow facility (45). All animals received one injection per week for 3 wk to 4 wk. Outflow facility in the CON-NP animals was 3.4 [2.2, 4.7] nL⋅min−1⋅mmHg−1 (n = 12) and was lower in DEX-NP−treated animals at 2.6 [1.5, 3.8] nL⋅min−1⋅mmHg−1 (n = 13), corresponding to a difference in outflow facility of −23% [−41%, 1%] that was borderline significant (P = 0.05). Shaded region indicates predicted log-normal distribution, with shaded band giving 95% confidence interval on the mean. Central white line shows mean value, with 2 SDs indicated by the outer white lines. Facility at 8 mmHg for each eye with 95% confidence intervals is shown by individual data points and error bars.
Fig. 2.
Fig. 2.
Morphological changes in conventional outflow tissues of mouse eyes treated with DEX-NPs. Age- and gender-matched C57BL/6 mice were injected bilaterally once per week for 2 mo with either vehicle-loaded NPs (CON-NPs) or DEX-loaded NPs (DEX-NPs). (A and B) Iridocorneal angle tissue morphology of CON-NP− versus DEX-NP−injected mouse eyes, visualized by light microscopy after methylene blue staining, showed no gross difference between DEX-NP− and CON-NP−injected eyes. (CF) Changes in α-SMA and FN levels in iridocorneal angle tissues of mouse eyes injected bilaterally with CON-NPs vs. DEX-NPs by immunofluorescence microscopy. Identical confocal settings were used for experimental and control groups. Conventional outflow tissues are outlined by white box, and nuclei are counterstained with DAPI. (AF: scale bar, 20-µm.) (G and H) (Top) Ultrastructure of conventional outflow tissues in DEX-NP−treated eyes compared with CON-NP−treated eyes. Giant vacuoles in Schlemm’s canal (SC) are indicated by hash marks. So-called “open spaces” in the juxtacanalicular region of the trabecular meshwork are indicated by asterisks. (Bottom) Boxed areas are enlarged, showing changes in basal lamina beneath SC endothelial cells. Red arrows indicate continuous basement membrane in DEX-NP−treated eyes compared with the discontinuous basal lamina seen in CON-NP−treated eyes (representative images from n = 4 animals); CB, ciliary body; *, SC lumen.
Fig. 3.
Fig. 3.
Effects of DEX-NP treatment as visualized in living mice by OCT imaging. Living mouse eyes treated with DEX-NPs or CON-NPs were cannulated to control IOP and were subjected to sequentially increasing pressure steps (shown here are 10, 15, and 20 mmHg; all pressure steps are shown in SI Appendix, Fig. S5). (AF) OCT imaging of conventional outflow tissues, viewed in cross-section, was conducted and images were averaged to reduce noise at each pressure step; (A′–F′) corresponding images show SC lumen segmentation by SchlemmSeg software with lumen overlaid in blue. Note the greater area of SC lumen in DEX-NP−treated eyes. IR, iris. (G) Quantitative comparison of SC lumen areas in both treatment groups (CON-NPs vs. DEX-NPs) at all clamped IOPs tested (10, 12, 15, 17, and 20 mmHg), confirming reduced tendency toward SC collapse in DEX-NP eyes. SC lumen area at each IOP level for each eye is normalized to the corresponding value at 10 mmHg. IOP is set (or “clamped”) by adjusting the height of a fluid reservoir. Markers indicate individual eyes, and bars indicate mean values for each IOP. Shaded regions indicate 95% confidence intervals. Mice were injected subconjunctivally or periocularly once or twice per week for 2 mo (n = 6 CON-NP versus n = 10 DEX-NP).
Fig. 4.
Fig. 4.
Inverse FEM to estimate stiffness of mouse TM. (A) Representative OCT image of a DEX-NP−treated mouse overlain with tissue domains used to construct 2D finite element model. AC, anterior chamber; PC, posterior chamber; PL, pectinate ligament. (B) Resulting finite element model showing locations at which loads were applied, namely the lumen of SC, the anterior chamber, and the posterior iris, as well as the effective loads (Vx, Vy) and moment (Mz) acting on the virtual cut plane at the image boundary, arising from pressures acting on the iris and cornea. (C) Predicted tissue deformations and effective Lagrange strains (color) overlain on corresponding OCT images at 15 and 20 mmHg; note the reasonable agreement between iris position at both pressures. (D) Comparison between experimentally measured SC luminal area at different IOPs, and inverse FEM results, showing an approximately twofold difference in estimated effective TM stiffness (29 kPa in CON-NP−treated eyes vs. 69 kPa in DEX-NP−treated eyes). IOP is set (or clamped) by adjusting the height of a fluid reservoir. The shaded regions show 95% confidence intervals.

References

    1. Ciulla TA, Walker JD, Fong DS, Criswell MH. Corticosteroids in posterior segment disease: An update on new delivery systems and new indications. Curr Opin Ophthalmol. 2004;15:211–220. - PubMed
    1. Lautredou CC, et al. Repeat intravitreal dexamethasone implant for refractory cystoid macular edema in syphilitic uveitis. Case Rep Ophthalmol Med. 2018;2018:7419823. - PMC - PubMed
    1. Al-Khersan H, Hariprasad SM, Chhablani J. Dex Implant Study Group Early response to intravitreal dexamethasone implant therapy in diabetic macular edema may predict visual outcome. Am J Ophthalmol. 2017;184:121–128. - PubMed
    1. Miller K, Fortun JA. Diabetic macular edema: Current understanding, pharmacologic treatment options, and developing therapies. Asia Pac J Ophthalmol (Phila) 2018;7:28–35. - PubMed
    1. Narayanan R, Kuppermann BD. Corticosteroids and anti-complement therapy in retinal diseases. Handb Exp Pharmacol. 2017;242:309–320. - PubMed

Publication types

MeSH terms

Substances