. 2019 Mar 13;39(11):2052-2064.
doi: 10.1523/JNEUROSCI.1459-18.2018. Epub 2019 Jan 16.

Superficial Layers Suppress the Deep Layers to Fine-tune Cortical Coding

Affiliations

Superficial Layers Suppress the Deep Layers to Fine-tune Cortical Coding

Scott R Pluta et al. J Neurosci. .

Abstract

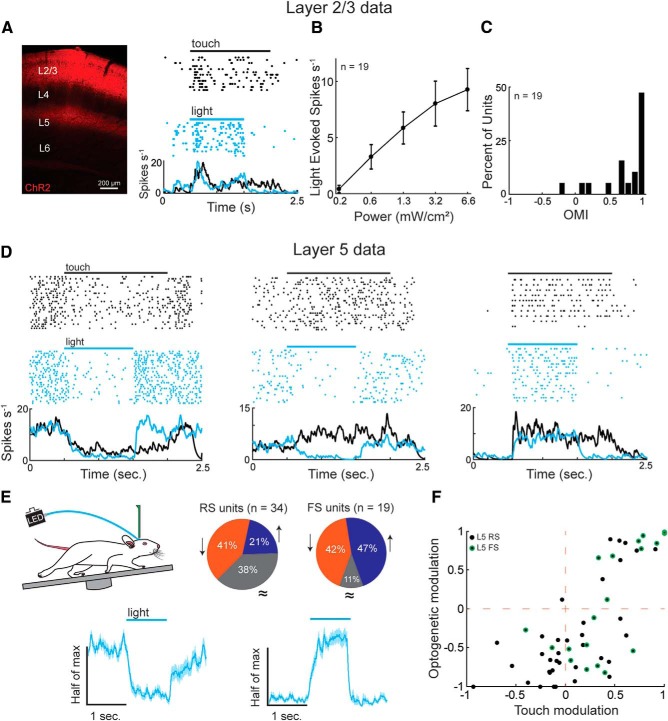
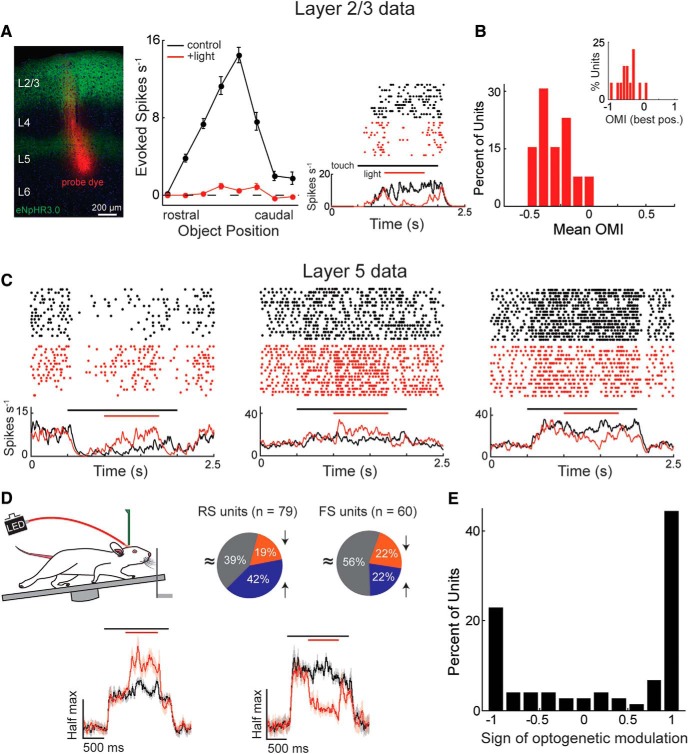
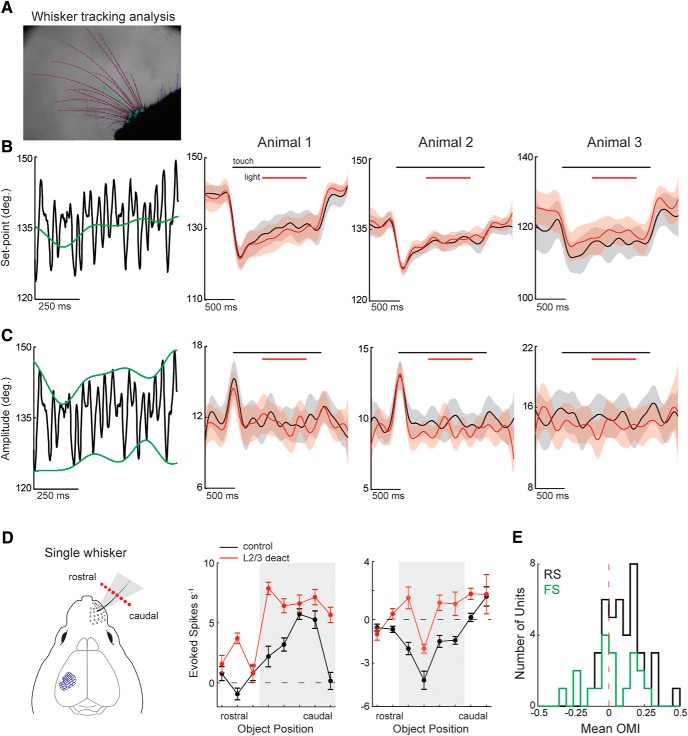
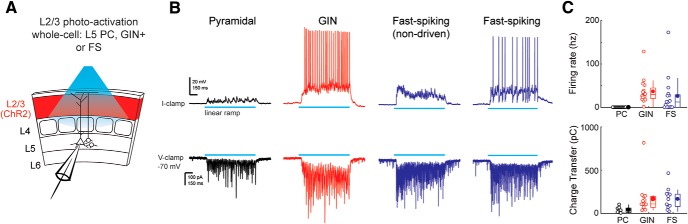
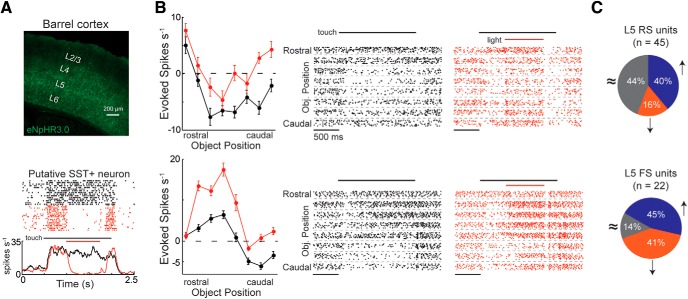
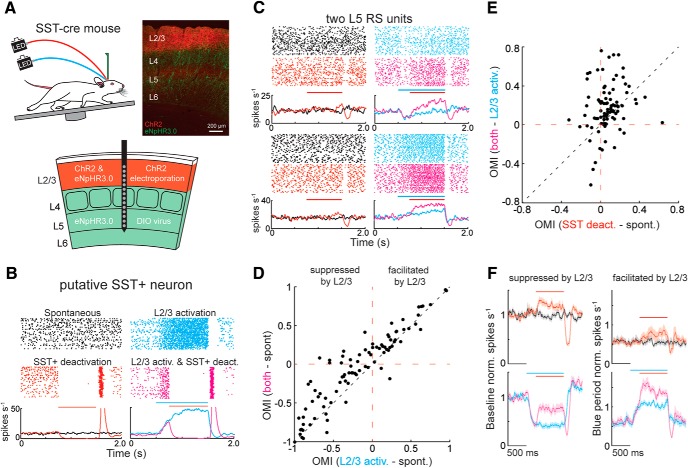
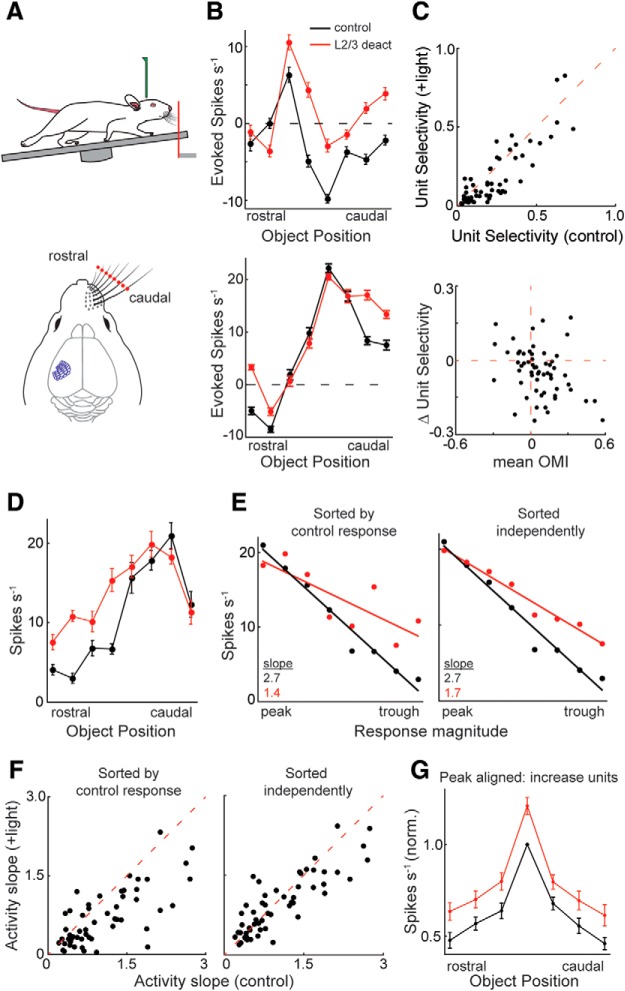
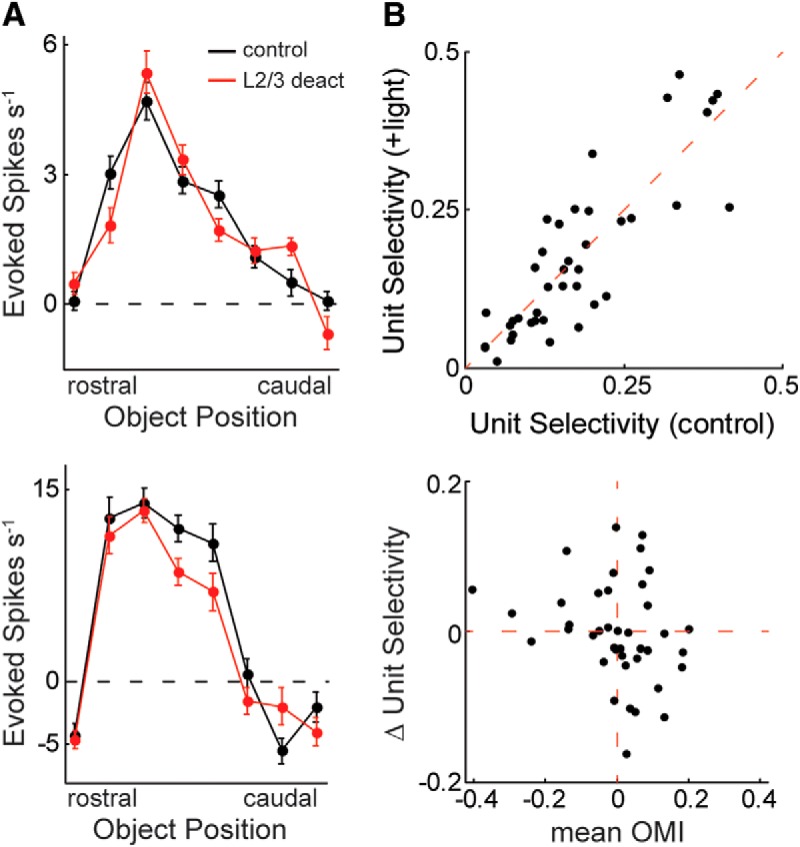
The descending microcircuit from layer 2/3 (L2/3) to layer 5 (L5) is one of the strongest excitatory pathways in the cortex, presumably forming a core component of its feedforward hierarchy. To date, however, no experiments have selectively tested the impact of L2/3 activity on L5 during active sensation. We used optogenetic, cell-type-specific manipulation of L2/3 neurons in the barrel cortex of actively sensing mice (of either sex) to elucidate the significance of this pathway to sensory coding in L5. Contrary to standard models, activating L2/3 predominantly suppressed spontaneous activity in L5, whereas deactivating L2/3 mainly facilitated touch responses in L5. Somatostatin interneurons are likely important to this suppression because their optogenetic deactivation significantly altered the functional impact of L2/3 onto L5. The net effect of L2/3 was to enhance the stimulus selectivity and expand the range of L5 output. These data imply that the core cortical pathway increases the selectivity and expands the range of cortical output through feedforward inhibition.SIGNIFICANCE STATEMENT The primary sensory cortex contains six distinct layers that interact to form the basis of our perception. While rudimentary patterns of connectivity between the layers have been outlined quite extensively in vitro, functional relationships in vivo, particularly during active sensation, remain poorly understood. We used cell-type-specific optogenetics to test the functional relationship between layer 2/3 and layer 5. Surprisingly, we discovered that L2/3 primarily suppresses cortical output from L5. The recruitment of somatostatin-positive interneurons is likely fundamental to this relationship. The net effect of this translaminar suppression is to enhance the selectivity and expand the range of receptive fields, therefore potentially sharpening the perception of space.

Keywords: active sensing; circuits; cortex; receptive fields; sensory coding; translaminar.


Figures

Figure 1.
Figure 1.
Optogenetic activation of L2/3 predominantly suppresses L5. A, A histological transverse section through the barrel cortex showing L2/3 ChR2 expression with the tdTomato fluorophore. A putative ChR2-expressing layer 2/3 RS neuron that is driven during active touch and activated by a linear ramp of blue light alone. B, ChR2 activation dose–response curve showing the relationship between peak light power and firing rate. L5 data were analyzed using 1.3 mW/cm2 power. C, OMI for the population of L2/3 RS neurons (p < 0.001, Wilcoxon signed-rank test, n = 19). D, Three example L5 RS neurons that were suppressed by touch or light (left), facilitated by touch but suppressed by light (middle), or facilitated by touch or light (right). E, Top, The percentage of L5 units that were significantly facilitated (blue), suppressed (orange), or unchanged (gray) by L2/3 activation (Wilcoxon signed-rank test, α = 0.05). Bottom, Normalized population firing rates of L5 (RS and FS) units grouped by the sign of the significant effect. Neurons suppressed by light were normalized to the baseline period (left), whereas neurons facilitated by light were normalized to the light period (right). F, Relationship between touch modulation and optogenetic modulation in L5 units (p < 0.001, R2 = 0.53, n = 55, multiple linear regression). Error bars are the standard error of the mean.
Figure 2.
Figure 2.
L2/3 primarily suppresses touch responses in L5. A, A histological transverse section through the barrel cortex showing L2/3 expression of eNpHR3.0 with a green fluorophore. Example receptive field, raster, and peristimulus time histogram showing the effect of red light on a L2/3 neuron putatively expressing eNpHR3.0. B, Mean OMI averaged across the 8 object positions for the L2/3 RS population. Inset, Histogram of OMI for the best stimulus position. C, The impact of L2/3 deactivation on touch-evoked activity in three different L5 units (right). D, Top, The percentage of L5 units where the response to active touch significantly increased (blue), decreased (orange), or did not change (gray) during L2/3 deactivation (two-way ANOVA, α = 0.05). Bottom, Normalized population histograms of L5 (RS and FS) firing rates grouped by the sign of the significant effect. The firing rates of each neuron were normalized to their largest control touch response. E, Histogram of the sign of optogenetic modulation in L5. Error bars are the standard error of the mean.
Figure 3.
Figure 3.
L2/3 deactivation does not change the set-point or amplitude of whisking during touch. A, An image from the processed whisker tracking video showing the tracing of the whiskers (magenta) and their mean position (green). B, Left, Diagram illustrating how whisker set-point was calculated, which was defined as the median angle of the whisking envelope. Right, Comparison of whisker set-point during touch alone (black) and touch combined with L2/3 deactivation (red) across 3 mice. C, Left, Diagram illustrating how the amplitude of whisker motion was calculated, which was defined as the half-distance between the top and bottom of the whisking envelope. Right, Comparison of whisk amplitude during touch alone (black) and touch combined with L2/3 deactivation (red) across the same 3 mice. In some mice, a brief (∼200 ms) increase in whisk amplitude occurred at the onset of object presentation but ended before L2/3 deactivation. L2/3 deactivation had no effect on the amplitude or set-point of whisking in any of the mice. All line plots indicate mean ± 95% CI. D, Diagram of the experiment with only the principal whisker intact. With the principal whisker alone, touch occurred only at a subset of object positions (gray). Two example L5 RS neurons show the facilitation of touch responses during L2/3 deactivation (DRD3-NpHR3.0). E, Mean optogenetic modulation of activity in the principal whisker contact zone for the population of RS (n = 41) and FS (n = 19) cells from 3 mice. Error in the tuning curves are the standard error of the mean.
Figure 4.
Figure 4.
L2/3 drives L5 SST+ interneurons. A, Diagram of the experimental setup. Intracellular recordings were performed on L5 PCs, genetically labeled (GIN+) L5 SST+, or FS interneurons, whereas L2/3 was activated using ChR2 that was virally expressed using the DRD3-Cre driver. B, Top row, Membrane potential from an example L5 PC (black), a L5 SST+ cell (red), and two L5 FS cells (blue) during L2/3 activation with a linear ramp of light (blue bar, 1 s duration). Bottom row, Excitatory currents from these same neurons during L2/3 activation with a linear ramp of light. Voltage was held at −70 mV. C, Comparison of firing rate distributions for these groups of cell types. Bottom, Comparison of excitatory charge transfer between these groups.
Figure 5.
Figure 5.
SST+ deactivation facilitates touch responses in L5 RS units. A, Top, Histological transverse section from an SST-cre mouse expressing eNpHR3.0 tagged with a green fluorophore (YFP). Bottom, Putative SST+ neuron from this mouse that had its activity nearly abolished during the light period. B, Tuning curves and raster plots from two example L5 RS neurons that significantly increase their firing rate during SST+ deactivation (two-way ANOVA, α = 0.05). In the raster plots, only the first 10 trials are shown for each condition to simplify visualization. C, The fraction of L5 neurons that significantly go up (blue), go down (orange), or do not change (gray) during SST+ deactivation (two-way ANOVA, α = 0.05). Error bars are the standard error of the mean.
Figure 6.
Figure 6.
L2/3's functional impact onto L5 is partially mediated by SST+ interneurons. A, A histological transverse section through the barrel cortex showing ChR2 expression in tdTomato and eNpHR3.0 expression in YFP. DIO-eNpHR3.0 was virally expressed in all layers, whereas ChR2 was expressed only in L2/3 using in utero electroporation. B, Spike raster of a putative SST+ L5 interneuron during spontaneous periods (black), during L2/3 photoactivation (blue), during SST+ photodeactivation (red), and during both presented simultaneously (magenta). C, As in B, but for two example L5 RS units where optogenetic deactivation of SST+ neurons removed L2/3-mediated suppression (top) or enhanced L2/3-mediated facilitation (bottom). D, OMI illustrating the effect of L2/3 activation on spontaneous activity versus the effect of L2/3 activation combined with SST+ deactivation on spontaneous activity. E, OMI scatter plot illustrating the greater disinhibitory effect of SST+ deactivation, whereas L2/3 is photoactivated (p < 0.001, n = 91, Wilcoxon signed-rank test). F, peristimulus time histograms of mean ± SEM of L5 RS unit firing rates during spontaneous activity and the three forms of optogenetic stimulation. Neurons were grouped by the sign of the effect of L2/3 activation and normalized as indicated. Error bars are the standard error of the mean.
Figure 7.
Figure 7.
L2/3 increases the selectivity and range of L5 RS receptive fields. A, Experimental set-up: head-fixed, running mice with their whisker pad intact palpated an object that was placed at eight different locations within their whisking field. B, Spatial tuning curves and rasters of two L5 RS neurons. Note the loss of touch suppression and the greater increase in spike rate in the surround regions of their receptive fields. C, Scatter plot comparing the stimulus selectivity of L5 RS units during control stimulation versus L2/3 deactivation (top, +light). L2/3 deactivation significantly reduces stimulus selectivity (p = 0.001, n = 58, Wilcoxon signed-rank test). Scatter plot of the L5 RS population comparing the mean OMI to the change in unit selectivity (bottom). D, Example L5 RS neuron with a tuning peak at the caudal region of the whisker field and a trough at the rostral region. E, The activity slopes of the example unit in D. Slopes were calculated after sorting in descending order relative to the magnitude of the control response (left) or sorting independently for both control and L2/3 deactivation conditions (right). F, Scatter plots of the L5 RS population comparing the activity slopes during control stimulation versus L2/3 deactivation. L2/3 deactivation significantly reduced the steepness of the slope (p < 0.0001: left; p = 0.02: right, Wilcoxon signed-rank test, n = 58). G, Mean ± SEM tuning curves of the population of L5 RS neurons that displayed an increase in activity during L2/3 deactivation (n = 41). Firing rates in each condition were aligned to their own peak and normalized to the largest control response. Error bars are the standard error of the mean.
Figure 8.
Figure 8.
L2/3 does not consistently alter the spatial selectivity of L5 FS units. A, Spatial tuning curves from two L5 FS neurons during control stimulation and L2/3 deactivation. B, Scatter plot comparing the selectivity of L5 FS neurons during control stimulation and L2/3 deactivation (p = 1.0, Wilcoxon signed-rank test, n = 40, top). Scatter plot relating the change in mean OMI to the change in unit selectivity during L2/3 deactivation (bottom). Error bars are the standard error of the mean.

Similar articles

Cited by

References

    1. Adesnik H, Scanziani M (2010) Lateral competition for cortical space by layer-specific horizontal circuits. Nature 464:1155–1160. 10.1038/nature08935 - DOI - PMC - PubMed
    1. Adesnik H, Bruns W, Taniguchi H, Huang ZJ, Scanziani M (2012) A neural circuit for spatial summation in visual cortex. Nature 490:226–231. 10.1038/nature11526 - DOI - PMC - PubMed
    1. Apicella AJ, Wickersham IR, Seung HS, Shepherd GM (2012) Laminarly orthogonal excitation of fast-spiking and low-threshold-spiking interneurons in mouse motor cortex. J Neurosci 32:7021–7033. 10.1523/JNEUROSCI.0011-12.2012 - DOI - PMC - PubMed
    1. Armstrong-James M, George MJ (1988) Influence of anesthesia on spontaneous activity and receptive field size of single units in rat Sm1 neocortex. Exp Neurol 99:369–387. 10.1016/0014-4886(88)90155-0 - DOI - PubMed
    1. Armstrong-James M, Fox K, Das-Gupta A (1992) Flow of excitation within rat barrel cortex on striking a single vibrissa. J Neurophysiol 68:1345–1358. 10.1152/jn.1992.68.4.1345 - DOI - PubMed

Publication types