

Uric acid activates aldose reductase and the polyol pathway for endogenous fructose and fat production causing development of fatty liver in rats
- PMID: 30651350
- PMCID: PMC6422088
- DOI: 10.1074/jbc.RA118.006158
Uric acid activates aldose reductase and the polyol pathway for endogenous fructose and fat production causing development of fatty liver in rats
Abstract
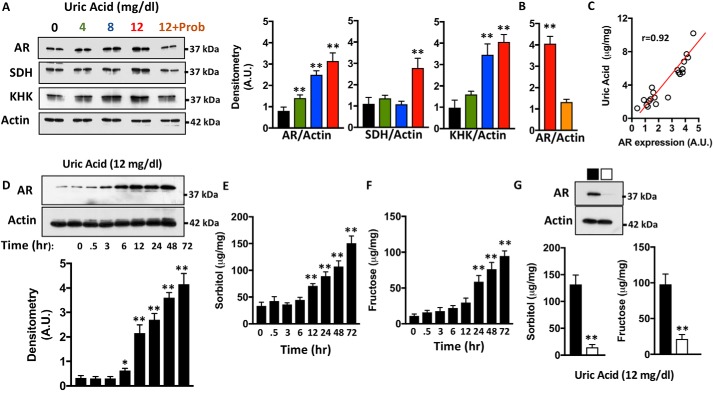
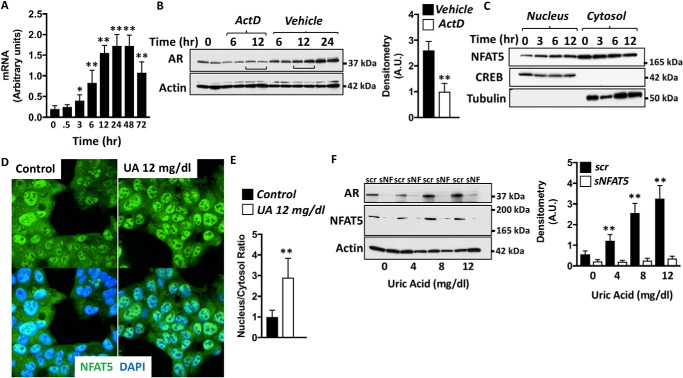
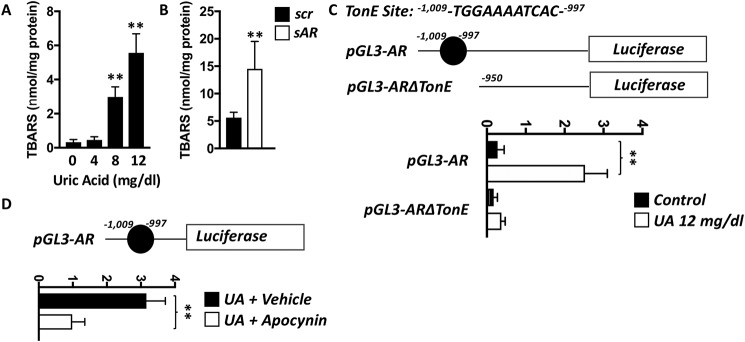
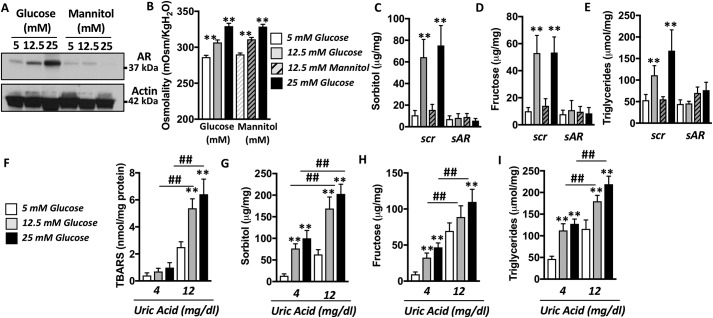
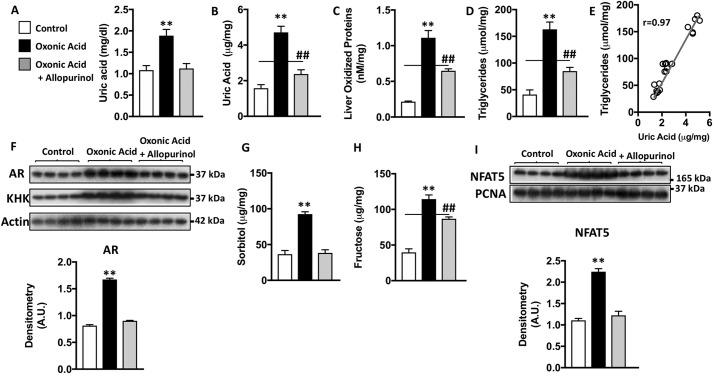
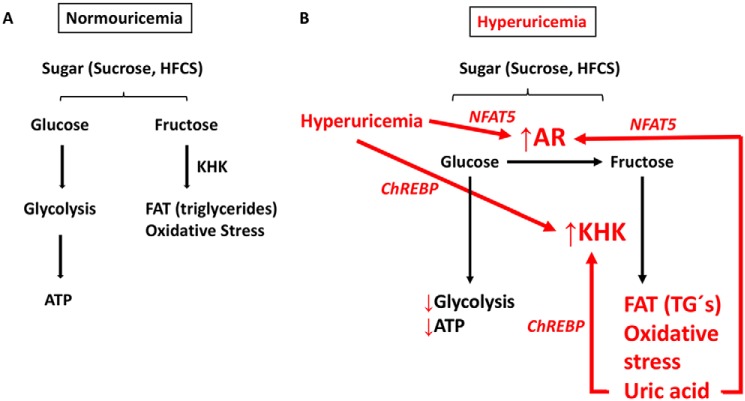
Dietary, fructose-containing sugars have been strongly associated with the development of nonalcoholic fatty liver disease (NAFLD). Recent studies suggest that fructose also can be produced via the polyol pathway in the liver, where it may induce hepatic fat accumulation. Moreover, fructose metabolism yields uric acid, which is highly associated with NAFLD. Here, using biochemical assays, reporter gene expression, and confocal fluorescence microscopy, we investigated whether uric acid regulates aldose reductase, a key enzyme in the polyol pathway. We evaluated whether soluble uric acid regulates aldose reductase expression both in cultured hepatocytes (HepG2 cells) and in the liver of hyperuricemic rats and whether this stimulation is associated with endogenous fructose production and fat accumulation. Uric acid dose-dependently stimulated aldose reductase expression in the HepG2 cells, and this stimulation was associated with endogenous fructose production and triglyceride accumulation. This stimulatory mechanism was mediated by uric acid-induced oxidative stress and stimulation of the transcription factor nuclear factor of activated T cells 5 (NFAT5). Uric acid also amplified the effects of elevated glucose levels to stimulate hepatocyte triglyceride accumulation. Hyperuricemic rats exhibited elevated hepatic aldose reductase expression, endogenous fructose accumulation, and fat buildup that was significantly reduced by co-administration of the xanthine oxidase inhibitor allopurinol. These results suggest that uric acid generated during fructose metabolism may act as a positive feedback mechanism that stimulates endogenous fructose production by stimulating aldose reductase in the polyol pathway. Our findings suggest an amplifying mechanism whereby soft drinks rich in glucose and fructose can induce NAFLD.
Keywords: aldose reductase; fatty acid; fructose; liver metabolism; metabolic syndrome; polyol pathway; sorbitol; uric acid.
© 2019 Sanchez-Lozada et al.
Conflict of interest statement
Some of the authors are members of Colorado Research Partners LLC, a start-up company developing inhibitors of fructose metabolism (M. A. L., A. A.-H., C. A. R.-J., R. J. J., and L. G. S.-L.). Dr. Johnson also has equity with a start-up company (XORT Therapeutics) developing novel xanthine oxidase inhibitors
Figures
Similar articles
-
Aldose reductase, fructose and fat production in the liver.Biochem J. 2025 Mar 5;482(5):295-307. doi: 10.1042/BCJ20240748. Biochem J. 2025. PMID: 40040471 Free PMC article. Review.
-
Elevated Fructose and Uric Acid Through Aldose Reductase Contribute to Experimental and Human Alcoholic Liver Disease.Hepatology. 2020 Nov;72(5):1617-1637. doi: 10.1002/hep.31197. Epub 2020 Oct 15. Hepatology. 2020. PMID: 32086945
-
Endogenous fructose production and metabolism in the liver contributes to the development of metabolic syndrome.Nat Commun. 2013;4:2434. doi: 10.1038/ncomms3434. Nat Commun. 2013. PMID: 24022321 Free PMC article.
-
Uric acid induces hepatic steatosis by generation of mitochondrial oxidative stress: potential role in fructose-dependent and -independent fatty liver.J Biol Chem. 2012 Nov 23;287(48):40732-44. doi: 10.1074/jbc.M112.399899. Epub 2012 Oct 3. J Biol Chem. 2012. PMID: 23035112 Free PMC article.
-
The Role of Aldose Reductase in Polyol Pathway: An Emerging Pharmacological Target in Diabetic Complications and Associated Morbidities.Curr Pharm Biotechnol. 2024;25(9):1073-1081. doi: 10.2174/1389201025666230830125147. Curr Pharm Biotechnol. 2024. PMID: 37649296 Review.
Cited by
-
Fructose metabolism as a common evolutionary pathway of survival associated with climate change, food shortage and droughts.J Intern Med. 2020 Mar;287(3):252-262. doi: 10.1111/joim.12993. Epub 2019 Oct 31. J Intern Med. 2020. PMID: 31621967 Free PMC article. Review.
-
Could Alzheimer's disease be a maladaptation of an evolutionary survival pathway mediated by intracerebral fructose and uric acid metabolism?Am J Clin Nutr. 2023 Mar;117(3):455-466. doi: 10.1016/j.ajcnut.2023.01.002. Epub 2023 Jan 11. Am J Clin Nutr. 2023. PMID: 36774227 Free PMC article. Review.
-
Allopurinol Prevents the Lipogenic Response Induced by an Acute Oral Fructose Challenge in Short-Term Fructose Fed Rats.Biomolecules. 2019 Oct 11;9(10):601. doi: 10.3390/biom9100601. Biomolecules. 2019. PMID: 31614639 Free PMC article.
-
THIRSTY FOR FRUCTOSE: Arginine Vasopressin, Fructose, and the Pathogenesis of Metabolic and Renal Disease.Front Cardiovasc Med. 2022 May 17;9:883365. doi: 10.3389/fcvm.2022.883365. eCollection 2022. Front Cardiovasc Med. 2022. PMID: 35656391 Free PMC article. Review.
-
Fructose and the Liver.Int J Mol Sci. 2021 Jun 28;22(13):6969. doi: 10.3390/ijms22136969. Int J Mol Sci. 2021. PMID: 34203484 Free PMC article. Review.
References
-
- Abdelmalek M. F., Lazo M., Horska A., Bonekamp S., Lipkin E. W., Balasubramanyam A., Bantle J. P., Johnson R. J., Diehl A. M., Clark J. M., and Fatty Liver Subgroup of Look AHEAD Research Group (2012) Higher dietary fructose is associated with impaired hepatic adenosine triphosphate homeostasis in obese individuals with type 2 diabetes. Hepatology 56, 952–960 10.1016/j.jhep.2011.08.025,10.1002/hep.25741 - DOI - PMC - PubMed
-
- Abdelmalek M. F., Suzuki A., Guy C., Unalp-Arida A., Colvin R., Johnson R. J., Diehl A. M., and Nonalcoholic Steatohepatitis Clinical Research Network (2010) Increased fructose consumption is associated with fibrosis severity in patients with nonalcoholic fatty liver disease. Hepatology 51, 1961–1971 10.1002/hep.23535 - DOI - PMC - PubMed
-
- Jensen T., Abdelmalek M. F., Sullivan S., Nadeau K. J., Green M., Roncal C., Nakagawa T., Kuwabara M., Sato Y., Kang D. H., Tolan D. R., Sanchez-Lozada L. G., Rosen H. R., Lanaspa M. A., Diehl A. M., et al. (2018) Fructose and sugar: A major mediator of non-alcoholic fatty liver disease. J. Hepatol. 68, 1063–1075 10.1016/j.jhep.2018.01.019 - DOI - PMC - PubMed
Publication types
MeSH terms
Substances
Grants and funding
LinkOut - more resources
Full Text Sources
Medical
