. 2019 Mar 15;294(11):3934-3946.
doi: 10.1074/jbc.RA118.004543. Epub 2019 Jan 16.

The kinetic mechanisms of fast-decay red-fluorescent genetically encoded calcium indicators

Affiliations

The kinetic mechanisms of fast-decay red-fluorescent genetically encoded calcium indicators

Silke Kerruth et al. J Biol Chem. .

Abstract

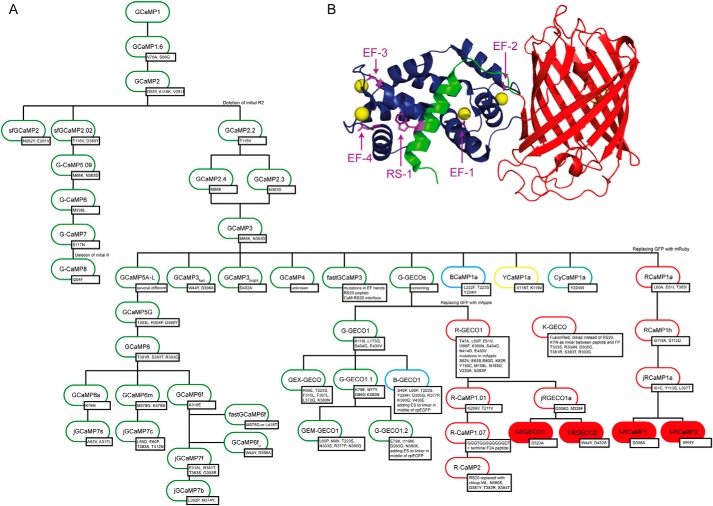
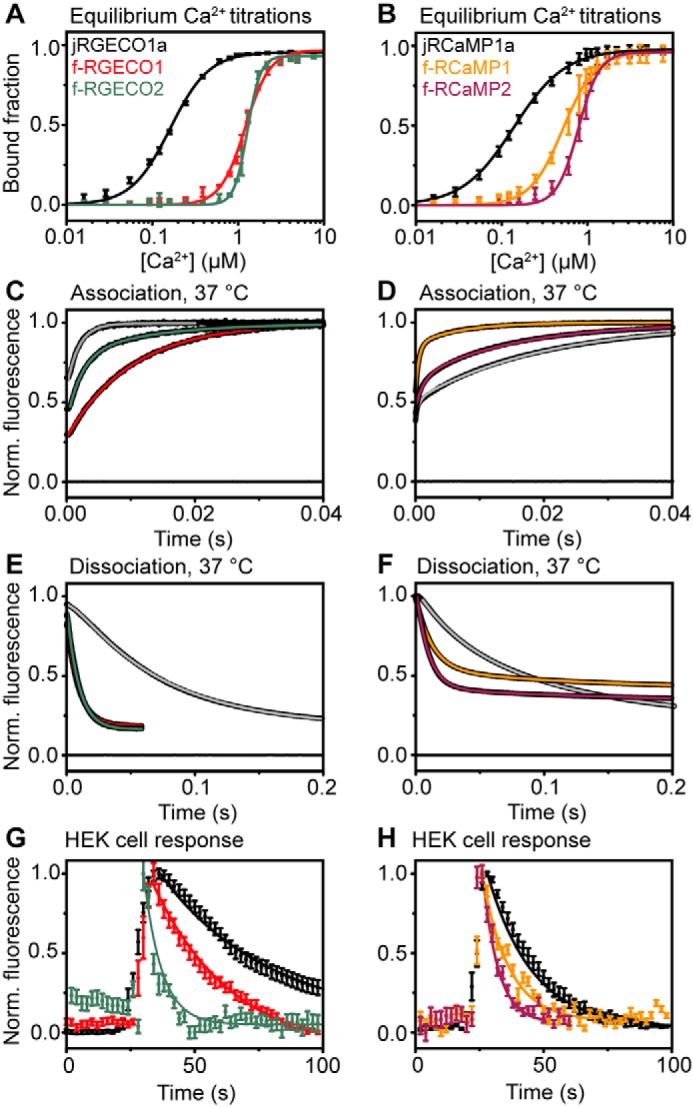
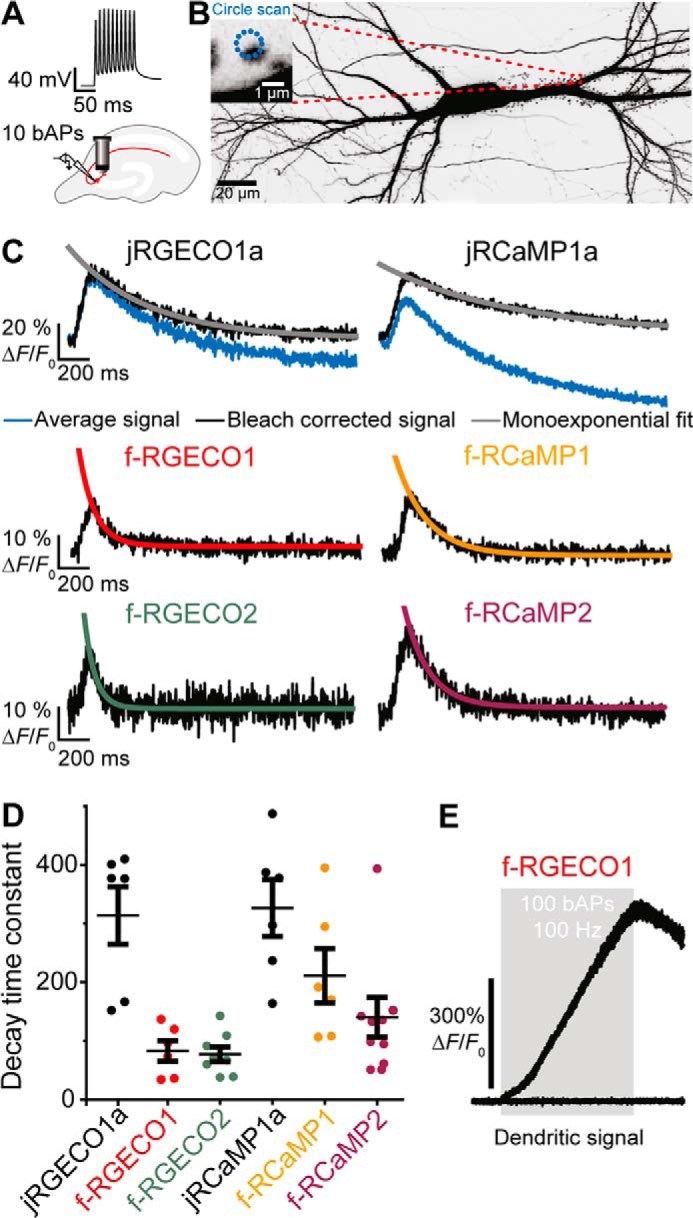
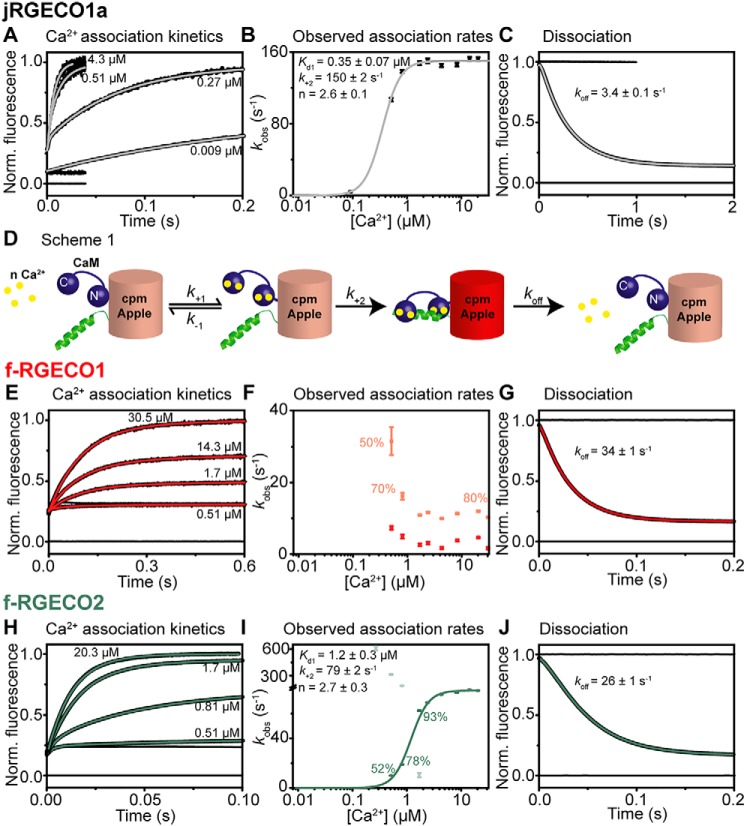
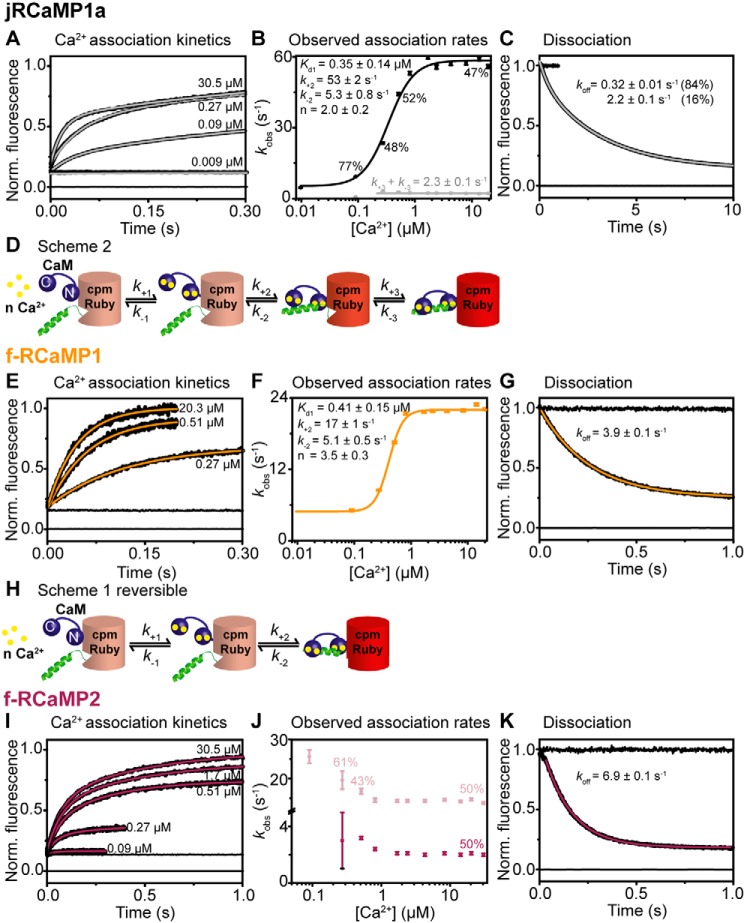
Genetically encoded calcium indicators (GECIs) are useful reporters of cell-signaling, neuronal, and network activities. We have generated novel fast variants and investigated the kinetic mechanisms of two recently developed red-fluorescent GECIs (RGECIs), mApple-based jRGECO1a and mRuby-based jRCaMP1a. In the formation of fluorescent jRGECO1a and jRCaMP1a complexes, calcium binding is followed by rate-limiting isomerization. However, fluorescence decay of calcium-bound jRGECO1a follows a different pathway from its formation: dissociation of calcium occurs first, followed by the peptide, similarly to GCaMP-s. In contrast, fluorescence decay of calcium-bound jRCaMP1a occurs by the reversal of the on-pathway: peptide dissociation is followed by calcium. The mechanistic differences explain the generally slower off-kinetics of jRCaMP1a-type indicators compared with GCaMP-s and jRGECO1a-type GECI: the fluorescence decay rate of f-RCaMP1 was 21 s-1, compared with 109 s-1 for f-RGECO1 and f-RGECO2 (37 °C). Thus, the CaM-peptide interface is an important determinant of the kinetic responses of GECIs; however, the topology of the structural link to the fluorescent protein demonstrably affects the internal dynamics of the CaM-peptide complex. In the dendrites of hippocampal CA3 neurons, f-RGECO1 indicates calcium elevation in response to a 100 action potential train in a linear fashion, making the probe particularly useful for monitoring large-amplitude, fast signals, e.g. those in dendrites, muscle cells, and immune cells.

Keywords: biosensor; calcium; calcium imaging; fluorescence; kinetics.


Conflict of interest statement

The authors declare that they have no conflicts of interest with the contents of this article

Figures

Figure 1.
Figure 1.
A, GECI family tree. Shown are the most famous variants of published data. The inserted mutations are shown in the small boxes next to the names. The numbering is according to GCaMP1 (also for RGECI) for better comparison of the mutations done in the RS20 (positions 41–59) and CaM (positions 305–451) domain. Starting from GCaMP1 (5), mutations in the cpEGFP were introduced to make the construct more stable at 37 °C and also preventing dimerization, leading to the development of GCaMP1.6 and GCaMP2 (38). From this construct the deletion of R2 and a few other mutations led to the improved sensor GCaMP3 (12). GCaMP3 is the base of many different GCaMPs as well as the ones with shifted emission spectra, like BCaMP1a, YCaMP1a, and CyCaMP1a (7) or the family of G-GECO, which was used to derive sensors named B-GECO and R-GECO (16). In addition to expanding the color palette, probes with higher fluorescence intensity and improved kinetics were generated, such as the GCaMP5 (14), GCaMP6 (13), and the recently published jGCaMP7 family (39). Others focused on generating sensors with very fast kinetics like fastGCaMP3 (21) and GCaMP3fast (23), as well as fastGCaMP6f (22) and GCaMP6fu (24). Parallel to the development of the GCaMP3 branch, a second branch evolved on the basis of GCaMP2 that also included the mutations of GCaMP3 and the mutation of the superfast GFP, generating GCaMP5.09, GCaMP6, and the very bright GCaMP7, as well as GCaMP8 that also, like all GCaMP3-based sensors, misses R2 (15). For the development of the red probe–based RCaMP1a and R-GECO1 cpEGFP was replaced by mRuby or mApple, respectively. Mutations in the RFPs are explicated. On their basis the variants jRGECO1a and jRCaMP1a were generated (8); they are the parental sensors for the probes developed in this work (highlighted in red). Confusingly, sensors also named R-CaMP, based on RGECO1, were generated that also carry mApple as their fluorescent protein but differ by a few mutations (R-CaMP1.01) or contain a C-terminal FA peptide (R-CaMP1.07) (17). Based on this probe, R-CaMP2 was published in which the RS20 peptide was replaced by a chimera of the CaM-binding sequence of CaM-dependent kinase kinases α and β (9). Recently a novel red fluorescent GECI, named K-GECO, was developed that is based on a fluorescent protein from Discosoma sp. mushroom and the rat CaM-dependent kinase kinase peptide (ckkap) (40). B, crystal structure of jRCaMP1a (PDB code 3U0K (7)). CaM is shown in dark blue with bound Ca2+ as yellow spheres. RS20 is shown in green and circularly permuted mRuby is colored red. The mutation sites described here are shown as sticks and are highlighted in purple.
Figure 2.
Figure 2.
Biophysical characterization of fast-decay RGECIs. A, equilibrium Ca2+ titrations for jRGECO1a (black squares) and its fast variants f-RGECO1 (red squares) and f-RGECO2 (green squares). The data points represent the means with S.D. and are fitted to the Hill equation (solid lines). B, equilibrium Ca2+ titrations for jRCaMP1a (black squares) and its fast variants f-RCaMP1 (yellow squares) and f-RCaMP2 (purple squares). The data points represent the means with S.D. and are fitted to the Hill equation (solid lines). C and D, association kinetics of jRGECO1a (gray line), f-RGECO1 (red line), and f-RGECO2 (green line) (C) and of jRCaMP1a (gray line), f-RCaMP1 (yellow line), and f-RCaMP2 (purple line) (D) were measured by stopped-flow fluorimetry by mixing the RGECIs in 10 mm EGTA solution with 10 mm CaCl2 (concentrations in the mixing chamber) at 37 °C. E and F, dissociation kinetics of jRGECO1a (gray line), f-RGECO1 (red line), and f-RGECO2 (green line) (E) and of jRCaMP1a (gray line), f-RCaMP1 (yellow line), and f-RCaMP2 (purple line) at (F) 37 °C. Dissociation kinetics were recorded by rapid mixing of the Ca2+ saturated RGECIs with buffer containing a high concentration (12.5 mm in the mixing chamber) of EGTA. The data were normalized to final maximum of 1. Fluorescence recorded when buffer was mixed with buffer containing fluorescent protein is indicated by the line at 0. The data were fitted to either monoexponential or biexponential decays as appropriate. G and H, Ca2+ response kinetics in ATP-stimulated HEK293T cells of jRGECO1a (black circle), f-RGECO1 (red circle), and f-RGECO2 (green circle) (G) and of jRCaMP1a (black circle), f-RCaMP1 (yellow circle), and f-RCaMP2 (purple circle) (H) with fast variant red GECIs. Ca2+ transients were triggered by exposing HEK293T cells to 50 μm ATP. Time courses were recorded at 2-s intervals and are shown for together with their monoexponential decay fit (solid lines).
Figure 3.
Figure 3.
Spine Ca2+ transients in response to backpropagating action potentials. A, backpropagating action potentials are elicited in a transfected CA3 pyramidal cell by somatic current injections. Ca2+ transients are simultaneously optically recorded from a single spine with two-photon imaging. B, maximum intensity projection of two-photon image stacks of CA3 pyramidal neuron expressing jRGECO1a and GFP, 8 days after electroporation. Green fluorescence intensity is shown as inverted gray values. The scale bar represents 20 μm (neuron) and 1 μm (single spine). C, decay time measurements after bleaching correction (red trace) for individual experiments (five trials averaged per spine) by single exponential fit. D, decay time constants measured in individual spines in response to 10 backpropagating action potentials of CA3 neurons expressing jRGECO1a (τoff = 314 ± 49 ms; n = 6 spines); f-RGECO1 (τoff = 83 ± 17 ms; n = 6 spines); f-RGECO2 (τoff = 77 ± 13 ms; n = 8 spines); jRCaMP1a (τoff = 327 ± 49 ms; n = 6 spines); f-RCaMP1 (τoff = 211 ± 46 ms; n = 6 spines); and f-RCaMP2 (τoff = 140 ± 34 ms; n = 9 spines). The values are expressed as means ± S.E. E, dendritic Ca2+ transients in response to 100 backpropagating action potentials at 100 Hz (train duration, 1 s; gray box) measured in the apical dendrite of a CA3 neuron expressing f-RGECO1. The low affinity of f-RGECO1 prevents the signal from reaching a saturating plateau even in response to a train of 100 backpropagating action potentials.
Figure 4.
Figure 4.
Kinetic mechanism of jRGECO1a and its fast variants. The data were collected at 20 °C. A, E, and H, Ca2+ association kinetics of jRGECO1a (A), f-RGECO1 (E), and f-RGECO2 (H). Records in order of increasing amplitude are as follows: buffer mixed with buffer (zero line), buffer mixed with jRGECI (10 mm EGTA in mixing chamber), buffers with the indicated final [Ca2+] (in the mixing chamber) mixed with jRGECI (10 mm EGTA in mixing chamber). B, F, and I, plots of [Ca2+] dependence of observed association rates of jRGECO1a (B), f-RGECO1 (F), and f-RGECO2 (I). The sigmoidal curves represent the best fit to Equation 1 derived for Scheme S1. D, the fitted parameters are shown in the panels. C, G, and J, Ca2+ dissociation kinetics of jRGECO1a (C), f-RGECO1 (G), and f-RGECO2 (J). Record at 0 represents trace when buffer was mixed with buffer (zero line), time trace at 1 corresponds to buffer mixed with jRGECI (1 mm Ca2+ in mixing chamber), whereas the decays were recorded when jRGECIs were mixed with EGTA (12.5 mm EGTA in mixing chamber).
Figure 5.
Figure 5.
Kinetic mechanism of jRCaMP1a and its fast variants. The data were collected at 20 °C. A, E, and I, Ca2+ association kinetics for jRCaMP1a (A), f-RCaMP1 (E), and f-RCaMP2 (I). Records in order of increasing amplitude are buffer mixed with buffer (zero line), buffer mixed with jRGECI (10 mm EGTA in mixing chamber), and buffers with the indicated final [Ca2+] (in the mixing chamber) mixed with jRGECI (10 mm EGTA in mixing chamber). B, F, and J, plots of [Ca2+] dependence of observed association rates for jRCaMP1a (B), f-RCaMP1 (F), and f-RCaMP2 (J). The sigmoidal curve represents the best fit to Equation 3 derived from Scheme S1. H, the fitted parameters are shown in the panel. D, jRCaMP1a shows two fluorescent states and thus follows a more complex mechanism (Scheme S2). C, G, and K, Ca2+ dissociation kinetics of jRCaMP1a (C), f-RCaMP1 (G), and f-RCaMP2 (K). Record at 0 represents trace when buffer was mixed with buffer (zero line), time trace at 1 corresponds to buffer mixed with jRGECI (1 mm Ca2+ in mixing chamber), whereas the decays were recorded when jRGECIs were mixed with EGTA (12.5 mm EGTA in mixing chamber).

References

    1. Grienberger C., and Konnerth A. (2012) Imaging calcium in neurons. Neuron 73, 862–885 10.1016/j.neuron.2012.02.011 - DOI - PubMed
    1. Lin M. Z., and Schnitzer M. J. (2016) Genetically encoded indicators of neuronal activity. Nat. Neurosci. 19, 1142–1153 10.1038/nn.4359 - DOI - PMC - PubMed
    1. Broussard G. J., Liang R., and Tian L. (2014) Monitoring activity in neural circuits with genetically encoded indicators. Front. Mol. Neurosci. 7, 97 - PMC - PubMed
    1. Miyawaki A., Llopis J., Heim R., McCaffery J. M., Adams J. A., Ikura M., and Tsien R. Y. (1997) Fluorescent indicators for Ca2+ based on green fluorescent proteins and calmodulin. Nature 388, 882–887 10.1038/42264 - DOI - PubMed
    1. Nakai J., Ohkura M., and Imoto K. (2001) A high signal-to-noise Ca2+ probe composed of a single green fluorescent protein. Nat. Biotechnol. 19, 137–141 10.1038/84397 - DOI - PubMed

Publication types