. 2019 Mar 21;93(7):e01403-18.
doi: 10.1128/JVI.01403-18. Print 2019 Apr 1.

Antigenicity and Immunogenicity of Differentially Glycosylated Hepatitis C Virus E2 Envelope Proteins Expressed in Mammalian and Insect Cells

Affiliations

Antigenicity and Immunogenicity of Differentially Glycosylated Hepatitis C Virus E2 Envelope Proteins Expressed in Mammalian and Insect Cells

Richard A Urbanowicz et al. J Virol. .

Abstract

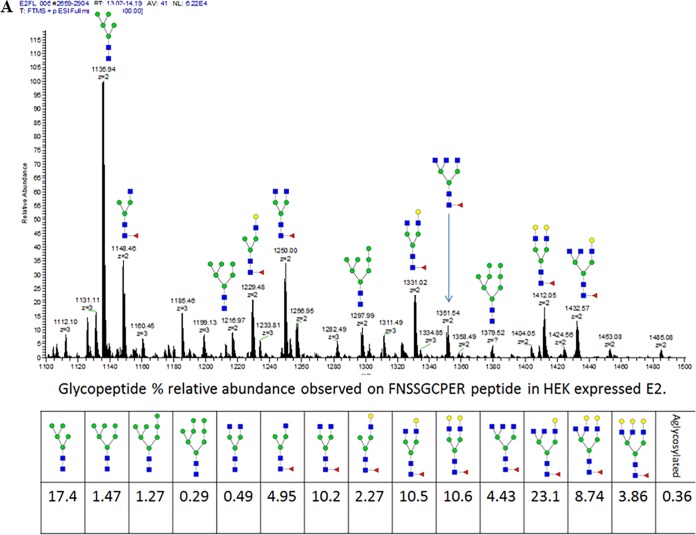
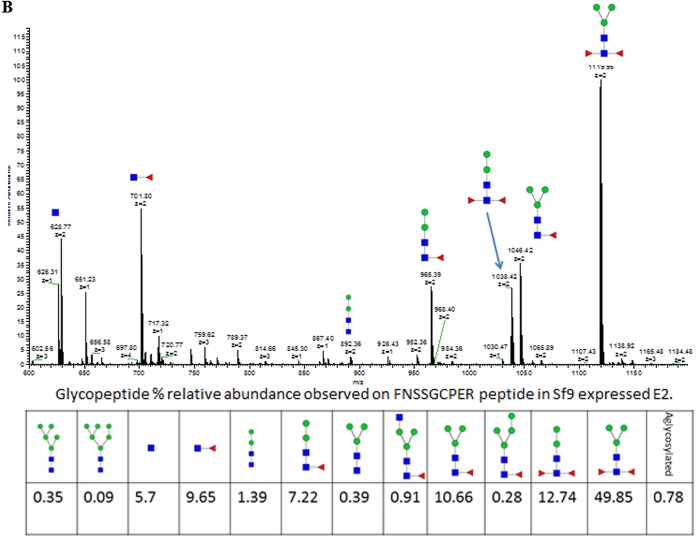
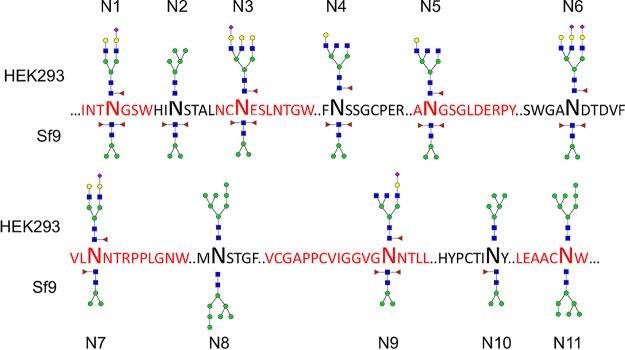
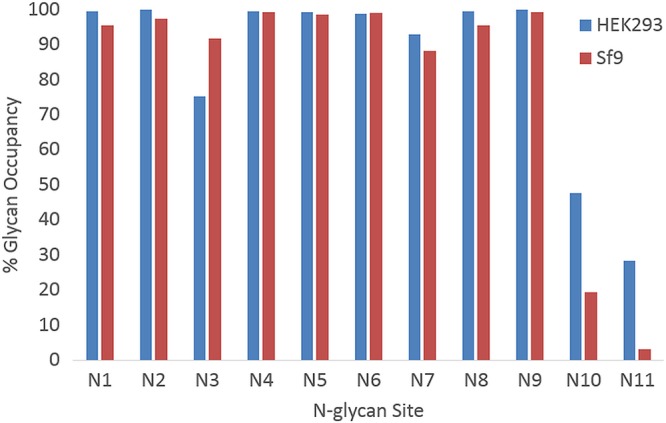
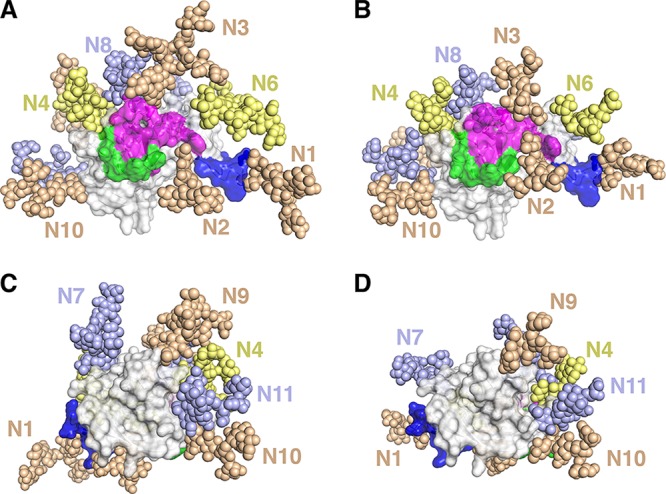
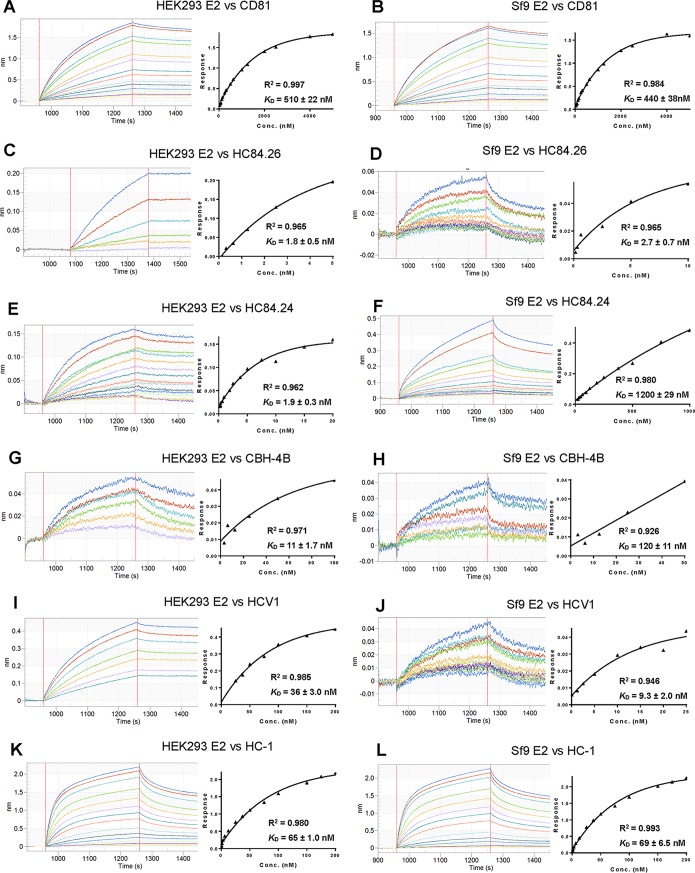
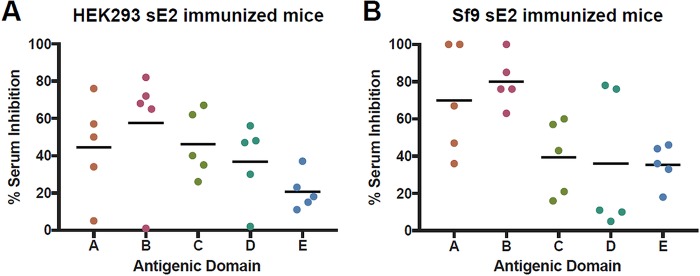
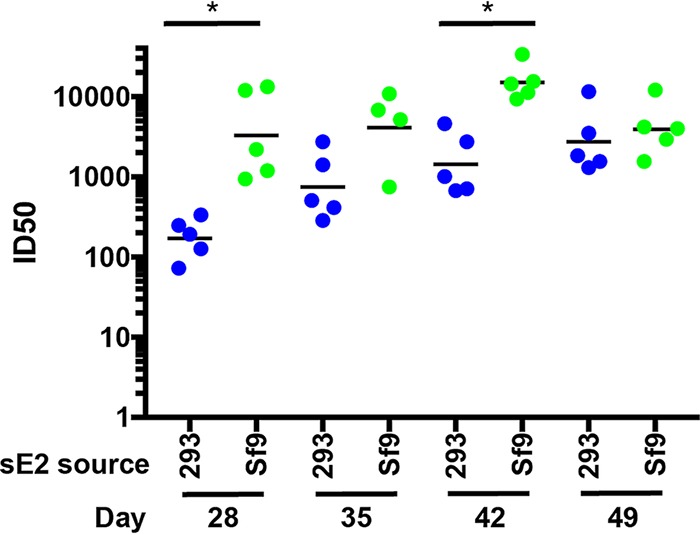
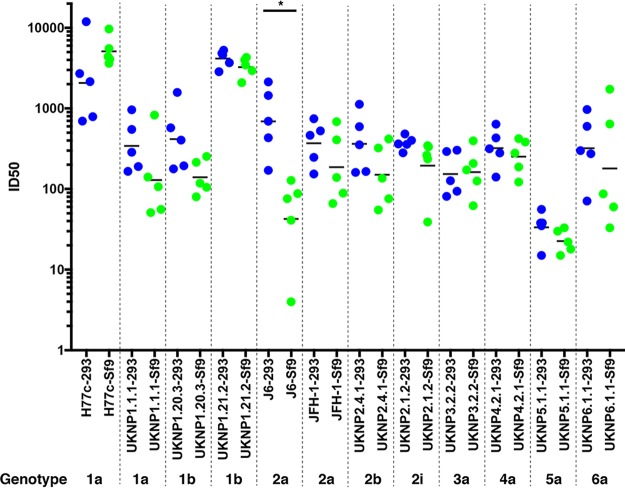
The development of a prophylactic vaccine for hepatitis C virus (HCV) remains a global health challenge. Cumulative evidence supports the importance of antibodies targeting the HCV E2 envelope glycoprotein to facilitate viral clearance. However, a significant challenge for a B cell-based vaccine is focusing the immune response on conserved E2 epitopes capable of eliciting neutralizing antibodies not associated with viral escape. We hypothesized that glycosylation might influence the antigenicity and immunogenicity of E2. Accordingly, we performed head-to-head molecular, antigenic, and immunogenic comparisons of soluble E2 (sE2) produced in (i) mammalian (HEK293) cells, which confer mostly complex- and high-mannose-type glycans; and (ii) insect (Sf9) cells, which impart mainly paucimannose-type glycans. Mass spectrometry demonstrated that all 11 predicted N-glycosylation sites were utilized in both HEK293- and Sf9-derived sE2, but that N-glycans in insect sE2 were on average smaller and less complex. Both proteins bound CD81 and were recognized by conformation-dependent antibodies. Mouse immunogenicity studies revealed that similar polyclonal antibody responses were generated against antigenic domains A to E of E2. Although neutralizing antibody titers showed that Sf9-derived sE2 induced moderately stronger responses than did HEK293-derived sE2 against the homologous HCV H77c isolate, the two proteins elicited comparable neutralization titers against heterologous isolates. Given that global alteration of HCV E2 glycosylation by expression in different hosts did not appreciably affect antigenicity or overall immunogenicity, a more productive approach to increasing the antibody response to neutralizing epitopes may be complete deletion, rather than just modification, of specific N-glycans proximal to these epitopes.IMPORTANCE The development of a vaccine for hepatitis C virus (HCV) remains a global health challenge. A major challenge for vaccine development is focusing the immune response on conserved regions of the HCV envelope protein, E2, capable of eliciting neutralizing antibodies. Modification of E2 by glycosylation might influence the immunogenicity of E2. Accordingly, we performed molecular and immunogenic comparisons of E2 produced in mammalian and insect cells. Mass spectrometry demonstrated that the predicted glycosylation sites were utilized in both mammalian and insect cell E2, although the glycan types in insect cell E2 were smaller and less complex. Mouse immunogenicity studies revealed similar polyclonal antibody responses. However, insect cell E2 induced stronger neutralizing antibody responses against the homologous isolate used in the vaccine, albeit the two proteins elicited comparable neutralization titers against heterologous isolates. A more productive approach for vaccine development may be complete deletion of specific glycans in the E2 protein.

Keywords: HCV; envelope glycoproteins; hepatitis C virus; immunogenicity; insect cells; mammalian cells; neutralization; vaccine.


Figures

FIG 1
FIG 1
Expression of soluble HCV E2 (sE2) derived from mammalian (HEK293) and insect (Sf9) cells. (A) Schematic representation of sE2 expression cassettes used in mammalian (HEK293-sE2) and insect cell (Sf9-sE2) vectors. A sequence encoding sE2 (amino acids 384 to 661) from genotype 1a (H77) was cloned into the vector pSecTag2 in-frame with an immunoglobulin light-chain κ signal peptide sequence and fused with a C-terminal His6 tag. Recombinant plasmid was used to transfect HEK293-F cells. The same sequence was cloned into the baculovirus expression vector pAcGP67-B with a polyhedrin (Polh) promoter. The construct was transfected into Sf9 cells together with BaculoGold linearized baculovirus DNA to produce sE2. (B) Superdex 200 size-exclusion chromatography profile of HEK293-derived sE2 following HisTrap Ni2+-NTA affinity chromatography. Peak (red arrow) corresponding to monomeric sE2 was isolated for analytical and immunization studies. mAU, milliabsorbance units. (C) Superdex 200 chromatography profile of Sf9-derived sE2 following HisTrap Ni2+-NTA chromatography. Peak (red arrow) corresponding to monomeric sE2 was isolated for all further experiments. Peak marked by red arrow corresponds to monomeric sE2. (D) Nonreducing SDS-PAGE (10% gels) of purified HEK293- and Sf9-derived sE2 proteins used for analytical characterization and immunization studies (Coomassie blue G-250 staining). (E) Western blot analysis of purified HEK293- and Sf9-derived sE2 proteins. Proteins were separated on SDS-PAGE (4 to 15%) gels after reduction by β-mercaptoethanol and boiling for 10 min. Proteins were then transferred onto a nitrocellulose membrane (Bio-Rad Laboratories). The membrane was probed with anti-HCV E2 HMAb HC33.1 (6) at 4.5 μg/ml, followed by secondary goat anti-human IgG-horseradish peroxidase (IgG-HRP) conjugate at a 1:5,000 dilution.
FIG 2
FIG 2
Representative electrospray ionization MS (ESI-MS) of chymotryptic peptide FNSSGCPER (amino acids 447 to 455) from HCV sE2. (A) Glycopeptide heterogeneity observed on FNSSGCPER peptide from HEK293-expressed sE2 (relative abundance [RA], ≥1% listed in spectrum and RA, ≥0.1% listed in table). (B) Glycopeptide heterogeneity observed on FNSSGCPER peptide in Sf9-expressed E2 (RA, ≥1% listed in spectrum and RA, ≥0.1% listed in table). Note that only doubly charged glycopeptides are labeled in the spectrum for clarity for both panels A and B.
FIG 2
FIG 2
Representative electrospray ionization MS (ESI-MS) of chymotryptic peptide FNSSGCPER (amino acids 447 to 455) from HCV sE2. (A) Glycopeptide heterogeneity observed on FNSSGCPER peptide from HEK293-expressed sE2 (relative abundance [RA], ≥1% listed in spectrum and RA, ≥0.1% listed in table). (B) Glycopeptide heterogeneity observed on FNSSGCPER peptide in Sf9-expressed E2 (RA, ≥1% listed in spectrum and RA, ≥0.1% listed in table). Note that only doubly charged glycopeptides are labeled in the spectrum for clarity for both panels A and B.
FIG 3
FIG 3
Schematic representation of HCV sE2 chymotryptic glycopeptides depicted with the most abundant glycan observed during LC-MS analysis of HEK293 (top glycoform) and Sf9 (bottom glycoform) sE2 proteins. In cases where the most abundant proteoform was aglycosylated, the most abundant glycosylated form was used (Table S1). “…” represents flanking amino acid sequence not shown for brevity. N-acetylglucosamine, blue squares; fucose, red triangles; mannose, green circles; galactose, yellow circles; sialic acid, purple diamonds.
FIG 4
FIG 4
Comparison of percent glycosylation of N-glycan sites for mammalian cell-expressed (HEK293) and insect cell-expressed (Sf9) sE2 glycoproteins. Most N-glycan sites are fully or nearly fully glycosylated, with the exception of N10 (N623) and N11 (N645), where N-glycan sites have relatively lower glycan occupancy for Sf9-derived eE2, whereas glycan N3 (N430) has lower glycan occupancy in HEK293 cells.
FIG 5
FIG 5
Modeled structural impact of glycosylation for HEK293- versus Sf9-expressed sE2. Structures of the most abundant glycoforms for HEK293 (A and C) and Sf9 (B and D) sE2 were modeled using Rosetta (52) onto the E2 core crystal structure (PDB ID 4MWF) (41). Glycans are shown as tan, slate, and yellow sticks and labeled, and E2 is shown as surface and cartoon, with views of E2 front layer (A and B) and back layer (C and D). For reference, neutralizing antibody footprints on E2 are colored blue, magenta, and green, based on the epitope-bound crystallographic structures of HC33.1 (PDB code 4XVJ), AR3C (PDB code 4MWF), and HC84.26.5D (PDB code 4Z0X) antibodies, respectively. Colored E2 residues indicate those within 5.0 Å of bound antibody, and shared E2 contact residues between antibodies are colored according to antibody with highest E2 residue burial. Residues from antigenic domain E were modeled at the N terminus of the E2 core structure using Rosetta (52). Glycan N5, which is within a region that is missing from the E2 core crystal structure, is not shown.
FIG 6
FIG 6
BLI analysis of CD81 and antibody binding to HCV sE2 from HEK293 and Sf9 expression systems. (A) Sensograms (left) for CD81 binding to immobilized HEK293-derived sE2. CD81 concentrations were 5,000, 4,000, 2,500, 2,000, 1,250, 1,000, 625, 500, 312.5, 250, 156.25, 125, 78.125, 62.5, and 39.06 nM. Steady-state analysis graph (right) gave a KD of 510 ± 22 nM. (B) Sensograms (right) for CD81 binding to immobilized Sf9-derived sE2. CD81 concentrations were 5,000, 4,000, 2,500, 2,000, 1,250, 1,000, 625, 500, 312.5, 250, 156.25, 125, 78.125, 62.5, and 39.06 nM. Steady-state analysis graph (right) gave a KD of 440 ± 38 nM. (C) Sensograms (left) for HC84.26 (domain D-specific HMAb) binding to immobilized HEK293-derived sE2. HC84.26 concentrations were 5, 2.5, 1.25, 0.625, 0.3125, and 0.156 nM. Steady-state analysis graph (right) gave a KD of 1.8 ± 0.5 nM. (D) Sensograms (left) for HC84.26 binding to immobilized Sf9-derived sE2. HC84.26 concentrations were 10, 5, 2.5, 0.625, 0.3125, and 0.156 nM. Steady-state analysis graph (right) gave a KD of 2.7 ± 0.8 nM. (E) Sensograms (left) for HC84.24 (domain D-specific HMAb) binding to immobilized HEK293-derived sE2. HC84.24 concentrations were 20, 15, 10, 7.5, 5, 3.75, 2.5, 1.875, 0.9375, 0.625, 0.469, 0.3125, 0.234, and 0.156 nM. Steady-state analysis graph (right) gave a KD of 1.9 ± 0.3 nM. (F) Sensograms (left) for HC84.24 binding to immobilized Sf9-derived sE2. HC84.24 concentrations were 1,000, 750, 500, 375, 250, 187.5, 125, 93.8, 62.5, 46.9, 31.6, and 23.4 nM. Steady-state analysis graph (right) gave a KD of 1,200 ± 290 nM. (G) Sensograms (left) for CBH-4B (domain A-specific HMAb) binding to immobilized HEK293-derived sE2. CBH-4B concentrations were 100, 50, 25, 12.5, 6.25, and 3.125 nM. Steady-state analysis graph (right) gave a KD of 11 ± 1.7 nM. (H) Sensograms (left) for CBH-4B binding to immobilized Sf9-derived sE2. CBH-4B concentrations were 50, 25, 12.5, 6.25, and 3.13 nM. Steady-state analysis graph (right) gave a KD of 120 ± 11 nM. (I) Sensograms (left) for HCV1 (domain E-specific HMAb) binding to immobilized HEK293-derived sE2. HCV1 concentrations were 200, 150, 100, 75, 50, 37.5, and 25 nM. Steady-state analysis graph (right) gave a KD of 36 ± 3.0 nM. (J) Sensograms (left) for HCV1 binding to immobilized Sf9-derived sE2. HCV1 concentrations were 25, 20, 15, 10, 5, 2.5, 1.25, and 0.078 nM. Steady-state analysis graph (right) gave a KD of 9.3 ± 2.0 nM. (K) Sensograms (left) for HC-1 (domain B-specific HMAb) binding to immobilized HEK293-derived sE2. HC-1 concentrations were 200, 175, 150, 75, 50, 37.5, 25, 12.5, 6.25, 3.125, 1.56, 0.78, 0.39, and 0.195 nM. Steady-state analysis graph (right) gave a KD of 65 ± 10 nM. (L) Sensograms (left) for HC-1 binding to immobilized Sf9-derived sE2. HC-1 concentrations were 200, 175, 150, 75, 50, 37.5, 25, 12.5, 6.25, 3.125, 1.56, 0.78, 0.39, and 0.195 nM. Steady-state analysis graph (right) gave a KD of 69 ± 6.5 nM.
FIG 7
FIG 7
Competition binding analysis of immune sera corresponding to domains A to E. (A) HEK293-derived sE2 immunized CD-1 mice. (B) Sf9-derived sE2 immunized CD-1 mice. Sera from day 42 were tested for binding competition using antibodies representing antigenic domains A to E (6), with mean percent competition shown with black bars. All values were normalized by subtracting percent competition values from control (preimmune) sera, which were measured individually for each mouse. Antibodies tested were CBH-4B (domain A), HC-1 (domain B), CBH-7 (domain C), HC84.26 (domain D), and HC33.4 (domain E).
FIG 8
FIG 8
Kinetics and magnitude of nAb titers against homologous H77 strain. HCV pseudoparticles (HCVpps) were generated by cotransfection of HEK293T cells with HCV E1E2, MLV Gag-Pol packaging vector, and luciferase reporter plasmid, as previously described (36). Titrations of HCVpp were performed on Hep3B cells, and luciferase activity measured in relative light units (RLUs) using SpectraMax M3. Percent neutralization was calculated as 100 × [1 − yRLUtest/RLUcontrol]. nAb titers in animal sera are reported as 50% inhibitory dilution (ID50) values, calculated using nonlinear curve fitting in GraphPad Prism. Neutralization kinetics were determined by inhibition of homologous HCVpp (H77) using serial dilutions of serum collected on days 28, 35, 42, and 49. Blue dots represent serum samples from HEK293 sE2-immunized mice, green dots represent samples from Sf9 sE2-immunized mice, and black bars indicate geometric means. One Sf9 E2-immunized mouse had insufficient day 35 serum available for testing; thus, four rather than five points are shown for that group and day. P values were determined using GraphPad Prism 7 with Kruskal-Wallis ANOVA, and significant P values between immunized groups are indicated (*, P < 0.05).
FIG 9
FIG 9
Breadth of neutralization against HCV genotypes 1 to 6. HCVpps generated with functional E1E2 clones derived from six diverse HCV genotypes, gt1a (H77c, UNKP1.1.1), gt1b (UNKP1.20.3, UNKP1.21.2), gt2a (J6, JFH), gt2b (UNKP2.4.1), gt2i (UNKP2.1.2), gt3 (UNKP3.2.2), gt4 (UNKP4.2.1), gt5 (UNKP5.1.1), and gt6 (UNKP6.1.1), were assessed for their neutralization sensitivity (50% neutralization titer [ID50]) to CD-1 mouse serum samples immunized with HEK293-derived sE2 (blue dots) and Sf9-derived sE2 (green dots), using HuH7 target cells. Geometric mean ID50 values are shown as black bars. P values were determined using GraphPad Prism 7 with Kruskal-Wallis ANOVA, and significant P values between immunized groups are indicated (*, P < 0.05).

Similar articles

Cited by

References

    1. Liang TJ, Ghany MG. 2013. Current and future therapies for hepatitis C virus infection. N Engl J Med 368:1907–1917. doi:10.1056/NEJMra1213651. - DOI - PMC - PubMed
    1. González-Grande R, Jiménez-Pérez M, González Arjona C, Mostazo Torres J. 2016. New approaches in the treatment of hepatitis C. World J Gastroenterol 22:1421–1423. doi:10.3748/wjg.v22.i4.1421. - DOI - PMC - PubMed
    1. Cox A. 2015. Medicine. Global control of hepatitis C virus. Science 349:790–791. doi:10.1126/science.aad1302. - DOI - PubMed
    1. Osburn WO, Snider AE, Wells BL, Latanich R, Bailey JR, Thomas DL, Cox AL, Ray SC. 2014. Clearance of hepatitis C infection is associated with the early appearance of broad neutralizing antibody responses. Hepatology 59:2140–2151. doi:10.1002/hep.27013. - DOI - PMC - PubMed
    1. Pestka JM, Zeisel MB, Bläser E, Schürmann P, Bartosch B, Cosset FL, Patel AH, Meisel H, Baumert J, Viazov S, Rispeter K, Blum HE, Roggendorf M, Baumert TF. 2007. Rapid induction of virus-neutralizing antibodies and viral clearance in a single-source outbreak of hepatitis C. Proc Natl Acad Sci U S A 104:6025–6030. doi:10.1073/pnas.0607026104. - DOI - PMC - PubMed

Publication types

MeSH terms