. 2019 Mar 21;93(7):e02098-18.
doi: 10.1128/JVI.02098-18. Print 2019 Apr 1.

Equine Herpesvirus 1 Bridles T Lymphocytes To Reach Its Target Organs

Affiliations

Equine Herpesvirus 1 Bridles T Lymphocytes To Reach Its Target Organs

Katrien C K Poelaert et al. J Virol. .

Abstract

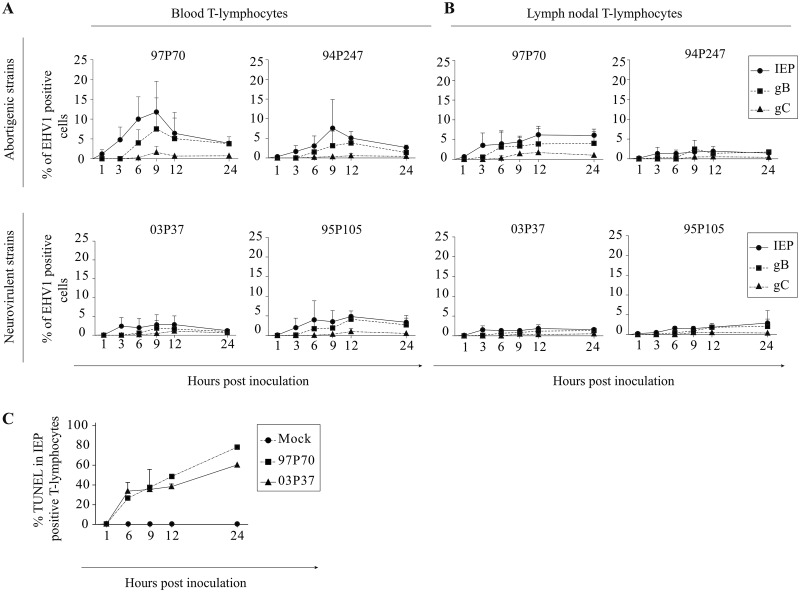
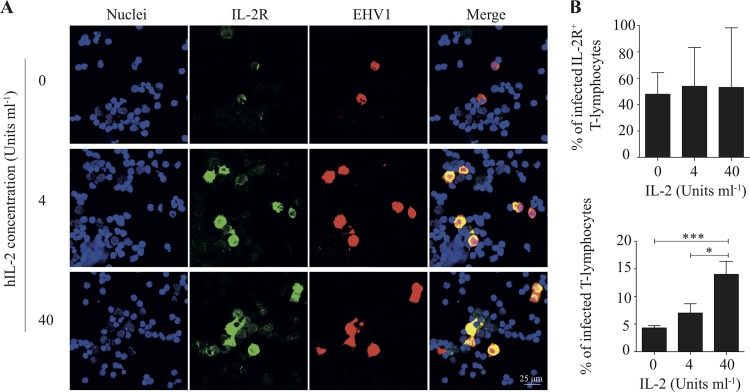
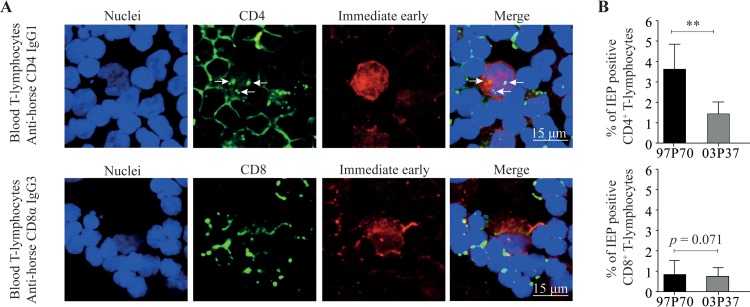
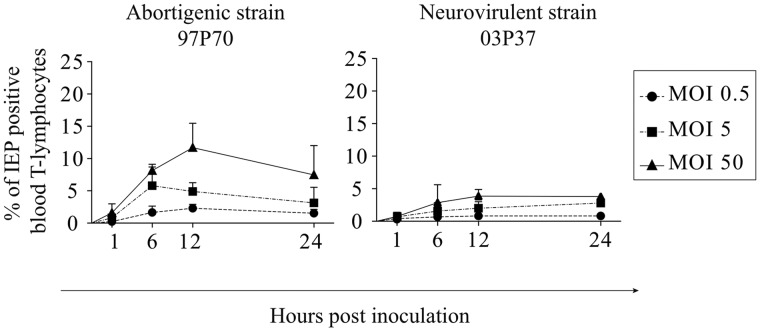
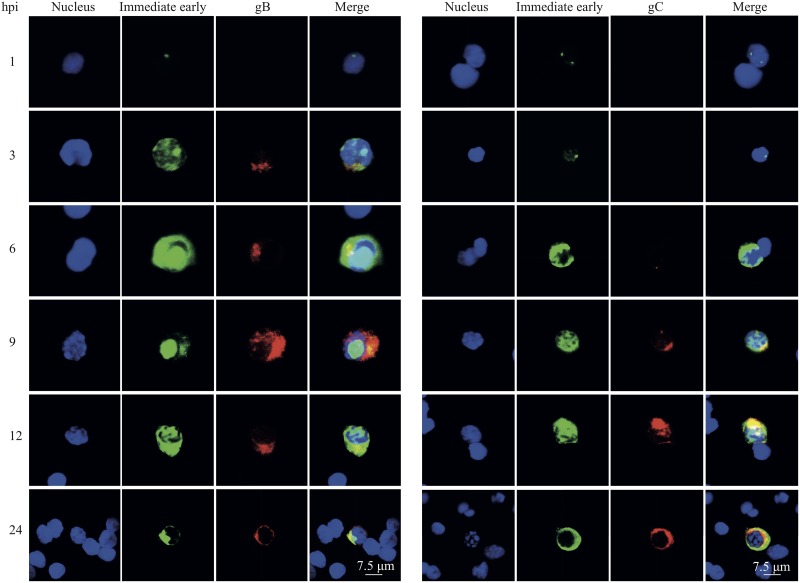
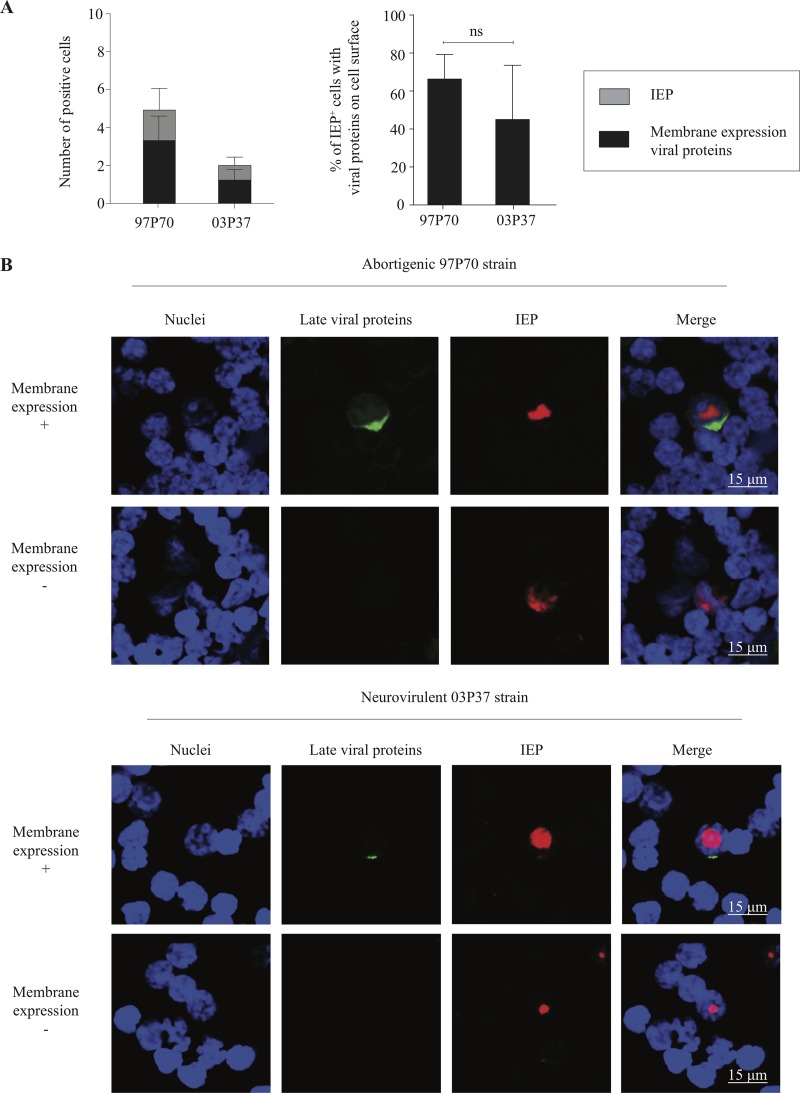
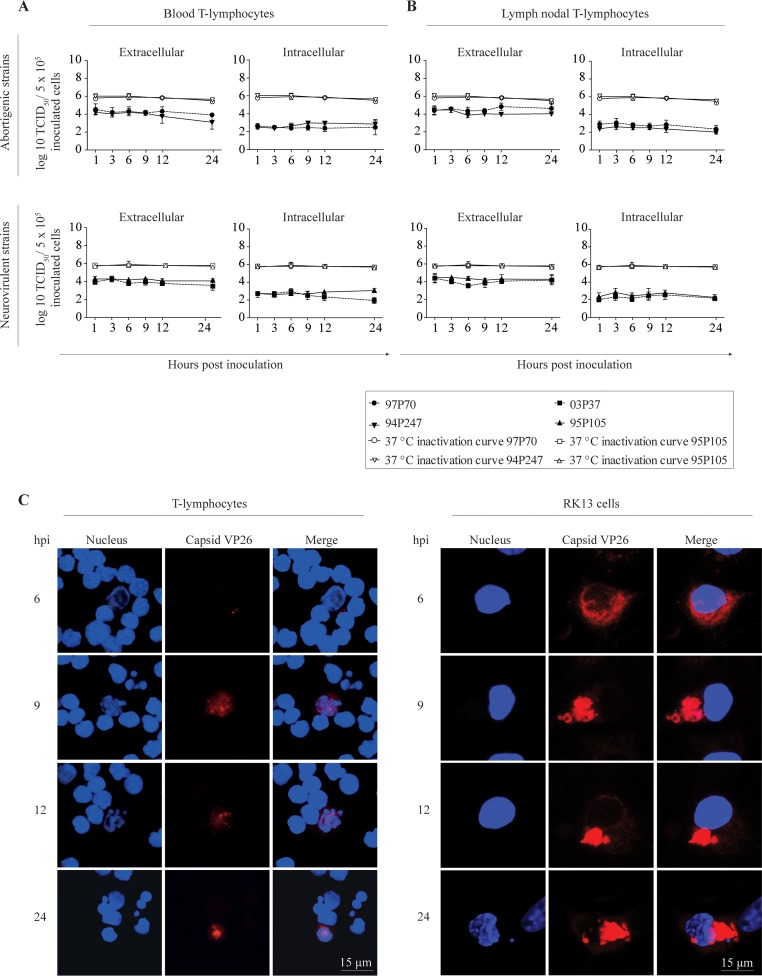
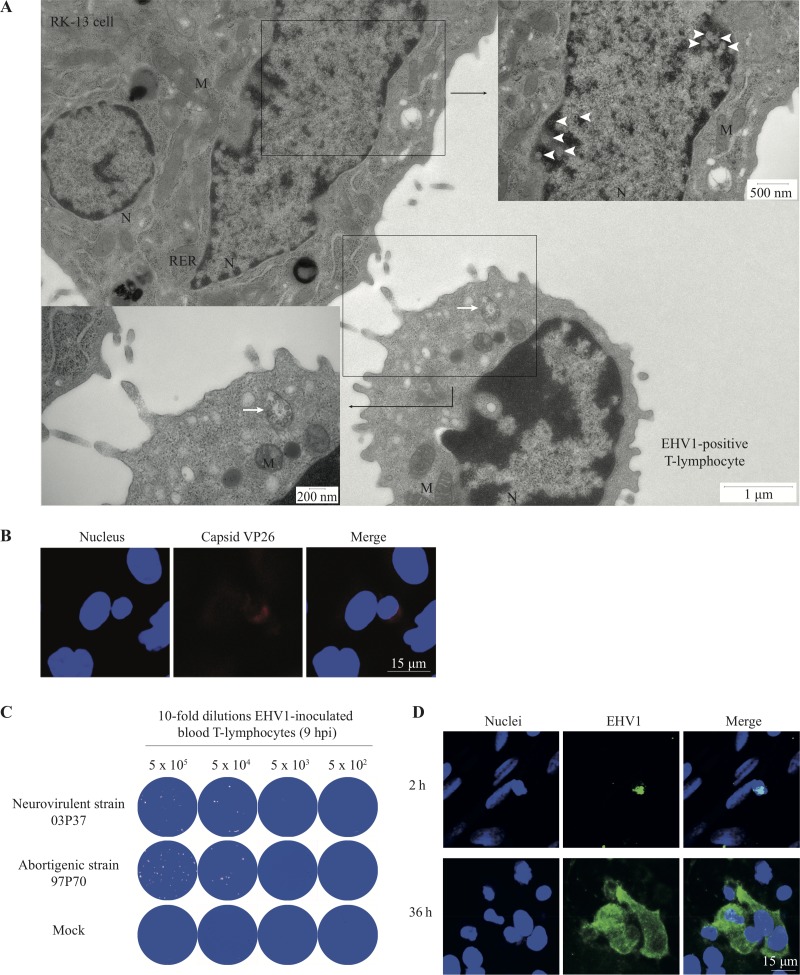
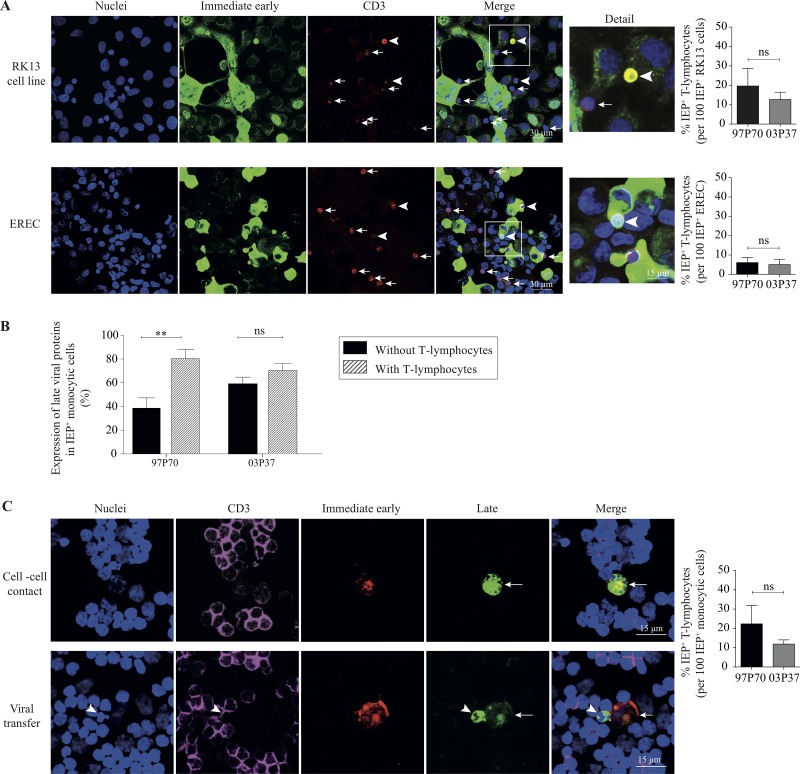
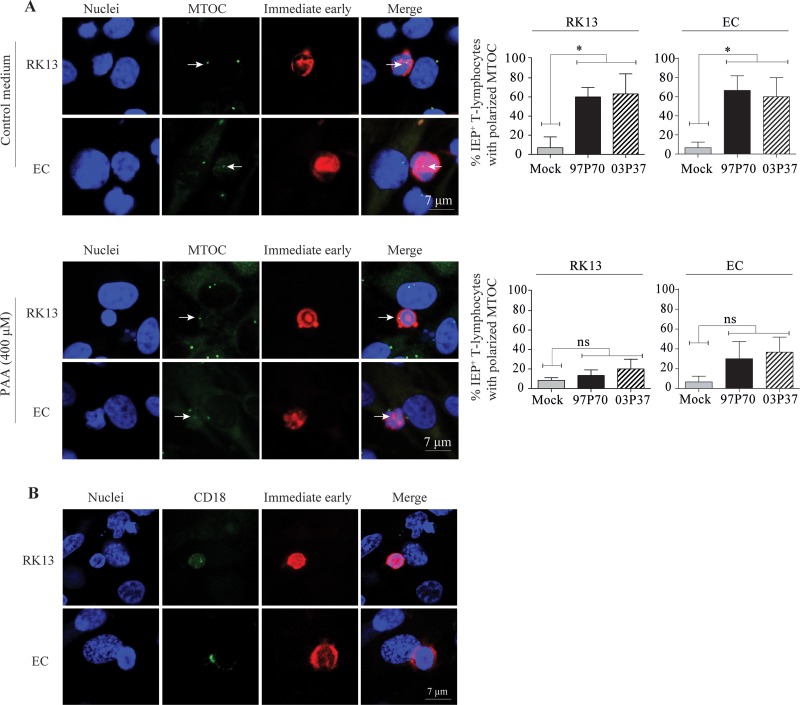
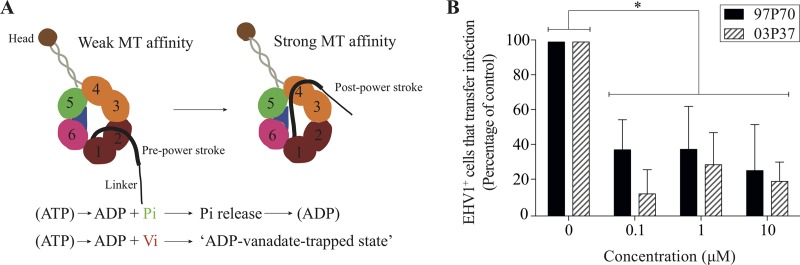
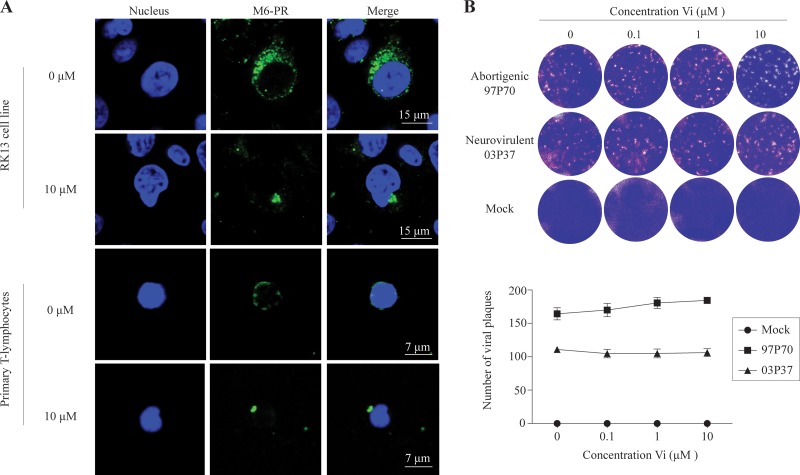
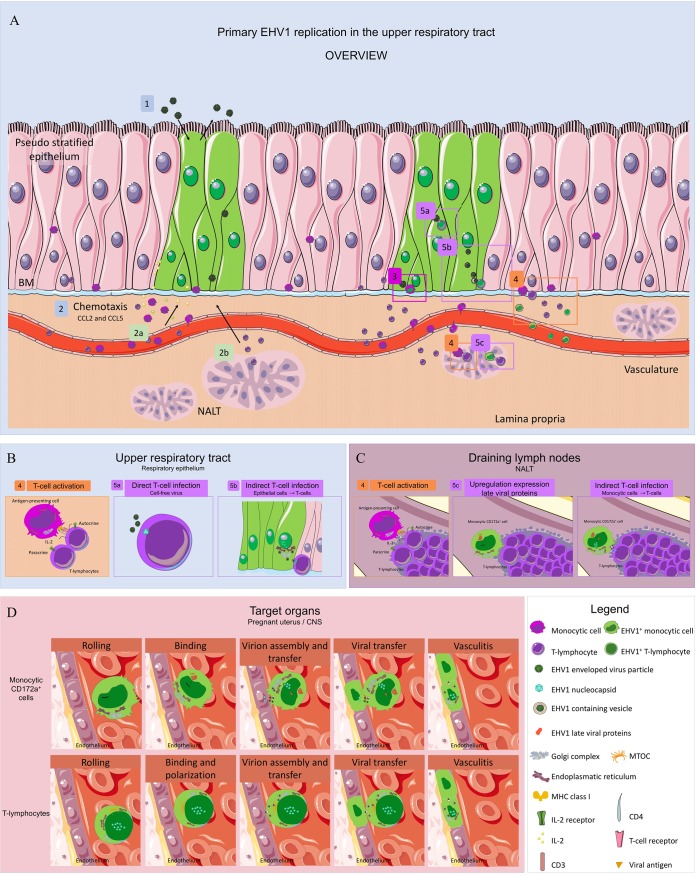
Equine herpesvirus 1 (EHV1) replicates in the respiratory epithelium and disseminates through the body via a cell-associated viremia in leukocytes, despite the presence of neutralizing antibodies. "Hijacked" leukocytes, previously identified as monocytic cells and T lymphocytes, transmit EHV1 to endothelial cells of the endometrium or central nervous system, causing reproductive (abortigenic variants) or neurological (neurological variants) disorders. In the present study, we questioned the potential route of EHV1 infection of T lymphocytes and how EHV1 misuses T lymphocytes as a vehicle to reach the endothelium of the target organs in the absence or presence of immune surveillance. Viral replication was evaluated in activated and quiescent primary T lymphocytes, and the results demonstrated increased infection of activated versus quiescent, CD4+ versus CD8+, and blood- versus lymph node-derived T cells. Moreover, primarily infected respiratory epithelial cells and circulating monocytic cells efficiently transferred virions to T lymphocytes in the presence of neutralizing antibodies. Albeit T-lymphocytes express all classes of viral proteins early in infection, the expression of viral glycoproteins on their cell surface was restricted. In addition, the release of viral progeny was hampered, resulting in the accumulation of viral nucleocapsids in the T cell nucleus. During contact of infected T lymphocytes with endothelial cells, a late viral protein(s) orchestrates T cell polarization and synapse formation, followed by anterograde dynein-mediated transport and transfer of viral progeny to the engaged cell. This represents a sophisticated but efficient immune evasion strategy to allow transfer of progeny virus from T lymphocytes to adjacent target cells. These results demonstrate that T lymphocytes are susceptible to EHV1 infection and that cell-cell contact transmits infectious virus to and from T lymphocytes.IMPORTANCE Equine herpesvirus 1 (EHV1) is an ancestral alphaherpesvirus that is related to herpes simplex virus 1 and causes respiratory, reproductive, and neurological disorders in Equidae. EHV1 is indisputably a master at exploiting leukocytes to reach its target organs, accordingly evading the host immunity. However, the role of T lymphocytes in cell-associated viremia remains poorly understood. Here we show that activated T lymphocytes efficiently become infected and support viral replication despite the presence of protective immunity. We demonstrate a restricted expression of viral proteins on the surfaces of infected T cells, which prevents immune recognition. In addition, we indicate a hampered release of progeny, which results in the accumulation of nucleocapsids in the T cell nucleus. Upon engagement with the target endothelium, late viral proteins orchestrate viral synapse formation and viral transfer to the contact cell. Our findings have significant implications for the understanding of EHV1 pathogenesis, which is essential for developing innovative therapies to prevent the devastating clinical symptoms of infection.

Keywords: Equidae; T lymphocytes; equine herpesvirus; immune evasion.


Figures

FIG 1
FIG 1
Replication kinetics of abortigenic (upper panels) and neurovirulent (lower panels) EHV1 variants in (A) blood-derived and (B) lymph node-derived T lymphocytes. The expression of immediate early proteins (IEP), leaky late glycoprotein B (gB) proteins, and real late glycoprotein C (gC) proteins was analyzed by immunofluorescence staining. (C) Cell viability of EHV1-infected cells was examined by double immunofluorescence staining by analyzing double IEP- and TUNEL-positive cells. Data represent means plus SD for three independent experiments.
FIG 2
FIG 2
Recombinant interleukin-2 (IL-2) enhances T-lymphocyte infectivity. Primary T lymphocytes were stimulated overnight with 0, 4, or 40 U ml−1 of IL-2. (A) T cell activation was confirmed by double immunofluorescence staining. The IL-2 receptor (IL-2R) was stained green, and the EHV1 proteins were stained red. Nuclei were counterstained blue (Hoechst dye). (B) (Top) Upon overnight IL-2 stimulation and mock/EHV1 inoculation, the percentage of IL-2R expression was calculated and graphed. (Bottom) Overnight IL-2 stimulation of T lymphocytes increased the percentage of EHV1-positive T lymphocytes in a concentration-dependent manner. Data represent means plus SD for three independent experiments. *, P < 0.05; ***, P < 0.001.
FIG 3
FIG 3
CD4+ and CD8+ subsets of T lymphocytes become infected with EHV1. Both T cell subsets were isolated by positive MACS separation and inoculated with the 97P70 or 03P37 EHV1 strain. (A) At 9 hpi, cells were collected and then subjected to double immunofluorescence staining for the CD4/CD8 cell marker (green) and viral IEP (red). Nuclei were counterstained blue (Hoechst dye). Arrows indicate clustered CD4. (B) Percentages of IEP-positive CD4+ and CD8+ T lymphocytes. All experiments were performed with blood-derived T lymphocytes from three different horses. Data represent means plus SD.
FIG 4
FIG 4
Multiplicity of infection affects the percentage of EHV1+ T lymphocytes. Blood T lymphocytes were inoculated at an MOI of 0.5, 5, or 50 with the abortigenic 97P70 (left panel) or neurovirulent 03P37 (right panel) EHV1 strain. Percentages of IEP-positive T cells are shown. Data represent means plus SD for experiments performed in triplicate.
FIG 5
FIG 5
Spatiotemporal distribution of immediate early protein (IEP), leaky late glycoprotein B (gB) (left panel), and real late glycoprotein C (gC) (right panel) in blood-derived T lymphocytes. IEP was stained green, and gB and gC were visualized in red. Nuclei were counterstained blue (Hoechst dye).
FIG 6
FIG 6
Viral glycoproteins are expressed on the plasma membrane for the majority of infected T lymphocytes. (A) T lymphocytes inoculated with the abortigenic 97P70 or neurovirulent 03P37 EHV1 strain were fixed at 9 hpi. Membrane expression of viral glycoproteins and the expression of IEP were analyzed. (B) Double immunofluorescence staining of viral glycoproteins on the cell surface (green) and of IEP (red). Nuclei were counterstained blue (Hoechst dye). Data represent means plus SD for three independent experiments. ns, no statistically significant differences.
FIG 7
FIG 7
Kinetics of EHV1 production in blood (A) and lymph nodal (B) T lymphocytes. The upper panels show the abortigenic EHV1 variants (97P70 and 94P247), and the lower panels show the neurovirulent EHV1 variants (03P37 and 95P105). Data represent means plus SD for three independent experiments. (C) The spatiotemporal distribution of viral nucleocapsids in blood T lymphocytes is shown in red. Nuclei were counterstained blue (Hoechst dye).
FIG 8
FIG 8
EHV1-infected T lymphocytes release nucleocapsids from the nucleus and transfer infection to an adjacent target cell. (A) Transmission electron micrographs of close cell-cell contacts between an EHV1-positive T lymphocyte and an RK13 cell. The arrow indicates the anterograde transport of EHV1 nucleocapsids budded into cellular vesicles toward the site of cell-cell contact. The arrowheads indicate viral nucleocapsids at the nucleus of the engaged RK13 cell. N, nucleus; M, mitochondria; RER, rough endoplasmic reticulum. (B) Contact between an EHV1-positive T lymphocyte and an RK13 cell activates the release of entrapped red-labeled nucleocapsids in the T cell nucleus. (C) Representative images of EHV1 plaques in crystal violet-stained RK13 cell monolayers after cocultivation with a 10-fold dilution of EHV1-inoculated T lymphocytes. (D) Representative confocal images of cocultivated EHV1-inoculated T lymphocytes and equine venous endothelial cells at 2 h and 36 h of cocultivation. EHV1 proteins are stained green. Nuclei are counterstained blue (Hoechst dye).
FIG 9
FIG 9
Cell-cell transfer facilitates efficient EHV1 infection of T lymphocytes. (A) RK13 cells (upper panels) and EREC (lower panels) were inoculated with the abortigenic (97P70) or neurovirulent (03P37) EHV1 variant. At 12 (RK13 cells) or 24 (EREC) hpi, cells were cocultured with primary T lymphocytes in the presence of neutralizing antibodies. After 2 h of cocultivation, RK13 cells, EREC, and adherent T cells were fixed with methanol. IEP and the CD3 T cell marker were visualized in green and red, respectively. Nuclei were counterstained blue (Hoechst dye). Arrows indicate adherent T lymphocytes, and arrowheads indicate EHV1-positive T cells. The right panels show the number of IEP-positive T lymphocytes per 100 EHV1-positive RK13 cells or EREC. (B) Expression of EHV1 late proteins in infected monocytic CD172a+ cells after 24 h of coculture with primary T lymphocytes. (C) Confocal images of cocultures of monocytic cells and T lymphocytes are shown in the left panels. Triple immunofluorescence staining of the CD3 T cell marker (purple), IEP (red), and late viral proteins (green) was performed to analyze the expression of late viral proteins upon cell-cell contact and the viral transfer between EHV1-infected monocytic cells and T lymphocytes. Nuclei were counterstained blue (Hoechst dye). The graph on the right represents the number of IEP-positive T lymphocytes per 100 EHV1-positive monocytic cells. All experiments were performed with blood-derived T lymphocytes from three different horses. Data represent means plus SD. **, P < 0.01; ns, no statistically significant differences.
FIG 10
FIG 10
EHV1 misuses the regulated secretory pathway of T lymphocytes to promote its egress. (A) The graph in the upper panel shows enhanced MTOC polarization toward the site of contact with an RK13 cell or EC upon EHV1 infection. Blocking the transcription of late viral proteins with phosphonoacetic acid (PAA) significantly reduced the MTOC polarization (graph in lower panel). Representative confocal images are shown in the left panels. MTOC is stained green, and immediate early proteins (IEP) are stained red. Nuclei are counterstained blue (Hoechst dye). Arrows indicate the MTOC of the infected T lymphocytes. (B) Active LFA1 (CD18) is enriched at the site of contact between EHV1-infected T lymphocytes and RK13 cells or EC. LFA1 is stained green, and IEP is stained red. Nuclei are counterstained blue (Hoechst dye).
FIG 11
FIG 11
Viral antigens hijack the dynein motors to transport viral progeny to the viral synapse. (A) Effects of vanadate (Vi) on the activity of the dynein motor. Hexameric rings linked into one large polypeptide form the core of the dynein motor. The transitions between the pre- and post-power-stroke states are dependent on the highly coordinated interactions between the structural components of the dynein head. Upon ATP binding, the dynein head releases the microtubule (MT) and accelerates hydrolysis of ATP to ADP + Pi. This results in the conformational changes of the linker into the pre-power stroke. Once Pi is released, the stalk resumes its high-affinity conformation that locks the dynein head onto the MT. The linker swings from its pre-power-stroke position (AAA2) to the post-power-stroke position (AAA4) when ADP is released. Vi replaces Pi in the dynein-ADP-Pi complex, resulting in a covalent ADP entrapment and a dead-end kinetic block of the ATPase of the dynein motor. (B) At 9 hpi, EHV1-inoculated T cells were washed with citrate buffer, followed by 1 h of treatment with 0, 0.1, 1, or 10 μM Vi prior to cocultivation with RK13 cells. After 48 h of cocultivation, the plaques were fixed and stained with crystal violet. For each condition, viral plaques were counted and graphed as percentages of the control level. Data represent means plus SD for three independent experiments. *, P < 0.05.
FIG 12
FIG 12
Inorganic vanadate (Vi) disrupts the cellular dynein motors but does not interfere with viral replication. (A) Expression of mannose 6-phosphate receptor (M6-PR) in mock- or Vi-treated RK13 cells or equine T lymphocytes. For mock-treated cells, a scattered expression pattern of M6-PR (green) was observed. Upon treatment with 10 μM Vi, M6-PR clustered in the juxtanuclear region. Nuclei were counterstained blue (Hoechst dye). (B) (Top) A viral plaque assay with RK13 cells, cell-free virus, and different concentrations of Vi was carried out, and plaques were visualized by crystal violet staining. (Bottom) Numbers of viral plaques. Data represent means ± SD for three independent experiments performed in triplicate.
FIG 13
FIG 13
Hypothetical model of EHV1 infection of T lymphocytes. (A) (1) During primary EHV1 replication in the URT, (2) monocytic cells and T lymphocytes are attracted to the site of infection. (3) Extravasated monocytic cells become infected by cell-free virus at the URT. (B and C) (4) Patrolling monocytes and dendritic cells present viral antigen to T lymphocytes at the level of the URT or draining lymph nodes, resulting in T cell activation (5). Activated T lymphocytes become efficiently infected either directly by cell-free virus (5a) or indirectly by cell-to-cell transfer (5b and 5c). (D) Once infected, monocytic cells and T lymphocytes migrate to the target organs. Upon binding to the target endothelium, viral replication in monocytic cells is again activated. Progeny virus is assembled and transferred to the endothelium. On binding of infected T lymphocytes to target endothelium, a late viral protein(s) orchestrates T cell polarization, viral assembly, and transfer to the adjacent endothelium. Infection of the endothelium ultimately results in vasculitis.

Similar articles

Cited by

References

    1. Roizman B. 1996. Herpesviridae, p 2221–2230. In Fields BN, Knipe DM, Howley PM (ed), Fields virology, 3rd ed Lippincott-Raven Publishers; Philadelphia, PA.
    1. Karlin S, Mocarski ES, Schachtel GA. 1994. Molecular evolution of herpesviruses: genomic and protein sequence comparisons. J Virol 68:1886–1902. - PMC - PubMed
    1. Lunn DP, Davis-Poynter N, Flaminio MJBF, Horohov DW, Osterrieder K, Pusterla N, Townsend HG. 2009. Equine herpesvirus-1 consensus statement. J Vet Intern Med 23:450–461. doi:10.1111/j.1939-1676.2009.0304.x. - DOI - PubMed
    1. Edington N, Welch HM, Griffiths L. 1994. The prevalence of latent equid herpesviruses in the tissues of 40 abattoir horses. Equine Vet J 26:140–142. doi:10.1111/j.2042-3306.1994.tb04353.x. - DOI - PubMed
    1. Allen G, Kydd J, Slater J, Smith K. 2004. Equid herpesvirus-1 (EHV-1) and -4 (EHV-4) infections, p 829–859. In Coetzer J, Tustin R (ed), Infectious diseases of livestock, 2nd ed Oxford Press; Cape Town, South Africa.

Publication types

MeSH terms