

miRNA-mRNA crosstalk in myocardial ischemia induced by calcified aortic valve stenosis
- PMID: 30651404
- PMCID: PMC6366972
- DOI: 10.18632/aging.101751
miRNA-mRNA crosstalk in myocardial ischemia induced by calcified aortic valve stenosis
Abstract
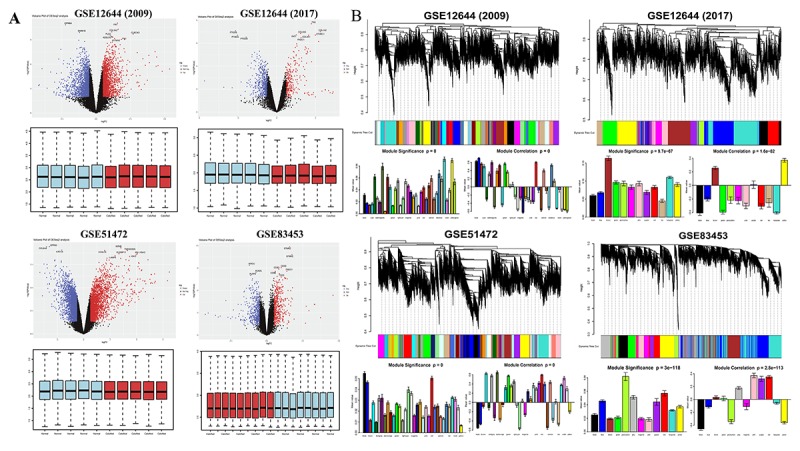
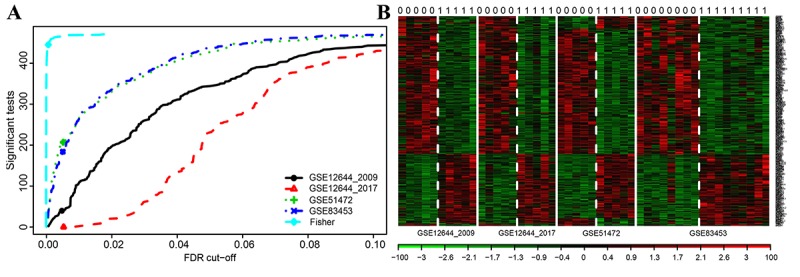
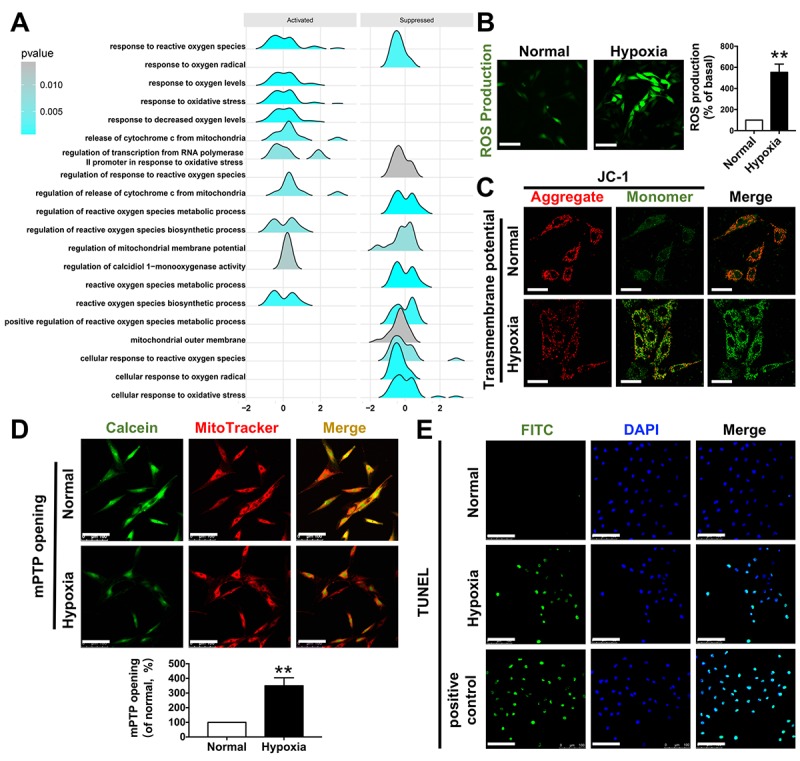
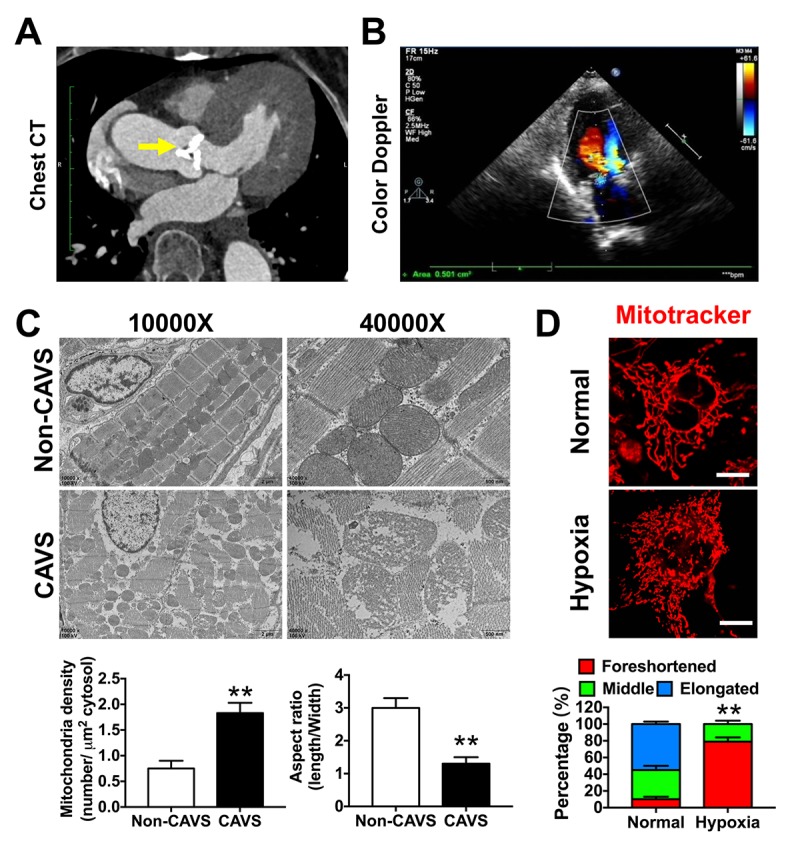
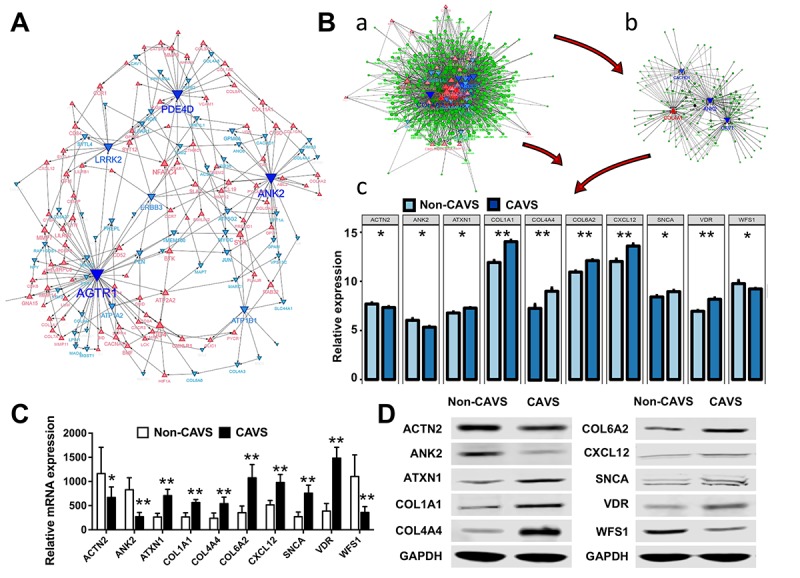
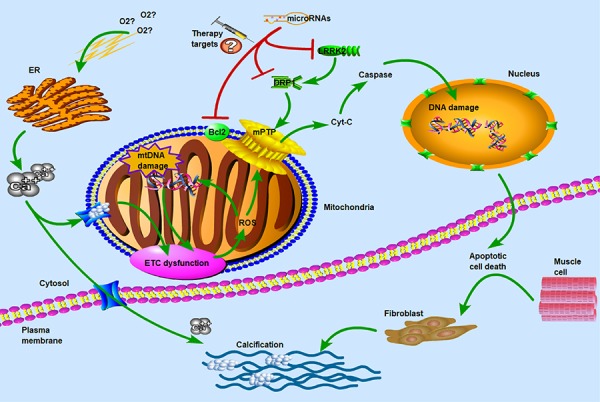
Aortic valve stenosis is the most common cause of morbidity and mortality in valvular heart disease in aged people. Both microRNA (miRNA) and mRNA are potential targets for the diagnosis and therapeutic intervention of myocardial ischemia induced by calcified aortic valve stenosis (CAVS), with unclear mechanisms. Here, 3 gene expression profiles of 47 male participants were applied to generate shared differentially expressed genes (DEGs) with significant major biological functions. Moreover, 20 hub genes were generated by a Weighted Genes Co-Expression Network Analysis (WGCNA) and were cross-linked to miRNA based on miRanda/miRwalk2 databases. Integrated miRNA/mRNA analysis identified several novel miRNAs and targeted genes as diagnostic/prognostic biomarkers or therapeutic targets in CAVS patients. In addition, the clinical data suggested that myocardial hypertrophy and myocardial ischemia in CAVS patients are likely associated with hub genes and the upstream regulatory miRNAs. Together, our data provide evidence that miRNAs and their targeted genes play an important role in the pathogenesis of myocardial hypertrophy and ischemia in patients with CAVS.
Keywords: calcified aortic valve stenosis (CAVS); hub genes; miRNA-mRNA crosstalk; mitochondrial dysfunction; myocardial ischemia.
Conflict of interest statement
Figures
Similar articles
-
RNA-sequencing of human aortic valves identifies that miR-629-3p and TAGLN miRNA-mRNA pair involving in calcified aortic valve disease.J Physiol Biochem. 2022 Nov;78(4):819-831. doi: 10.1007/s13105-022-00905-5. Epub 2022 Jul 1. J Physiol Biochem. 2022. PMID: 35776288
-
Functional SNP in the 3'UTR of PON1 is Associated with the Risk of Calcific Aortic Valve Stenosis via MiR-616.Cell Physiol Biochem. 2018;45(4):1390-1398. doi: 10.1159/000487565. Epub 2018 Feb 15. Cell Physiol Biochem. 2018. PMID: 29462797
-
Upregulated Autophagy in Calcific Aortic Valve Stenosis Confers Protection of Valvular Interstitial Cells.Int J Mol Sci. 2019 Mar 25;20(6):1486. doi: 10.3390/ijms20061486. Int J Mol Sci. 2019. PMID: 30934548 Free PMC article.
-
PALMD as a novel target for calcific aortic valve stenosis.Curr Opin Cardiol. 2019 Mar;34(2):105-111. doi: 10.1097/HCO.0000000000000605. Curr Opin Cardiol. 2019. PMID: 30608251 Review.
-
Calcific aortic valve stenosis: methods, models, and mechanisms.Circ Res. 2011 May 27;108(11):1392-412. doi: 10.1161/CIRCRESAHA.110.234138. Circ Res. 2011. PMID: 21617136 Free PMC article. Review.
Cited by
-
Activated Drp1 regulates p62-mediated autophagic flux and aggravates inflammation in cerebral ischemia-reperfusion via the ROS-RIP1/RIP3-exosome axis.Mil Med Res. 2022 May 27;9(1):25. doi: 10.1186/s40779-022-00383-2. Mil Med Res. 2022. PMID: 35624495 Free PMC article.
-
MicroRNA-520d-3p alleviates hypoxia/reoxygenation-induced damage in human cardiomyocytes by targeting ATG-12.J Thromb Thrombolysis. 2021 Aug;52(2):429-439. doi: 10.1007/s11239-020-02352-9. Epub 2021 Jan 2. J Thromb Thrombolysis. 2021. PMID: 33389611
-
Multi-Omics Approaches to Define Calcific Aortic Valve Disease Pathogenesis.Circ Res. 2021 Apr 30;128(9):1371-1397. doi: 10.1161/CIRCRESAHA.120.317979. Epub 2021 Apr 29. Circ Res. 2021. PMID: 33914608 Free PMC article. Review.
-
Identification of MMP9 as a Novel Biomarker to Mitochondrial Metabolism Disorder and Oxidative Stress in Calcific Aortic Valve Stenosis.Oxid Med Cell Longev. 2022 Sep 24;2022:3858871. doi: 10.1155/2022/3858871. eCollection 2022. Oxid Med Cell Longev. 2022. Retraction in: Oxid Med Cell Longev. 2023 Dec 29;2023:9831674. doi: 10.1155/2023/9831674. PMID: 36199424 Free PMC article. Retracted.
-
Mdivi-1 attenuates oxidative stress and exerts vascular protection in ischemic/hypoxic injury by a mechanism independent of Drp1 GTPase activity.Redox Biol. 2020 Oct;37:101706. doi: 10.1016/j.redox.2020.101706. Epub 2020 Aug 29. Redox Biol. 2020. PMID: 32911435 Free PMC article.
References
-
- Chan KL, Teo K, Dumesnil JG, Ni A, Tam J, and ASTRONOMER Investigators. Effect of Lipid lowering with rosuvastatin on progression of aortic stenosis: results of the aortic stenosis progression observation: measuring effects of rosuvastatin (ASTRONOMER) trial. Circulation. 2010; 121:306–14. 10.1161/CIRCULATIONAHA.109.900027 - DOI - PubMed
-
- Rossebø AB, Pedersen TR, Boman K, Brudi P, Chambers JB, Egstrup K, Gerdts E, Gohlke-Bärwolf C, Holme I, Kesäniemi YA, Malbecq W, Nienaber CA, Ray S, et al., and SEAS Investigators. Intensive lipid lowering with simvastatin and ezetimibe in aortic stenosis. N Engl J Med. 2008; 359:1343–56. 10.1056/NEJMoa0804602 - DOI - PubMed
Publication types
MeSH terms
Substances
LinkOut - more resources
Full Text Sources
