Clinical Trial
. 2019 Jan 16;10(1):244.
doi: 10.1038/s41467-018-08263-x.

Clinical resistance to crenolanib in acute myeloid leukemia due to diverse molecular mechanisms

Affiliations
Clinical Trial

Clinical resistance to crenolanib in acute myeloid leukemia due to diverse molecular mechanisms

Haijiao Zhang et al. Nat Commun. .

Abstract

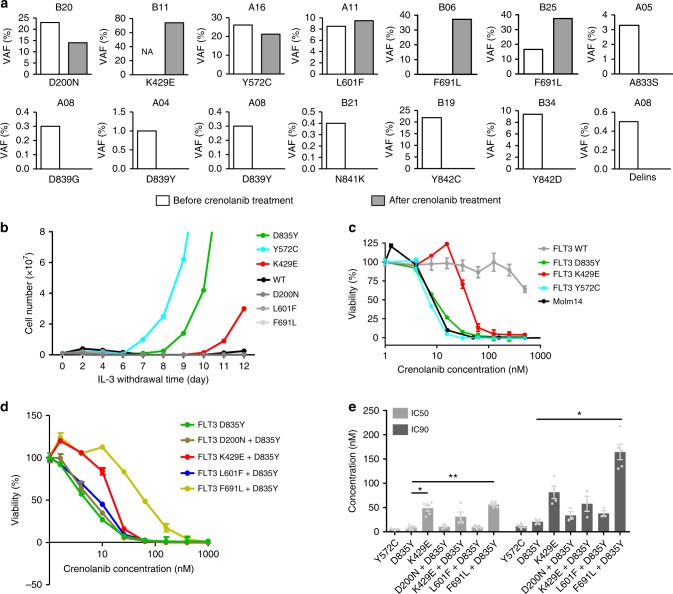
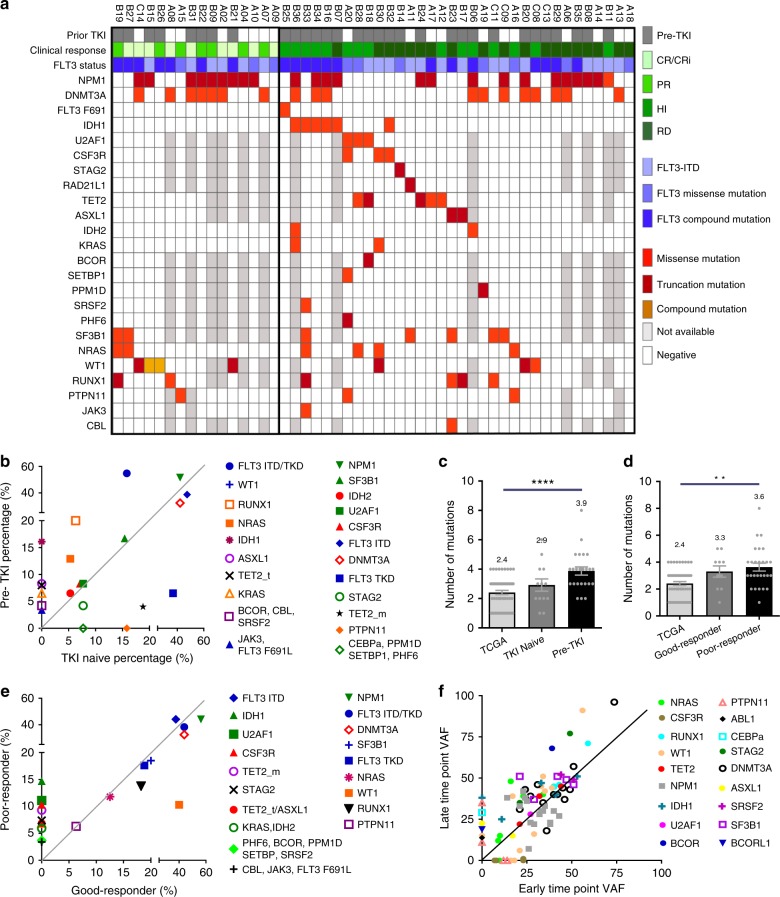
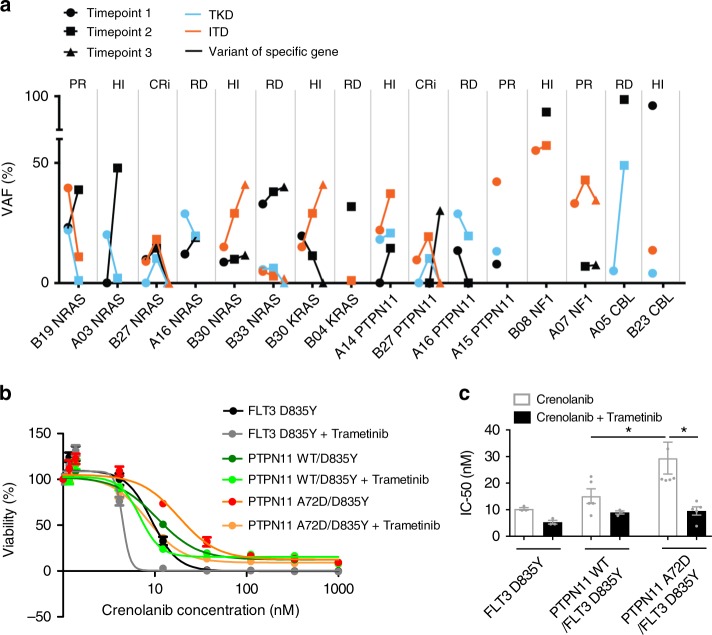
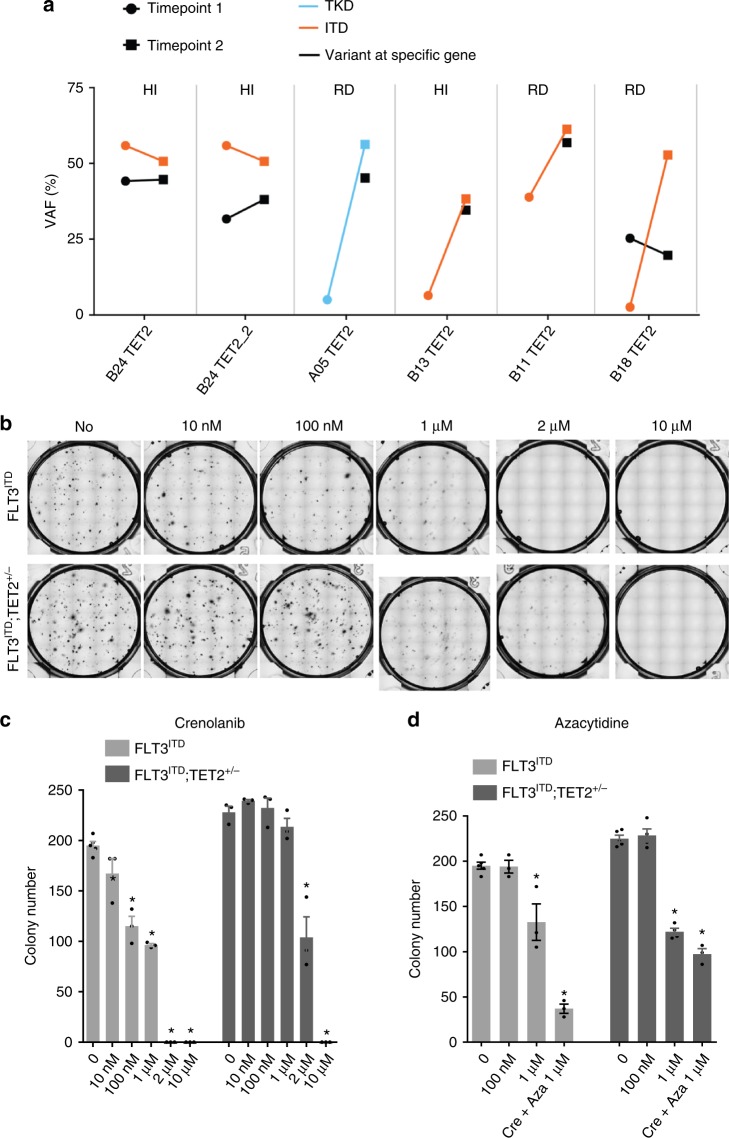
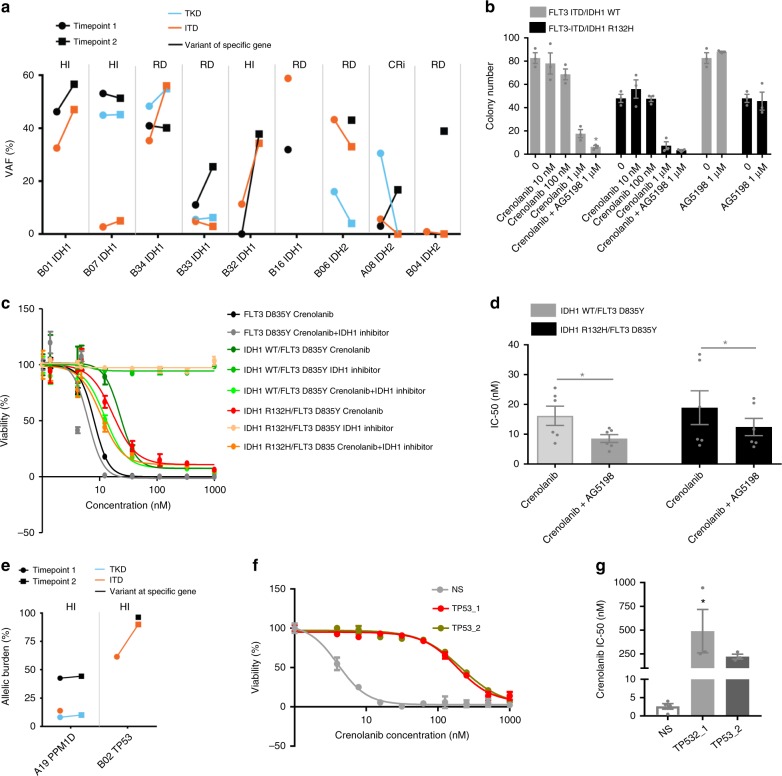
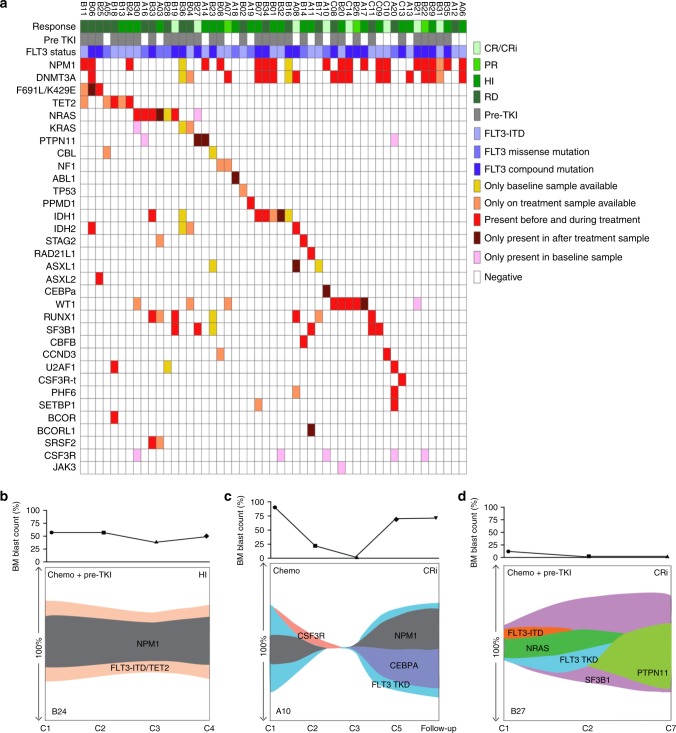
FLT3 mutations are prevalent in AML patients and confer poor prognosis. Crenolanib, a potent type I pan-FLT3 inhibitor, is effective against both internal tandem duplications and resistance-conferring tyrosine kinase domain mutations. While crenolanib monotherapy has demonstrated clinical benefit in heavily pretreated relapsed/refractory AML patients, responses are transient and relapse eventually occurs. Here, to investigate the mechanisms of crenolanib resistance, we perform whole exome sequencing of AML patient samples before and after crenolanib treatment. Unlike other FLT3 inhibitors, crenolanib does not induce FLT3 secondary mutations, and mutations of the FLT3 gatekeeper residue are infrequent. Instead, mutations of NRAS and IDH2 arise, mostly as FLT3-independent subclones, while TET2 and IDH1 predominantly co-occur with FLT3-mutant clones and are enriched in crenolanib poor-responders. The remaining patients exhibit post-crenolanib expansion of mutations associated with epigenetic regulators, transcription factors, and cohesion factors, suggesting diverse genetic/epigenetic mechanisms of crenolanib resistance. Drug combinations in experimental models restore crenolanib sensitivity.


Conflict of interest statement

Research support for J.W.T. is received from Aptose, Array, AstraZeneca, Constellation, Genentech, Gilead, Incyte, Janssen, Seattle Genetics, Syros, Takeda; co-founder of Vivid Biosciences. B.J.D. potential competing interests-- Scientific Advisory Board: Aileron Therapeutics, ALLCRON, Cepheid, Gilead Sciences, Vivid Biosciences, Celgene & Baxalta (inactive); SAB & Stock: Aptose Biosciences, Blueprint Medicines, Beta Cat, GRAIL, Third Coast Therapeutics, CTI BioPharma (inactive); Scientific Founder & Stock: MolecularMD; Board of Directors & Stock: Amgen; Board of Directors: Burroughs Wellcome Fund, CureOne; Joint Steering Committee: Beat AML LLS; Clinical Trial Funding: Novartis, Bristol-Myers Squibb, Pfizer; Royalties from Patent 6958335 (Novartis exclusive license) and OHSU and Dana-Farber Cancer Institute (one Merck exclusive license) H.H., Y.L.L., R.S., C.F. and V.J. are employees of AROG Pharmaceuticals. The remaining authors declare no competing interests.

Figures

Fig. 1
Fig. 1
FMS-like tyrosine kinase 3 (FLT3) K429E demonstrates reduced crenolanib sensitivity. a Variant allele frequency (VAF) of non-D835 FLT3 mutations during crenolanib treatment. Low VAFs of FLT3 A833S, D839Y/G, N841K, Y842C/D and delIns were detected at baseline, and these mutation clones were eliminated during the course of crenolanib treatment. FLT3 F691L mutations were detected in two patients previously treated with quizartinib. Four FLT3 mutations (D200N, K429E, Y572C and L601F) were identified at the time of treatment termination in four individual patients. DelIns: R834D835I836 (RDI–−>RP). b FLT3 K429E transforms Ba/F3 cells. Ba/F3 cells expressing empty vector, FLT3 wild-type (WT) and mutants were grown in medium without interleukin-3 (IL-3) and cells were counted every other day for 12 days. c, d Ba/F3 cells expressing FLT3 K429E and FLT3 K429E/D835Y demonstrate reduced crenolanib sensitivity. Graphs depict mean ± SEM of cell viabilities of Ba/F3 cells expressing empty vector, FLT3 WT or mutants treated with dose gradients of crenolanib for 72 h determined by MTS. e Mean ± SEM of crenolanib half-maximal inhibitory concentration (IC50) and 90% inhibitory concentration (IC90) values of Ba/F3 cells transformed with FLT3 WT and mutants as presented in c, d. Graphs and images shown are representatives from six experiments. Statistical significance was assessed using one-way analysis of variance (ANOVA) and Kruskal–Wallis test comparing each condition to the respective FLT3 D835Y and expressed as: *p < 0.05; **p < 0.01
Fig. 2
Fig. 2
Differential mutation profiles in pre-tyrosine kinase inhibitor (TKI)-treated patients and crenolanib poor responders. a Mutation spectrum identified by whole exome sequencing and targeted deep sequencing before crenolanib treatment in TKI-naive and pre-TKI group. b Comparison of frequencies of specific mutated genes detected in TKI-naive, prior TKI treatment patients. c The graph depicts mean ± SEM of mutation numbers discovered in The Cancer Genome Atlas (TCGA) de novo acute myeloid leukemia (AML) patients with FMS-like tyrosine kinase 3 (FLT3) mutations (n = 56, mutation number range 1–4), TKI-naive (n = 13, mutation number range 1–6) and prior TKI (n = 24, mutation number range 2–8) treatment patients. d The graph depicts mean ± SEM of number of mutations in TCGA de novo AML patients, crenolanib good responders (n = 10, mutation number range 1–5) and poor-responders (n = 27, mutation number range 1–8). For (c, d), FLT3-ITD and FLT3 tyrosine kinase domain (TKD) compound mutation is counted as 2. e Comparison of frequencies of specific mutated genes detected in crenolanib good responders and poor responders. f Graph depicts variant allele frequency (VAF) change of gene mutations during crenolanib treatment. Statistical significance was assessed using one-way analysis of variance (ANOVA) and Kruskal–Wallis test comparing each condition to the respective FLT3 D835Y and expressed as: **p < 0.01, ****p < 0.0001
Fig. 3
Fig. 3
RAS pathway mutations contribute to crenolanib resistance and disease relapse. a The graph depicts variant allele frequencies (VAFs) of FLT3-ITD/TKD and RAS pathway mutations during crenolanib treatment. b Graph depicts higher mean ± SEM of cell viabilities of crenolanib-treated PTPN11 A72D/ FLT3 D835Y Ba/F3 cells in comparison to PTPN11 WT/ FLT3 D835Y co-expressing Ba/F3 cells and FLT3 D835Y-alone expressing Ba/F3 cells determined by MTS assay. c Graph depicts mean ± SEM of crenolanib half-maximal inhibitory concentration (IC50) in (b). Data shown are from five biological replicates. Statistical significance was assessed using one-way analysis of variance (ANOVA) together with Dunn’s multiple comparisons tests and expressed as: *p < 0.05
Fig. 4
Fig. 4
TET2 nonsense/frameshift mutations contribute to crenolanib unresponsiveness. a Variant allele frequencies (VAFs) of FLT3-ITD/TKD and TET2 nonsense/frameshift mutations during crenolanib treatment. b Representative images of colony-forming unit (CFU) assay demonstrate reduced crenolanib sensitivity of Flt3ITD;Tet2+/− mouse stem cells. Graph depicts mean ± SEM of colony numbers for three or four replicates of Flt3ITD and Flt3ITD;Tet2+/− mouse stem cells treated with gradient concentrations of crenolanib c or azacytidine and two drugs in combination d as described in the Methods. Statistical significance was determined using two-tailed nonparametric Student’s t-tests (Mann–Whitney test) comparing each group to the non-treated group and expressed as *p < 0.05
Fig. 5
Fig. 5
IDH1 and IDH2 mutations contribute to crenolanib resistance. a Variant allele frequencies (VAFs) of FLT3-ITD/TKD and IDH1 or IDH2 during crenolanib treatment. Notably, we did not detect the IDH1 mutation in B32 before crenolanib treatment by exome sequencing. However, a targeted gene panel detected this IDH1 mutation before crenolanib treatment. b Graph depicts mean ± SEM of colony numbers of FLT3-ITD/IDH1 WT and FLT3-ITD/IDH1 R132H expressing mouse stem cells treated with gradient concentrations of crenolanib, AG5198 or two drugs in combination. c Graph depicts cell viabilities of FLT3 D835Y, IDH1 WT/ FLT3 D835Y and IDH1 R132H/ FLT3 D835Y expressing Ba/F3 cells treated with crenolanib, or crenolanib in combination with IDH1 Inhibitor (AG5198) determined by MTS assay. d Graph depicts decreased half-maximal inhibitory concentration (IC50) of crenolanib and AG5198 in combination compared to crenolanib alone. Statistical significance was determined using two-tailed nonparametric Student’s t-tests (Mann–Whitney test) comparing each group to the non-treated group. TP53 mutations co-occur with FLT3 mutations and confer crenolanib resistance. e Graph depicts VAFs of FLT3-ITD/TKD and TP53 or PPM1D mutation during crenolanib treatment. f Representative graph depicts higher mean ± SEM of cell viability of crenolanib-treated Molm13 cells expressing CRISPR/Cas9 and single-guide RNAs (sgRNAs) targeting TP53 compared to cells expressing CRISPR/Cas9 and a non-specific targeting sgRNA (NS) control. TP53_1: sgRNA1 targeting TP53; TP53_2: sgRNA2 targeting TP53. g Graph depicts mean ± SEM of crenolanib IC50 in (b). Data shown are from three or five biological replicates. Statistical significance was assessed using one-way analysis of variance (ANOVA) together with Dunn’s multiple comparisons tests and expressed as: *p < 0.05
Fig. 6
Fig. 6
Mutation spectrum and clonal patterns of patients treated with crenolanib. a Graph depicts mutations identified by exome sequencing, gene panel and/or targeted sequencing. Each column displays a patient; each row denotes a specific gene. Recurrently mutated genes are color-coded for only present before crenolanib treatment, only present in after crenolanib treatment samples, persistence before and after crenolanib treatment, with no samples available before or after crenolanib treatment. b Graph depicts primary drug-resistant clone. In this case, FLT3 mutation clones co-occur with a TET2 mutation clone and the variant allele frequencies (VAFs) of the combined mutation persist during drug treatment. c The second pattern is the acquisition or expansion of additional mutations in the context of a FLT3 mutation. In this case, the original, dominant FLT3 tyrosine kinase domain (TKD) clone was inhibited by crenolanib after three cycle treatments. However, CEBPA mutation was acquired and expanded at the time of drug resistance in FLT3 TKD clone. d The third pattern is the acquisition of subclones independent of FLT3 mutation clones. In this case, FLT3 mutation clones were eliminated by crenolanib; however, a PTPN11 mutation clone emerged during crenolanib treatment. Of note, the clonal patterns shown do not include mutation information before crenolanib treatment. C: crenolanib treatment cycle number; Chemo: chemotherapy. The y-axis stands for VAF

References

    1. Papaemmanuil E, et al. Genomic classification and prognosis in acute myeloid leukemia. N. Engl. J. Med. 2016;374:2209–2221. doi: 10.1056/NEJMoa1516192. - DOI - PMC - PubMed
    1. Cancer Genome Atlas Research Network, et al. Genomic and epigenomic landscapes of adult de novo acute myeloid leukemia. N. Engl. J. Med. 368, 2059–2074 (2013). - PMC - PubMed
    1. Frohling S, et al. Prognostic significance of activating FLT3 mutations in younger adults (16 to 60 years) with acute myeloid leukemia and normal cytogenetics: a study of the AML Study Group Ulm. Blood. 2002;100:4372–4380. doi: 10.1182/blood-2002-05-1440. - DOI - PubMed
    1. Kottaridis PD, et al. The presence of a FLT3 internal tandem duplication in patients with acute myeloid leukemia (AML) adds important prognostic information to cytogenetic risk group and response to the first cycle of chemotherapy: analysis of 854 patients from the United King. Blood. 2001;98:1752–1759. doi: 10.1182/blood.V98.6.1752. - DOI - PubMed
    1. Brunet S, et al. Impact of FLT3 internal tandem duplication on the outcome of related and unrelated hematopoietic transplantation for adult acute myeloid leukemia in first remission: a retrospective analysis. J. Clin. Oncol. 2012;30:735–741. doi: 10.1200/JCO.2011.36.9868. - DOI - PubMed

Publication types

MeSH terms