. 2019 May;38(18):3521-3534.
doi: 10.1038/s41388-018-0669-2. Epub 2019 Jan 16.

ADAM10 mediates malignant pleural mesothelioma invasiveness

Affiliations

ADAM10 mediates malignant pleural mesothelioma invasiveness

Christelle Sépult et al. Oncogene. 2019 May.

Abstract

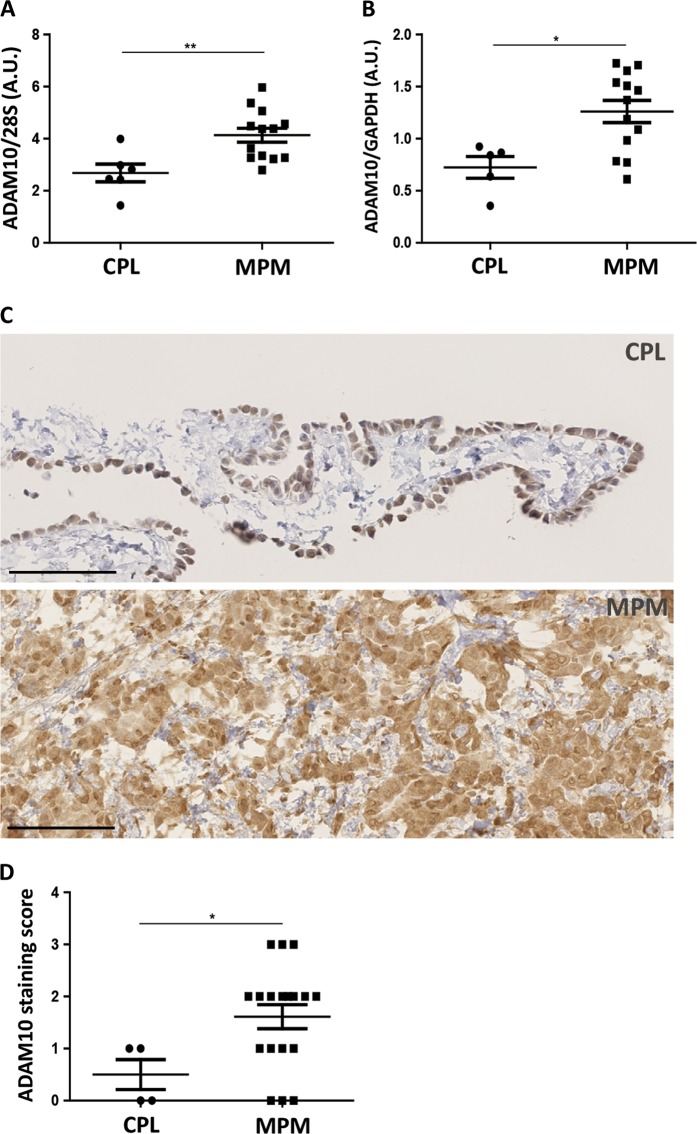
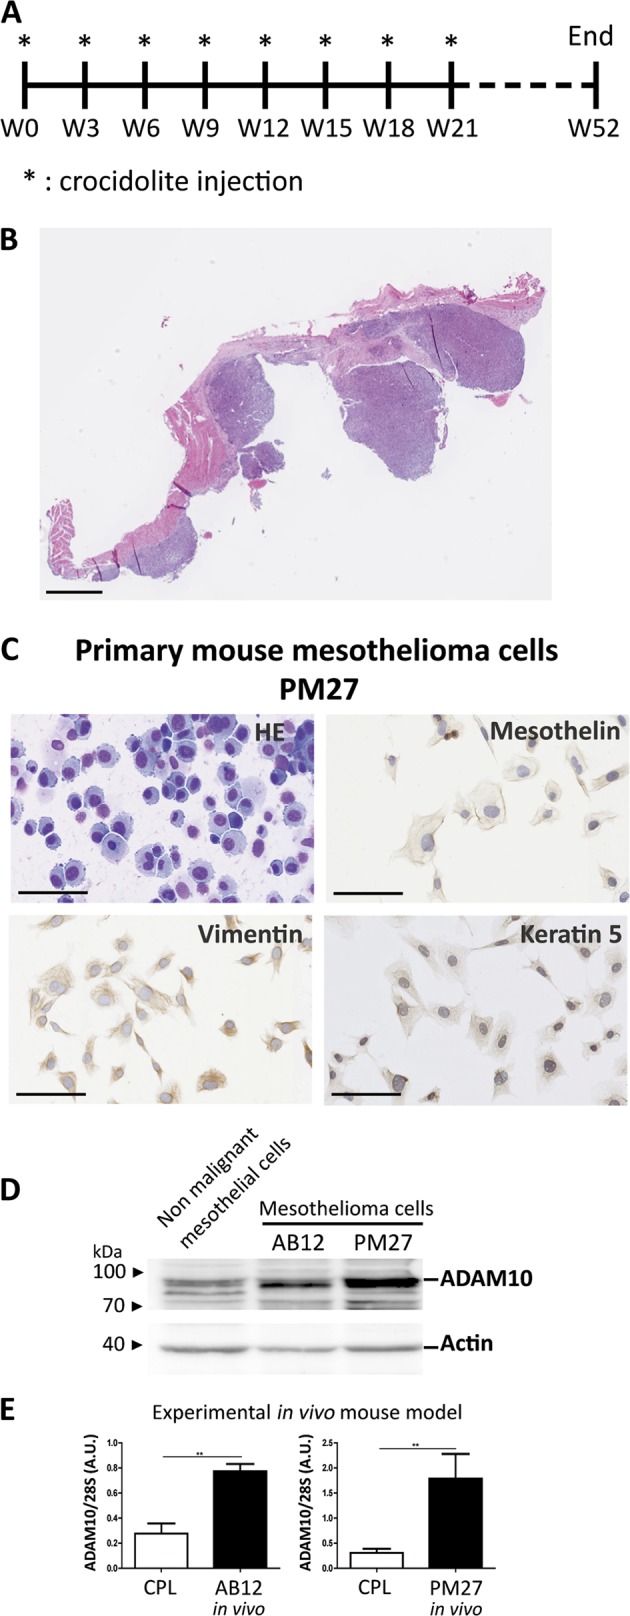
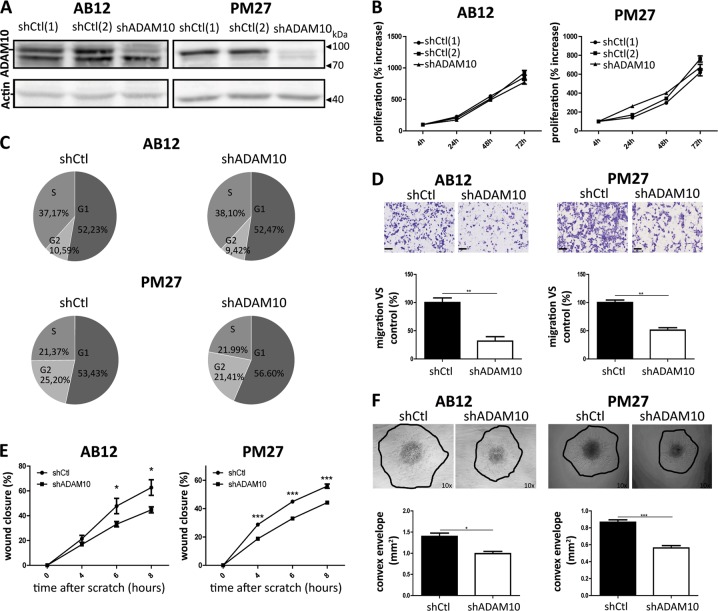
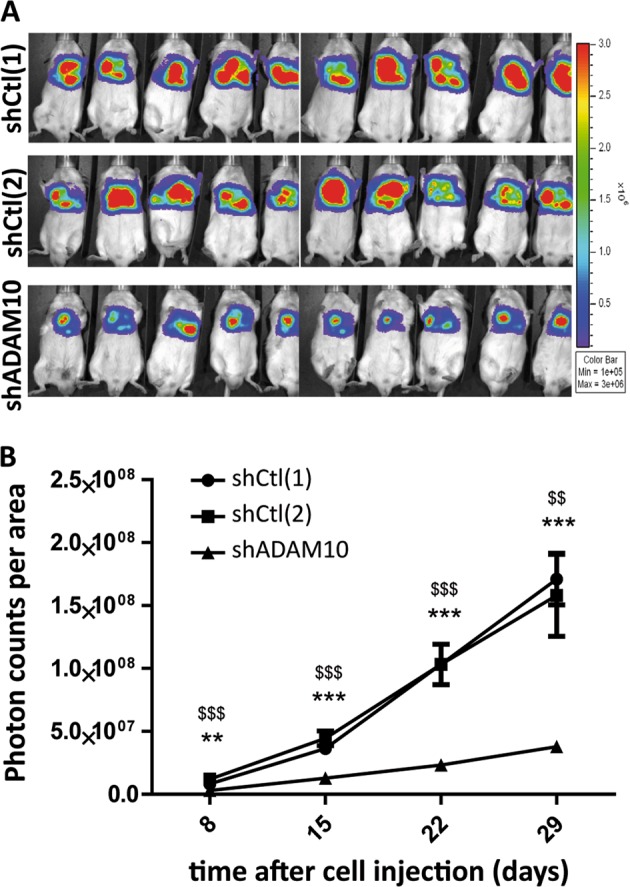
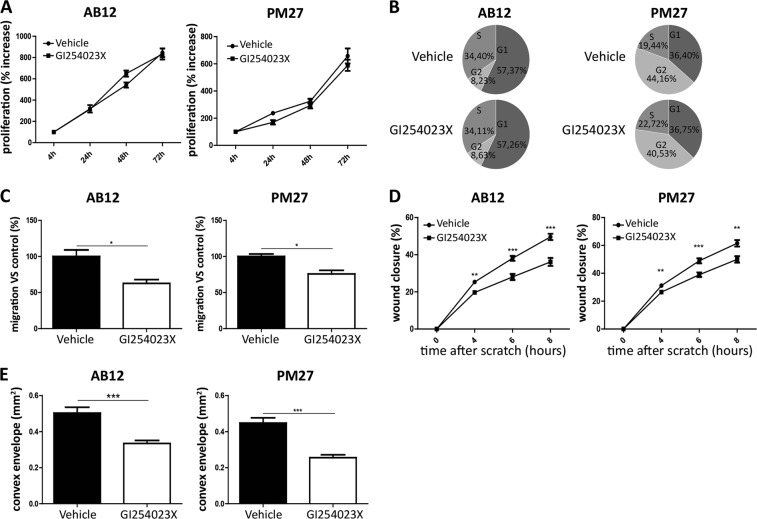
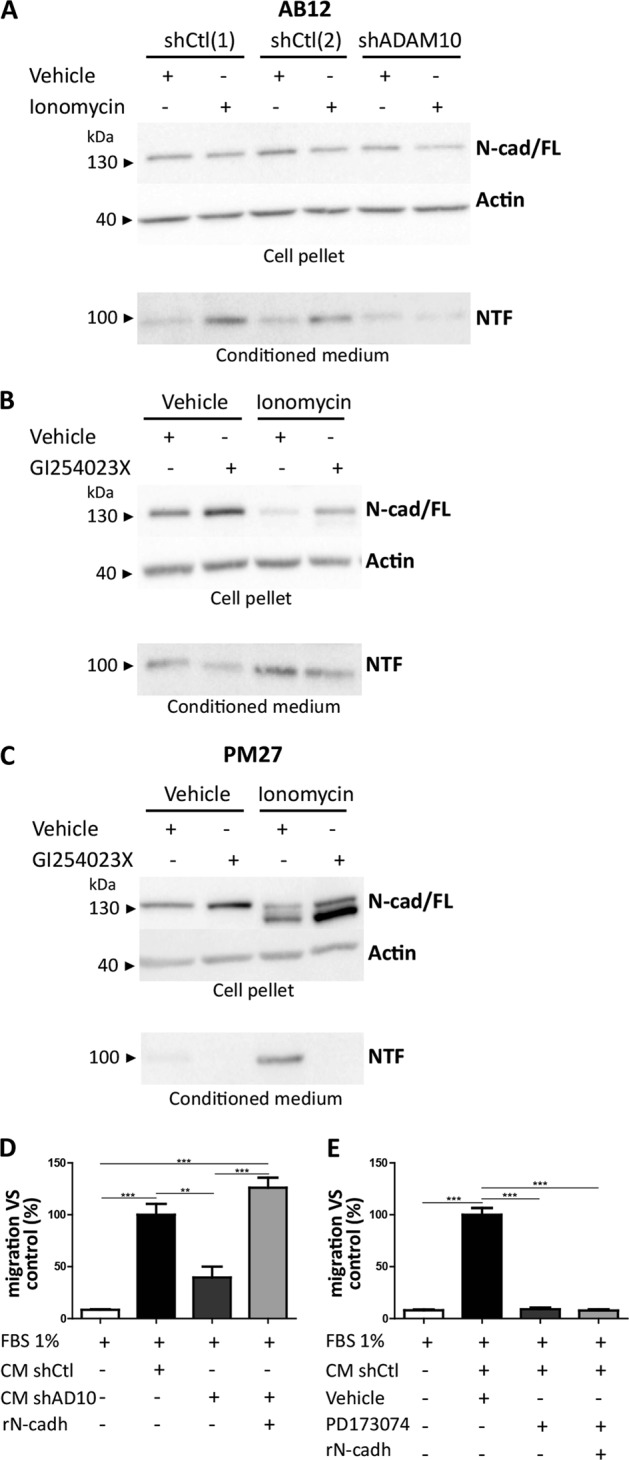
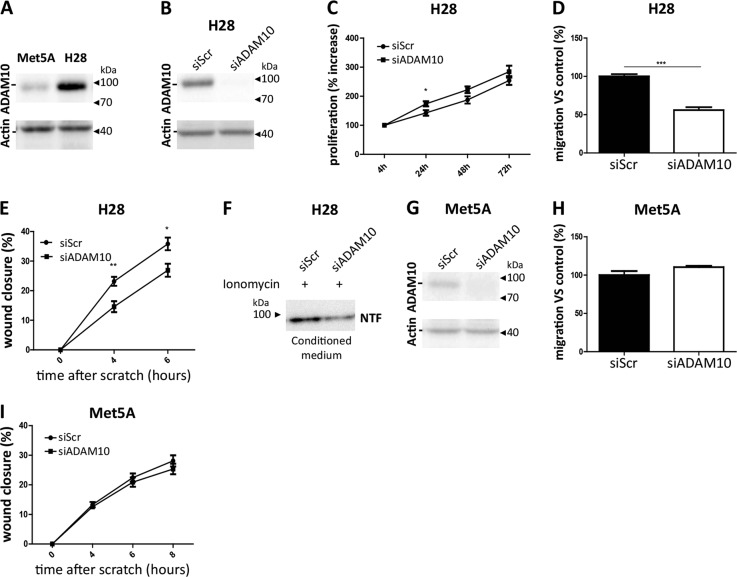
Malignant pleural mesothelioma (MPM) is an aggressive cancer with limited therapeutic options and treatment efficiency. Even if the latency period between asbestos exposure, the main risk factor, and mesothelioma development is very long, the local invasion of mesothelioma is very rapid leading to a mean survival of one year after diagnosis. ADAM10 (A Disintegrin And Metalloprotease) sheddase targets membrane-bound substrates and its overexpression is associated with progression in several cancers. However, nothing is known about ADAM10 implication in MPM. In this study, we demonstrated higher ADAM10 expression levels in human MPM as compared to control pleural samples and in human MPM cell line. This ADAM10 overexpression was also observed in murine MPM samples. Two mouse mesothelioma cell lines were used in this study including one primary cell line obtained by repeated asbestos fibre injections. We show, in vitro, that ADAM10 targeting through shRNA and pharmacological (GI254023X) approaches reduced drastically mesothelioma cell migration and invasion, as well as for human mesothelioma cells treated with siRNA targeting ADAM10. Moreover, ADAM10 downregulation in murine mesothelioma cells significantly impairs MPM progression in vivo after intrapleural cell injection. We also demonstrate that ADAM10 sheddase downregulation decreases the production of a soluble N-cadherin fragment through membrane N-cadherin, which stimulated mesothelioma cell migration. Taken together, we demonstrate that ADAM10 is overexpressed in MPM and takes part to MPM progression through the generation of N-cadherin fragment that stimulates mesothelioma cell migration. ADAM10 inhibition is worth considering as a therapeutic perspective in mesothelioma context.


Conflict of interest statement

DC is the founder of Aquilon Pharmaceuticals, received speaker fees from AstraZeneca, Boehringer Ingelheim, Novartis, Mundipharma, Chiesi and GSK and received consultancy fees from AstraZeneca, Boehringer Ingelheim, Chiesi, GSK and Novartis for the participation to advisory boards. None of these activities are related to the therapy of cancer or mesothelioma.

Figures

Fig. 1
Fig. 1
ADAM10 expression levels in human samples of control pleura (CPL) and malignant pleural mesothelioma (MPM). a RT-PCR measurement of ADAM10 mRNA levels in human MPM (n = 13) and CPL (n = 6) samples. Quantification of ADAM10 mRNA expression was normalized to 28S rRNA. Results are expressed as mean ± SEM. Statistical significance was calculated by Student t test; **P = 0.0056. b Measurement of ADAM10 protein levels by western blotting in human samples of CPL (n = 5) and MPM (n = 13). Quantification of ADAM10 protein expression was normalized to GAPDH protein. Results are expressed as mean ± SEM. Statistical significance was calculated by Student t test; *P = 0.0104. c Representative examples of immunohistochemistry targeting ADAM10 in CPL and in MPM tissues; scale bars = 100 µm. d Score of staining intensity (from 0 to 3) of immunohistochemistry targeting ADAM10 on CPL (n = 4) and MPM (n = 18) tissues. Results are expressed as mean ± SEM. Statistical significance was calculated by Student t test; *P = 0.0429
Fig. 2
Fig. 2
Development of a primary mesothelioma (PM) cell line and expression levels of ADAM10 in mouse mesothelioma. a Timeline of the experimental mouse model of primary mesothelioma development. Mice were intraperitoneally injected with crocidolite fibres every three weeks (stars). A total of 8 injections were performed. Primary mesothelioma occurred maximum one year after the first crocidolite injection. b Hematoxylin-eosin (HE) staining of primary mesothelioma nodules developed on diaphragm of crocidolite-treated mice; scale bar = 1 mm. c Representative images of primary mesothelioma PM27 cell line characterization: HE staining and immunocytochemistry targeting mesothelin, vimentin and keratin 5; scale bars = 100 µm. d Measurement of ADAM10 expression by western blotting in murine non-malignant mesothelial cells and in mesothelioma cell lines (AB12 and PM27). Actin was used as loading control. e Quantification of ADAM10 mRNA expression by RT-PCR in control pleura (CPL, n ≥ 3) from diaphragm of healthy mice and in mouse mesothelioma tumours obtained after intrapleural injection of AB12 (n = 6) or PM27 (n = 5) cells. ADAM10 expression levels were normalized to 28S rRNA levels. Results are expressed as mean ± SEM; Student t test; **P < 0.01
Fig. 3
Fig. 3
Effects of ADAM10 shRNA depletion in mesothelioma cells on proliferation, migration and invasion. a Western blot analysis of ADAM10 protein levels in AB12 and PM27 cells transduced with two different control shRNA (shCtl[1] or [2]) or with a shRNA targeting ADAM10 (shADAM10). Actin was used as a loading control. b Proliferation rates were assessed for AB12 and PM27 cells after 4, 24, 48 and 72 h by CYQUANT analysis (n ≥ 6). All measurements were normalized to the ‘4 h-timing’ considered as baseline proliferation and expressed as percentage increase from baseline. For in vitro results, shCtl condition correspond to shCtl[1]-treated AB12 or PM27 cells. c Representative examples of AB12 and PM27 percentages present in the different phases of cell cycle (G1, S or G2) 24 h after cell seeding. d Upper panel: representative HE-stained images showing cells that migrated through the transwell filter. Scale bars = 100 µm. Lower panel: quantification of numbers of migrating AB12 or PM27 cells transduced with shCtl or shADAM10 per field (n = 3). Results are expressed as percentage of control condition (mean ± SEM); Student t test; **P < 0.01. e Wound healing assay performed on AB12 and PM27 cells transduced with shCtl or shADAM10. The wound closure was evaluated 4, 6 and 8 h after the scratch (n = 8). Results are expressed as mean ± SEM; Student t test; *P < 0.05; ***P < 0.001. f Upper panel: representative examples of spheroids composed of AB12 or PM27 cells transduced with shCtl or shADAM10; magnification ×10. Lower panel: quantification of cell invasion in collagen gel (n ≥ 7). Results are expressed as mean ± SEM; Student t test; *P < 0.05; ***P < 0.001
Fig. 4
Fig. 4
ADAM10-depleted mesothelioma cells decrease in vivo tumour development. a Representative bioluminescent images of mesothelioma tumours developed in vivo from AB12 cells depleted (shADAM10) or not (shCtl[1] and [2]) for ADAM10, 29 days after tumour cell injections. b Bioluminescence quantification (photon counts per area) of regions of interest (mesothelioma tumours) 8, 15, 22 and 29 days after shCtl[1]-, shCtl[2]- or shADAM10-treated AB12 cell injections (n = 10). Results are expressed as mean ± SEM; one-way ANOVA; **P < 0.01, ***P < 0.001 shADAM10 vs shCtl[1]; $$P < 0.01, $$$P < 0.001 shADAM10 vs shCtl[2]
Fig. 5
Fig. 5
Effects of a pharmacological inhibitor of ADAM10, GI254023X, on proliferation, migration and invasion of mesothelioma cells. a Measurement of AB12 (left panel) and PM27 (right panel) cell proliferation by CYQUANT analysis performed 4, 24, 48 and 72 h after treatment with GI254023X (5 µM) or vehicle (n = 6). All readings were normalized to the reading ‘after 4 h of treatment’ considered as baseline proliferation and expressed as percentage increase from baseline. b Representative examples of percentages of AB12 or PM27 cells in the different phases of cell cycle (G1, S or G2) measured by FACS analysis 24 h after GI254023X (5 µM) or vehicle treatment. c Quantification of numbers of migrating AB12 or PM27 cells per field, in response to 5 µM GI254023X or vehicle (n = 3). Results are expressed as percentage of control condition (mean ± SEM); Student t test; *P < 0.05. d Wound healing assay performed on AB12 or PM27 cells treated with GI254023X (5 µM) or vehicle (n ≥ 8). The wound closure was evaluated 4, 6 and 8 h after the scratch. Results are expressed as mean ± SEM; Student t test; **P < 0.01; ***P < 0.001. e Invasive properties of AB12 or PM27 cells treated or not with GI254023X (5 µM) was evaluated by performing a 3D spheroid assay (n ≥ 10). Results are expressed as mean ± SEM; Student t test; *** P < 0.001
Fig. 6
Fig. 6
ADAM10 processes N-cadherin shedding in stimulated mesothelioma cells and soluble N-terminal fragment of N-cadherin promotes migration of AB12 mesothelioma cells. a Representative gel lanes of western blot analysis of full-length 135 kDa N-cadherin (N-cad/FL) in cell pellets and soluble N-terminal 95 kDa fragment (NTF) in conditioned medium (CM) of stimulated AB12 cells transduced with shCtl[1], shCtl[2] or shADAM10. AB12 cells are stimulated with ionomycin (5 µM) or vehicle control. Actin was used as loading control of cell pellet fractions. bc Representative gel lanes of western blot analysis of N-cad/FL in cell pellets and NTF in CM of AB12 (b) or PM27 (c) cells treated or not with GI254023X (5 µM), with ionomycin or vehicle control. Actin was used as loading control of cell pellet fractions. d Measurement of AB12 cell migration by transwell chamber assay challenged by CM of shCtl or shADAM10-transduced AB12 cells, in presence or not of recombinant mouse N-cadherin (rN-cadh; 500 ng/ml) (n = 3). Quantification of cell numbers per field is expressed as percentage of control condition (mean ± SEM); one-way ANOVA test; **P < 0.01; *** P < 0.001. e Transwell chamber assay in response to CM of shCtl AB12 cells treated or not with PD173074 (5 µM), in presence or not of recombinant mouse N-cadherin (rN-cadh; 500 ng/ml) (n = 3). Quantification of numbers of cells per field is expressed as percentage of control condition (mean ± SEM); one-way ANOVA test; ***P < 0.001
Fig. 7
Fig. 7
ADAM10 expression levels in human non-malignant mesothelial Met5A cells and human mesothelioma H28 cells and effects of siRNA targeting ADAM10 on migration of these cells. a Measurement of ADAM10 expression by western blot analysis in human Met5A and H28 cell lines. Actin was used as loading control. b Western blot analysis of ADAM10 protein levels in mesothelioma H28 cells transfected with siRNA control Scramble (siScr) or siRNA targeting ADAM10 (siADAM10). Actin was used as a loading control. c H28 proliferation rates were assessed 4, 24, 48 and 72 h after cell seeding by CYQUANT analysis (n = 6). All measurements were normalized to the ‘4 h-timing’ considered as baseline proliferation and expressed as percentage increase from baseline; Student t test; *P < 0.05. d Quantification of migrating H28 cell numbers per field (n = 3) by transwell assay. H28 cells were previously transfected with siScr or siADAM10. Results are expressed as percentage of control condition (mean ± SEM); Student t test; ***P < 0.001. e Wound healing assay performed on siScr or siADAM10-treated H28 cells. The wound closure was evaluated 4 and 6 h after the scratch (n = 9). Results are expressed as mean ± SEM; Student t test; *P < 0.05; **P < 0.01. f Representative gel lanes of western blot analysis of soluble N-terminal 95 kDa fragment (NTF) in conditioned medium of ionomycin-stimulated (3 µM) H28 cells transfected with siScr or siADAM10. g Western blot analysis of ADAM10 protein levels in mesothelial Met5A cells transfected with siRNA control Scramble (siScr) or siRNA targeting ADAM10 (siADAM10). Actin was used as a loading control. h Quantification of numbers of migrating Met5A cells transfected with siScr or siADAM10 per field by transwell assay (n = 3). Results are expressed as percentage of control condition (mean ± SEM). i Wound healing assay performed on siScr or siADAM10-treated Met5A cells. The wound closure was evaluated 4, 6 and 8 h after the scratch (n = 9). Results are expressed as mean ± SEM

References

    1. Bononi A, Napolitano A, Pass HI, Yang H, Carbone M. Latest developments in our understanding of the pathogenesis of mesothelioma and the design of targeted therapies. Expert Rev Respir Med. 2015;9:633–54. doi: 10.1586/17476348.2015.1081066. - DOI - PMC - PubMed
    1. Donaldson K, Poland CA, Murphy FA, Macfarlane M, Chernova T, Schinwald A. Pulmonary toxicity of carbon nanotubes and asbestos—similarities and differences. Adv Drug Deliv Rev. 2013 doi: 10.1016/j.addr.2013.07.014. - DOI - PubMed
    1. Ray M, Kindler HL. Malignant pleural mesothelioma: an update on biomarkers and treatment. Chest. 2009;136:888–96. doi: 10.1378/chest.08-2665. - DOI - PubMed
    1. Yap TA, Aerts JG, Popat S, Fennell DA. Novel insights into mesothelioma biology and implications for therapy. Nat Rev Cancer. 2017;17:475–88. doi: 10.1038/nrc.2017.42. - DOI - PubMed
    1. Andreini C, Banci L, Bertini I, Elmi S, Rosato A. Comparative Analysis of the ADAM and ADAMTS Families. J Proteome Res. 2005;4:881–8. doi: 10.1021/pr0500096. - DOI - PubMed

Publication types

MeSH terms