. 2019 Jan;565(7741):606-611.
doi: 10.1038/s41586-018-0828-1. Epub 2019 Jan 16.

Excised linear introns regulate growth in yeast

Affiliations

Excised linear introns regulate growth in yeast

Jeffrey T Morgan et al. Nature. 2019 Jan.

Abstract

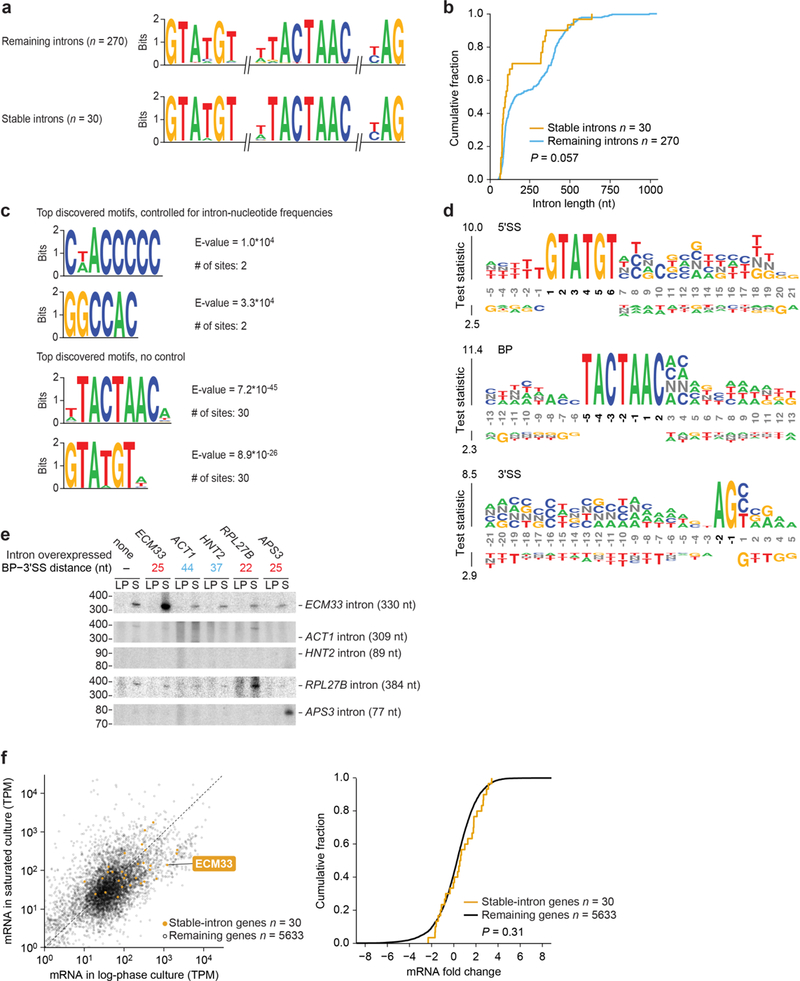
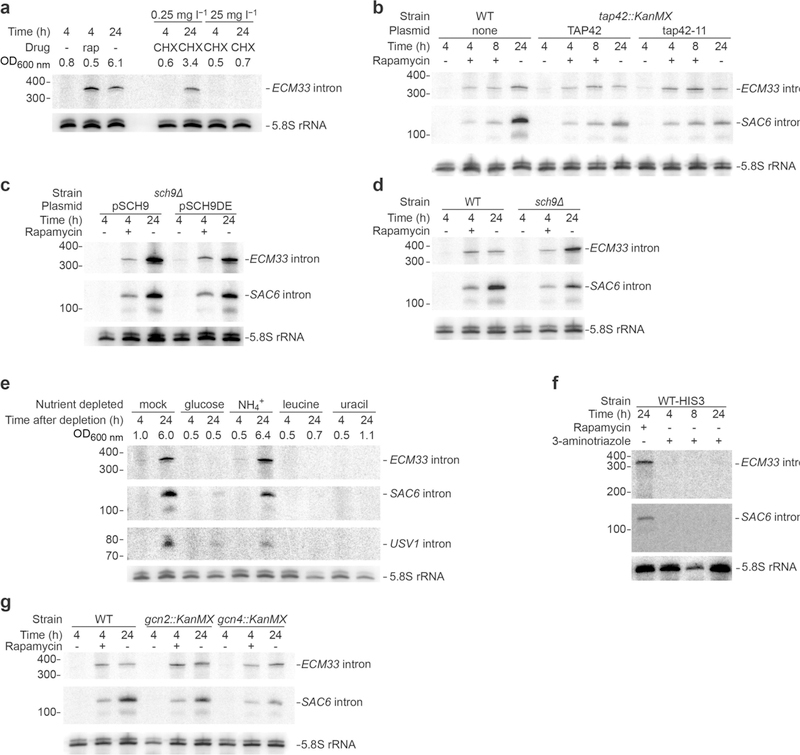
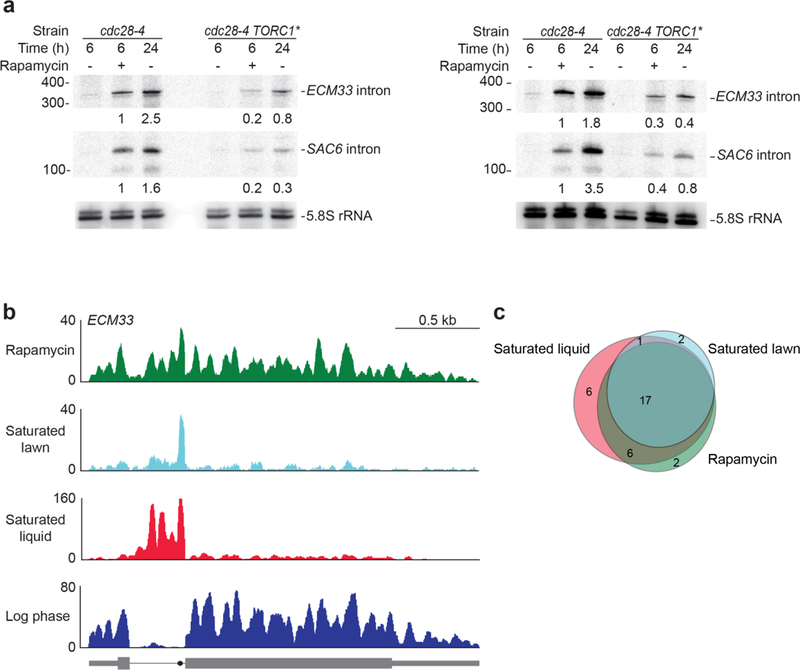
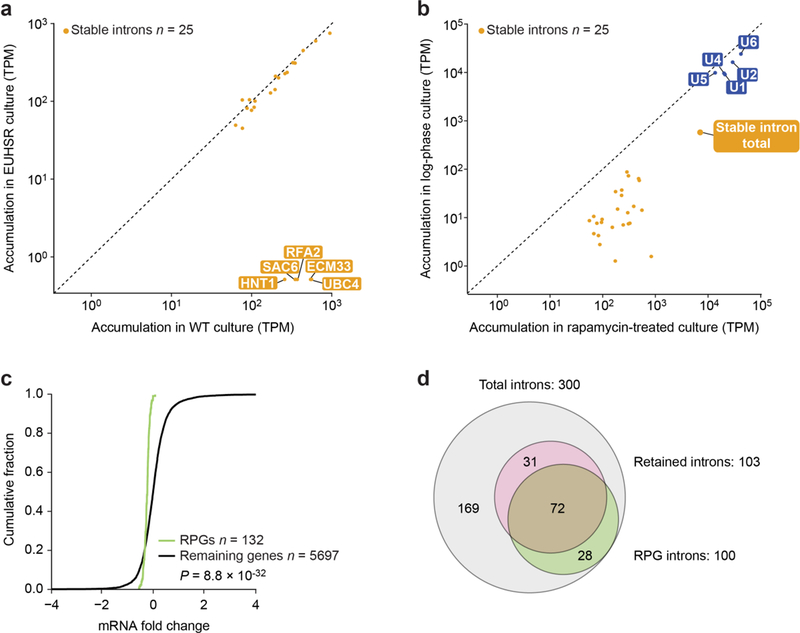
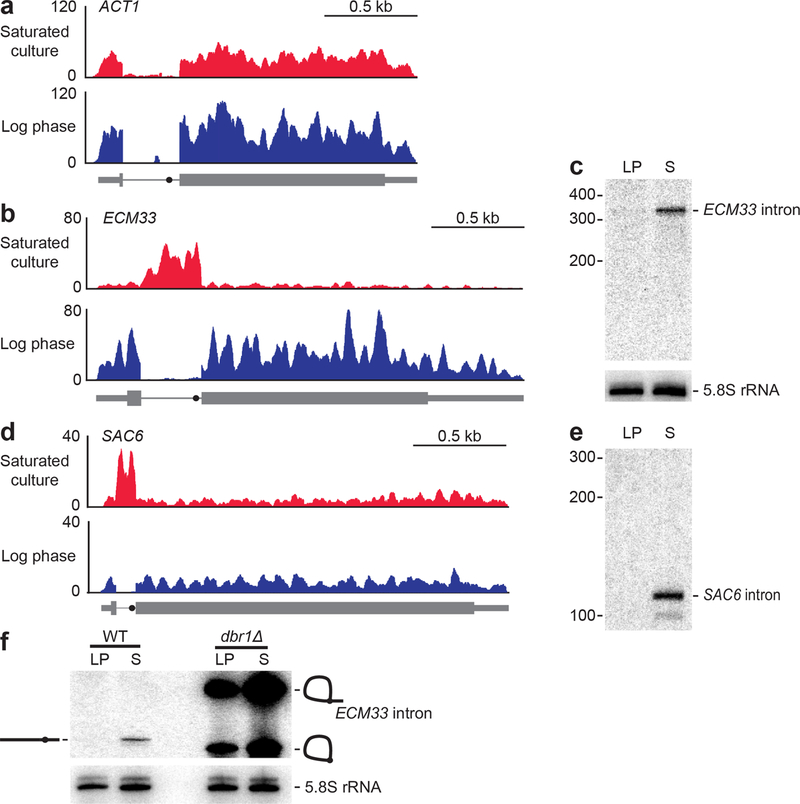
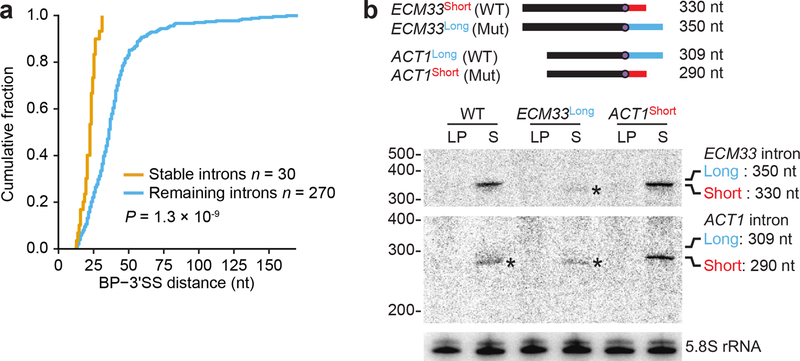
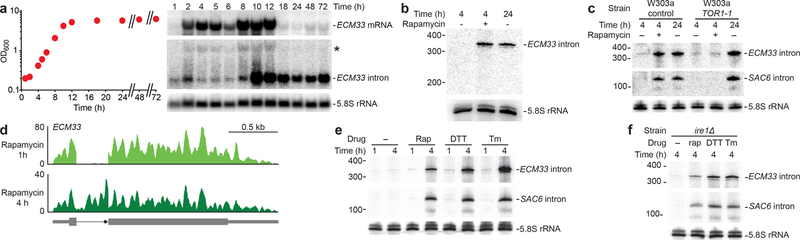
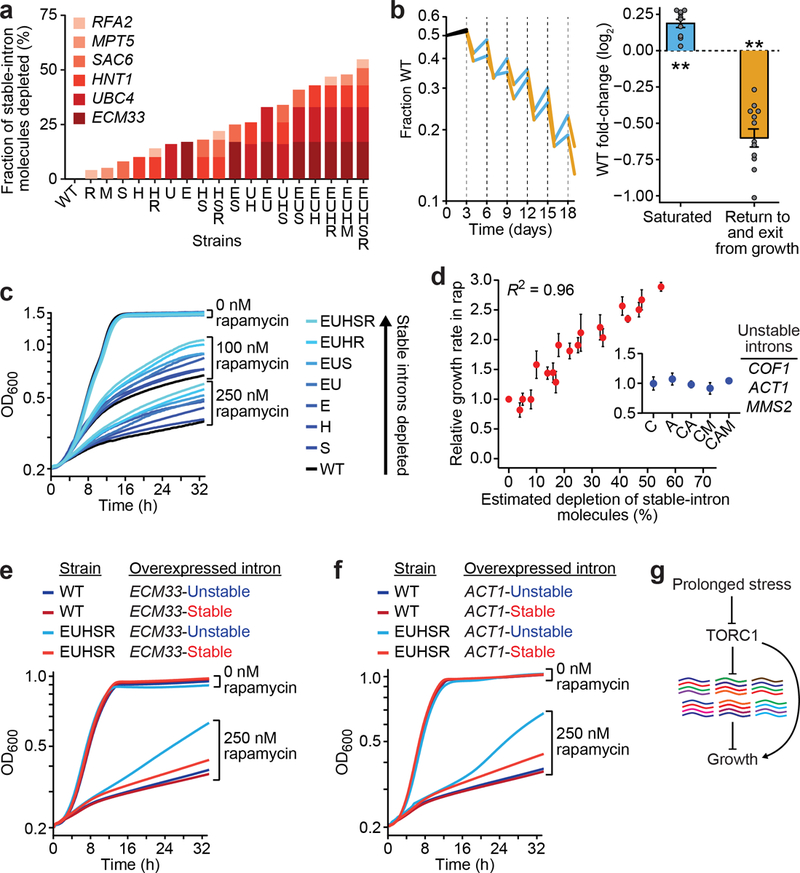
Spliceosomal introns are ubiquitous non-coding RNAs that are typically destined for rapid debranching and degradation. Here we describe 34 excised introns in Saccharomyces cerevisiae that-despite being rapidly degraded in log-phase growth-accumulate as linear RNAs under either saturated-growth conditions or other stresses that cause prolonged inhibition of TORC1, which is a key integrator of growth signalling. Introns that become stabilized remain associated with components of the spliceosome and differ from other spliceosomal introns in having a short distance between their lariat branch point and 3' splice site, which is necessary and sufficient for their stabilization. Deletion of these unusual introns is disadvantageous in saturated conditions and causes aberrantly high growth rates in yeast that are chronically challenged with the TORC1 inhibitor rapamycin. The reintroduction of native or engineered stable introns suppresses this aberrant rapamycin response. Thus, excised introns function within the TOR growth-signalling network of S. cerevisiae and, more generally, excised spliceosomal introns can have biological functions.


Conflict of interest statement

Competing Interests

The authors declare no competing financial interests.

Figures

Extended Data Fig. 1 |
Extended Data Fig. 1 |. RNA-seq coverage across the branch point and to the 3′SS of the ECM33 intron.
The pileup of reads mapping to the 61-nucleotide region centred on the ECM33 branch point, replotted from Fig. 1b, is shown (red, top). The position of the branch point (closed circle with flanking dashed lines) is indicated on the intron (thick grey line) and relative to the 3′ exon (grey box). Bottom, all reads mapping uniquely to this region are shown (thin grey lines). Reads mapping across the exon-exon junction are coloured blue in the region of the excised intron and are shown above the other reads. Mismatched nucleotides within reads are indicated with coloured bars, with the colour of the bar indicating the identity of the mismatch. Terminal untemplated nucleotides have been clipped from reads.
Extended Data Fig. 2 |
Extended Data Fig. 2 |. Stable-intron sedimentation and expression constructs for pull-down and mass spectrometry.
a, Co-sedimentation of the ECM33 stable intron with large ribonucleoprotein complexes. Cleared lysate from a saturated yeast culture was fractionated by sedimentation into a 10–30% sucrose gradient, and RNA was extracted from each fraction. An RNA blot that resolved 25% of the RNA from each fraction and was probed for the ECM33 intron is shown. Fractions are oriented with increasing sedimentation from left to right. RNA was also extracted from 12.5% of the total lysate before sedimentation, of which 50% was loaded for comparison (left lane). The sedimentation of 40S and 60S complexes is marked on the basis of the location of ribosome subunits. Migration of markers with lengths indicated (in nucleotides) is shown on the left. n = 6 biological replicates. b, Behaviour of stable introns ectopically expressed from the URA3 gene. An RNA blot probed for the ECM33 intron after resolving total RNA from cultures expressing the ECM33 intron from the endogenous ECM33 locus (WT, left lanes), cultures from a strain in which the intron had been deleted (ECM33Δintron, middle lanes) and cultures of this deletion strain ectopically expressing the ECM33 intron spliced from the plasmid-borne URA3 reporter gene (right lanes) is shown. pRS416-ECM33_intron plasmid shown on right; PURA3, URA3 promoter; CEN/ARS (centromere/autonomously replicating sequence), low-copy origin of replication. Interior lanes that were not relevant to this experiment were removed from this image (vertical line). Otherwise, this panel is as in Fig. 1c. n = 4 biological replicates. c, Behaviour of stable introns with MS2 hairpins inserted to be used as affinity tags for pull-downs. Five different plasmids with a common backbone (right; PTEF1, TEF1 promoter; FLAG–MCP, coding region of Flag-tagged MS2 coat protein) each expressed URA3 with a different variant of the ECM33 intron (variants A–E, schematized below). These plasmids were each expressed in the strain that lacked an endogenous ECM33 intron (ECM33Δintron). The RNA blot resolved total RNA from the indicated cultures and was probed for a sequence common to the intron variants; otherwise, as in Fig. 1c. The 2 × MS2 hairpin region is 90 nucleotides long, and the expected linear-intron sizes were: A, no intron; B, 330 nucleotides; C, 420 nucleotides; D, 300 nucleotides; and E, 420 nucleotides. n ≥ 2 biological replicates.
Extended Data Fig. 3 |
Extended Data Fig. 3 |. Stable introns have oligoadenylate tails.
a, Example of RNA-seq support for intron accumulation and terminal adenylylation. The diagram (top, left) classifies the RNA-seq reads that derive from the possible intron states of ECM33 transcripts (black lines, reads; red dashed lines, intron boundaries). Read counts from log-phase and saturated cultures (normalized for library depth) are listed for each class of reads (top, right). For convenient comparison to intron accumulation, exon reads are only counted if they map within 165 nucleotides of either splice site (thereby encompassing 330 nucleotides, the length of the intron). The alignment (bottom) shows representative reads mapping to the intron 3′ terminus, aligned below the sequence of the 3′ intron–exon junction. Many of these reads had untemplated terminal adenosine residues (blue). b, Composition of untemplated tailing nucleotides observed in a saturated culture. Reads that had at least one terminal untemplated nucleotide after trimming the 3′ adaptor sequence were collected, and the position of this tail was annotated as that of the last templated nucleotide. Counts of reads with tails added at positions 0 to +20 relative to the 5′SS, −10 to +10 relative to the branch point, and −20 to 0 relative to the 3′SS are plotted, binning counts for tails of only adenosines (An, teal) separately from those of all other tails (other, purple). For An tails that map to the 3′-terminal nucleotide of introns, the fraction with each indicated length is plotted (right). The relative abundance of An at positions −2 and −1 relative to the 3′SS was ambiguous because most introns have an adenosine at position −1 (3′SS consensus sequence, YAG), which causes tails of length n at position −1 to be indistinguishable from tails of length n + 1 at position −2.
Extended Data Fig. 4 |
Extended Data Fig. 4 |. RNA-seq profiles of genes with stable introns.
Profiles from the stable-intron-inducing condition (red) and log-phase culture (blue) are shown for the indicated 32 genes with confidently identified stable introns not already depicted in Fig. 1. For all but four of these, the profile of the stable-intron-inducing condition is from RNA-seq of the saturated-liquid sample. The four exceptions were not confidently identified in saturated liquid (Extended Data Table 2); for these, the profile of the stable-intron-inducing condition is from either the rapamycintreated sample (TDA5 and YOS1) or the saturated lawn (RPO26 and RPS8B). Scale bars, 100 nucleotides. Otherwise, this panel is as in Fig. 1a.
Extended Data Fig. 5 |
Extended Data Fig. 5 |. Stable introns are indistinguishable from other introns in many respects.
a, Similar splicing motifs compared to other introns. Information-content logos of splicing motifs (6-mer 5′SS, 8-mer branch point and 3-mer 3′SS) for stable introns (bottom) and other introns (top) are plotted. b, Similar length distribution compared to other introns. Cumulative distributions of intron lengths are plotted (P = 0.057, two-tailed Kolmogorov–Smirnov test). c, No significantly enriched motifs within stable introns. Stable-intron sequence motifs discovered by MEME are plotted, either controlling for k-mer frequencies of nonstable introns (top) or without controlling (bottom). No significant motifs were discovered in stable introns when k ≥ 6. The motifs discovered without controlling for k-mer frequencies matched the canonical branch point and 5′SS motifs (see a). Branch point and 5′SS motifs were also the only significantly enriched motifs discovered when k ≤ 5. d, No enriched positional k-mer motifs detected by kpLogo in stable introns. The most enriched k-mers at positions relative to 5′SS (top), branch point (middle), and 3′SS (bottom) are plotted, comparing stable introns to unstable introns. Stacked nucleotides at a position represent the most significant motif starting at that position. The height is scaled relative to the significance of the motif, as determined by the one-sided binomial test statistic (y axes). Black numbers indicate invariant nucleotides occurring >95% of the time at the position. No k-mers were significantly enriched when using a Bonferroni-corrected P of 0.01. e, Support for a role of branch point–3′SS distance in specifying stable-intron formation. The indicated introns were ectopically expressed from the URA3 splicing construct (Extended Data Fig. 2b). Results are shown from an RNA blot that resolved total RNA from cultures overexpressing the indicated introns and was probed for the indicated introns (length of excised intron in parentheses). The ECM33 and RPL27B introns were probed sequentially, and then the ACT1, HNT2 and APS3 introns were probed concurrently. ACT1 probe was validated on synthetic transcripts resembling the ACT1 intron, which were produced by in vitro transcription (not shown). Migration of markers with lengths (in nucleotides) indicated is at the left. n ≥ 2 biological replicates. f, Expression of mRNAs from genes containing stable introns. Left, relationship between the expression in log-phase and saturated cultures (expression cutoff, 1 TPM in both samples). Points for genes containing stable introns are indicated (orange), and the point for ECM33 is labelled. Right, comparison of the expression results of genes with stable introns to those of the remaining genes. The cumulative distributions of fold changes in expression (expressed as log2(mRNA in log-phase culture/mRNA in saturated culture)) observed between log-phase and saturated cultures are plotted, which shows no significant difference between stable-intron genes and other genes (P = 0.31 two-tailed Kolmogorov–Smirnov test).
Extended Data Fig. 6 |
Extended Data Fig. 6 |. Assessing aspects of TORC1 regulation on stable-intron expression.
a, Inability of TORC1-independent inhibition of protein synthesis to prematurely induce stable-intron accumulation. The left lanes show a replicate of Fig. 3b, and the right lanes show results after treatment with either low (0.25 mg l−1) or high (25 mg l−1) concentrations of cycloheximide. As indicated by OD600 nm at collection, the mild cycloheximide treatment allowed the culture to reach an OD600 nm of 3.4 after 24 h, which was equivalent to the OD600 nm of 10 h without cycloheximide (Fig. 3a). b, Dispensability of TORC1-responsive Tap42 for stable-intron formation. Samples were grown at 25 °C owing to temperature sensitivity of the tap42–11 allele. Additionally, owing to slower growth at 25 °C, the duration of pre-growth was extended to 5.5 h before reseeding in medium with (+) or without (−)rapamycin, such that the change in OD600 nm of the pre-growth sample matched that of wildtype cultures grown at 30 °C for 4 h. Otherwise, this panel is as in Fig. 3b. n = 2 biological replicates. c, Dispensability of TORC1-responsive Sch9 for stable-intron formation. Samples were grown in SC–Trp medium to maintain plasmids that either rescued (pSCH9) or did not rescue (pSCH9DE) Sch9 activity. Because of the slower growth of the sch9Δ pRS414::SCH9 and sch9Δ pRS414::SCH9DE strains (possibly owing to the requisite –Ura medium) the duration of pre-growth was extended to 5 h, such that the change in OD600 nm of the pre-growth sample matched that of wild-type cultures grown for 4 h. Otherwise, this panel is as in Fig. 3b. n = 3 biological replicates. d, Dispensability of Sch9 for stableintron formation. The left lanes show a replicate of Fig. 3b, and the right lanes show the same experiments performed in the sch9Δ strain. n = 2 biological replicates (sch9Δ samples). e, Inability of acute deprivation of select nutrients to induce accumulation of stable introns. To prevent contamination of starting cultures with stable introns contributed by inoculum, cultures were seeded at OD600 nm = 0.2 from an overnight culture that was allowed to grow to mid-log phase collected by vacuum filtration, washed in water and re-suspended in fresh medium that lacked the indicated nutrients. Cultures were collected after the indicated times and analysed as in Fig. 1c, except the RNA blot was sequentially re-probed for the ECM33, SAC6 and USV1 introns. As indicated by OD600 nm at collection, the sample deprived of ammonium sulfate (the main source of nitrogen) was still able to reach a high density after 24 h. n ≥ 2 biological replicates. f, Inability of the general amino acid control response to induce stable introns. Mid-log-phase cultures were treated with either 100 nM rapamycin or 50 mM 3-aminotriazole for the indicated times. Cultures were grown in SC–His to force inhibition of histidine biosynthesis by 3-aminotriazole. Cultures treated with 3-aminotriazole for 24 h did not reach a density sufficient to induce stable-intron accumulation by approaching saturated growth. g, Stable-intron accumulation despite inability to induce the general amino acid control pathway. The left lanes show a replicate of Fig. 3b, and the middle and right lanes show the same experiments performed in gcn2Δ and gcn4Δ strains, respectively.
Extended Data Fig. 7 |
Extended Data Fig. 7 |. The influence of hyperactive TORC1 on stable-intron formation.
a, The left and right panels are biological replicates comparing ECM33 and SAC6 intron levels in a strain with hyperactive TORC1 (TORC1*) to those in a strain-background control (cdc28-4). Growth conditions were as described for these strains. Overexpression of Sfp1 was induced 1 h before treatment with rapamycin (or no treatment). Owing to the decreased growth rate of these strains in the requisite conditions, samples with and without rapamycin were collected after 6 h of treatment rather than after 4 h of treatment. Numbers below the ECM33 and SAC6 intron blots indicate the level of each intron normalized to the level in the cdc28-4 rapamycin-treated samples, after first normalizing all lanes to the 5.8S rRNA loading control (set to 1). b, Accumulation of the ECM33 intron in rapamycin-treated saturated-lawn and saturated-liquid cultures, detected using RNA-seq. Results showing accumulation of this intron in saturated-liquid culture but not log-phase culture are from a different biological replicate than that shown in Fig. 1a, b; otherwise, this panel is as in Fig. 1a. Rapamycin results are re-plotted from Fig. 3d (4 h). c, Overlap between stable introns identified in saturated-liquid, saturatedlawn and rapamycin-treated cultures.
Extended Data Fig. 8 |
Extended Data Fig. 8 |. Evidence for spliceosome sequestration and control of ribosome production by stable introns.
a, No evidence for compensatory stable-intron expression after genomic deletion of five stable introns. The scatter plot shows the relationship between intron accumulation in rapamycin-treated, wild-type culture and in rapamycintreated, EUHSR culture, focusing on the 25 stable introns detected after rapamycin treatment (Extended Data Table 2). The dashed line is placed at x = y. Stable introns are indicated (closed orange circles). Points for introns deleted from the EUHSR genome (ECM33, UBC4, HNT1, SAC6, and RFA2) are labelled. All introns were pseudocounted at 0.5 TPM. b, Aggregate stable-intron accumulation approaching that of spliceosomal RNAs. Levels of stable introns and spliceosomal RNAs (labelled closed blue circles) are plotted, comparing levels in log-phase, wild-type culture to those in rapamycin-treated, wild-type culture. The aggregate stableintron abundance (closed orange circle, stable intron total) is also plotted. Much of the apparent accumulation observed in log-phase culture was attributable to reads from a few highly transcribed stable-intron genes (for example, RPS29A, which has an intron:mRNA TPM ratio of 107:2,030 in log phase compared to 289:319 in saturated culture). Otherwise, as in a. c, Reduced expression of mRNA of ribosomal protein genes (RPGs) when overexpressing a stable intron in rapamycin-treated EUHSR culture. The cumulative distributions of fold changes in mRNA expression (expressed as log2(mRNA in EUHSR expressing ECM33 intron/mRNA in EUHSR expressing ACT1 intron)) observed between an EUHSR culture with stable-intron (ECM33) ectopic expression and an EUHSR culture with control-intron (ACT1) ectopic expression are plotted. The distribution of changes for mRNAs of RPGs (green) differed from that of other genes (black), with generally lower expression of RPGs in the culture that overexpresses the stable intron (P = 8.8 × 10⁻³², one-tailed Kolmogorov– Smirnov test; expression cutoff, 1 TPM in both samples). d, Less efficient splicing—as detected by increased intron retention—when overexpressing a stable intron in rapamycin-treated, EUHSR culture. When analyzing the dataset in c, 103 genes had significantly more intron retention when ectopically expressing the stable intron compared to when expressing the control intron (MISO, Bayes factor > 100). The Venn diagram shows the overlap between these genes with increased intron retention and introncontaining RPGs (P = 3.9 × 10⁻²², hypergeometric test).
Figure 1.
Figure 1.. Some excised linear introns accumulate in yeast.
a, Undetectable accumulation of the ACT1 intron. Shown are RNA-seq profiles for ACT1 (thick box, coding sequence; thin box, untranslated region; line, intron; closed circle on intron, BP) in both log-phase and saturated cultures. Plotted for each nucleotide of the locus is the number of reads per million combined exon- and intron-mapping reads of the library. n = 2 biological replicates, b, Accumulation of the ECM33 intron in saturated but not log-phase culture, otherwise as in a. c, Accumulation of intact ECM33 intron in saturated culture. Shown is an RNA blot that resolved total RNA from both log-phase (LP) and saturated (S) cultures and was probed for the ECM33 intron. Migration of markers with lengths indicated (nucleotides) is at the left. For a loading control, the blot was reprobed for 5.8S rRNA. n = 12 biological replicates, d, Accumulation of the SAC6 intron in saturated but not log-phase culture, otherwise as in a. e, Intact SAC6 intron detected by reprobing the RNA blot of c; otherwise, as in c. f, Accumulation of debranched ECM33 intron in saturated culture. Analysis is as in c; except the RNA blot included samples from both WT and dbrlΔ cultures. Migration of the linear isoform is indicated (diagram on the left) as is migration of both the lariat and the circular isoforms (diagrams on the right). n = 3 biological replicates.
Figure 2.
Figure 2.. Stable introns have short BP-3′SS distances
a, Shorter BP-3′SS distances of stable introns. Plotted are cumulative distributions of BP-3′SS distances (P= 1.3 × 10⁻⁹, two-tailed Kolmogorov-Smimov test). b, Causal relationship between BP-3′SS distance and stable-intron formation. The diagram (top) shows WT and mutant (Mut) introns, in which the WT ECM33 BP-3′SS distance was extended from 25 nt (short, red) to 45 nt (long, blue), and the WT ACT1 BP-3′SS distance was shortened from 44 nt (long, blue) to 25 nt (short, red). Below, an RNA blot that resolved samples from the indicated strains and was probed sequentially for the ECM33 intron (top), the ACT1 intron (middle), and 5.8S rRNA. Probes were complementary to portions of introns common to both short and long isoforms. Expected migration of long and short linear isoforms of each intron is at the right. The asterisks (*) mark detection of long-isoform degradation products, which each migrate faster than the short isoform. n = 3 biological replicates.
Figure 3.
Figure 3.. Stable-intron accumulation occurs after prolonged TORC1 inhibition
a, Distinct accumulation patterns of the ECM33 stable intron and its host mRNA. After seeding at OD600 = 0.2, growth was monitored (left), and aliquots were harvested for RNA-blot analysis (right). The blot is as in Fig. 1c, except it utilized a gel designed to resolve longer RNAs. The asterisk (*) marks migration of ECM33 pre-mRNA. b, Accumulation of the ECM33 stable intron in cells cultured with rapamycin. Cultures were seeded at OD600 = 0.2 from an overnight culture, allowed to grow to early log phase, collected by vacuum filtration, and resuspended in fresh media without (lanes 1 and 3) or with (lane 2) 100 nM rapamycin. Cultures were harvested at indicated times and analyzed as in Fig. 1c. n = 6 biological replicates, c, Requirement of rapamycin-sensitive TORC1 for induction of stable introns by rapamycin. Compared are results of a W303a control strain and a W303a strain containing a rapamycin-insensitive allele of TOR1 (TOR1-1). Otherwise, this panel is as in b, except the RNA blot was additionally reprobed for the SAC6 intron. n = 2 biological replicates, d, Undetectable accumulation of the ECM33 intron after 1 h of rapamycin treatment. Accumulation of this intron after 4 h of rapamycin treatment is shown for comparison. Otherwise, this panel is as in Fig. 1a. e, Accumulation of stable introns in cells cultured with 100 nM rapamycin (Rap), 5 mM dithiothreitol (DTT), or 1 µg mL−l tunicamycin (Tm). Otherwise, this panel is as in b, except that the RNA blot was also probed for the SAC6 intron. n = 3 biological replicates, f, Accumulation of stable introns in cells cultured with DTT or tunicamycin despite deletion of IRE1. Otherwise, this panel is as in e. n = 2 biological replicates.
Figure 4.
Figure 4.. Stable introns influence yeast fitness and growth
a, Stable-intron genomic deletions and their estimated effect on total stable-intron molecules. Strains were named using single-letter abbreviations of the genes with deleted introns (color key), b, Altered fitness of the EUHSR strain. Left, co-cultures of WT and EUHSR were diluted every three days (dashed lines). Plotted is the fraction of WT in each co-culture, measured before each dilution and a day after each dilution. Lines for each biological replicate are colored to indicate periods of saturated growth (blue), returning to and exiting rapid growth (orange), and initial post-seeding (black, not considered in calculations). Right, mean fold-change of WT (expressed as log2 (fraction of WT at earlier time point/fraction of WT at later time point)) during periods of saturated growth (blue, n = 10, P = 9.4 × 10⁻⁵, 95% confidence interval 0.12 to 0.25, two-tailed t test) and return to and exit from growth (orange, n = 12, P = 1.0 × 10⁻⁶, 95% confidence interval −0.74 to −0.46, two-tailed t test). Error bars, s.e.m; **, P < 10−4. c, Rapamycin response of strains with fewer stable-intron molecules. Shown are growth curves of WT and deletion strains (color key) in either 0, 100, or 250 nM rapamycin. d, Relationship between depletion of stable-intron molecules and increased growth in 250 nM rapamycin. Inset, control strains in which 1–3 unstable introns were deleted (n= 12 for WT, n = 3 for all other strains; error bars, s.e.m.). e, Rescue of the rapamycin-response defect by the ECM33 intron. Shown are growth curves of WT and EUHSR strains overexpressing either the native (red) or unstable (blue) ECM33 intron cultured in either 0 or 250 nM rapamycin. n = 3 biological replicates, f, Rescue by an engineered ACT1 stable intron. As in e, but expressing either the native (blue) or stable (red) ACT1 intron. g, Stable introns in the TORC1 network.

Comment in

Similar articles

Cited by

References

    1. Koonin EV The origin of introns and their role in eukaryogenesis: a compromise solution to the introns-early versus introns-late debate? Biol Direct 1, 22 (2006). - PMC - PubMed
    1. Irimia M & Roy SW Origin of spliceosomal introns and alternative splicing. Cold Spring Harbor perspectives in biology 6, a016071 (2014). - PMC - PubMed
    1. Nilsen TW & Graveley BR Expansion of the eukaryotic proteome by alternative splicing. Nature 463, 457 (2010). - PMC - PubMed
    1. Cech TR & Steitz JA The noncoding RNA revolution—trashing old rules to forge new ones. Cell 157, 77–94 (2014). - PubMed
    1. Grabowski PJ, Padgett RA & Sharp PA Messenger RNA splicing in vitro: an excised intervening sequence and a potential intermediate. Cell 37, 415–427 (1984). - PubMed

Publication types

MeSH terms