. 2019 Jan;565(7740):505-510.
doi: 10.1038/s41586-018-0858-8. Epub 2019 Jan 16.

Human blood vessel organoids as a model of diabetic vasculopathy

Affiliations

Human blood vessel organoids as a model of diabetic vasculopathy

Reiner A Wimmer et al. Nature. 2019 Jan.

Abstract

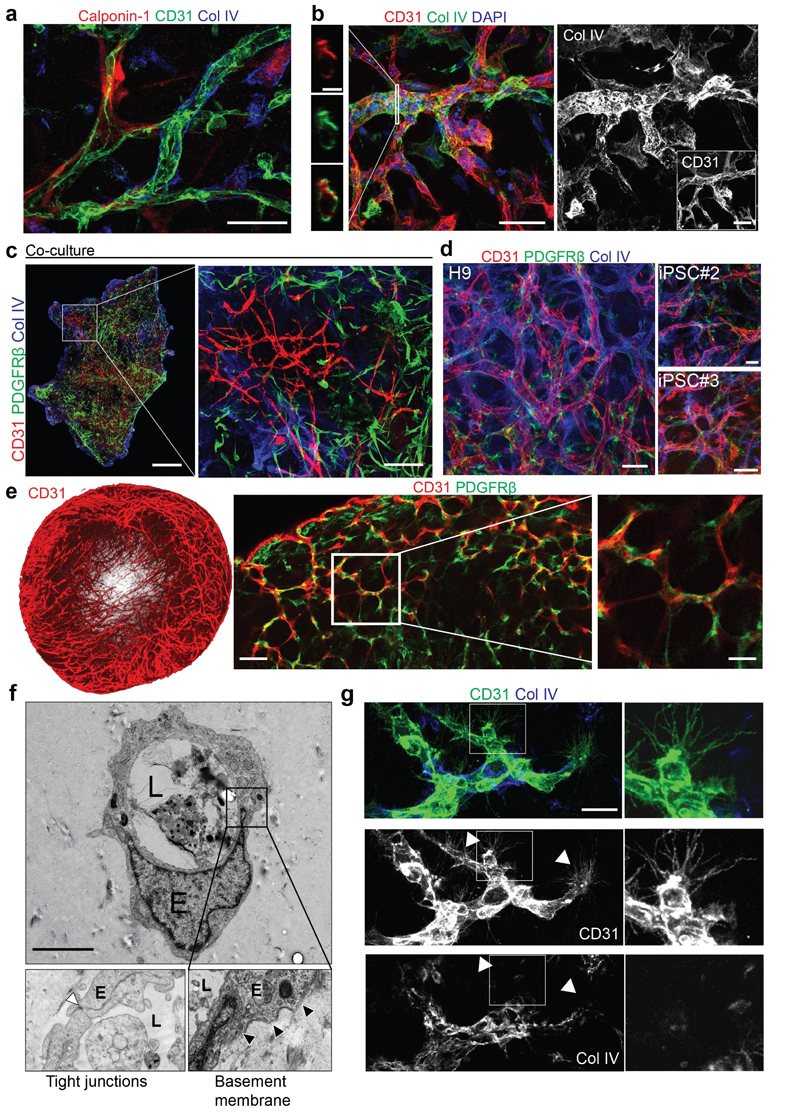
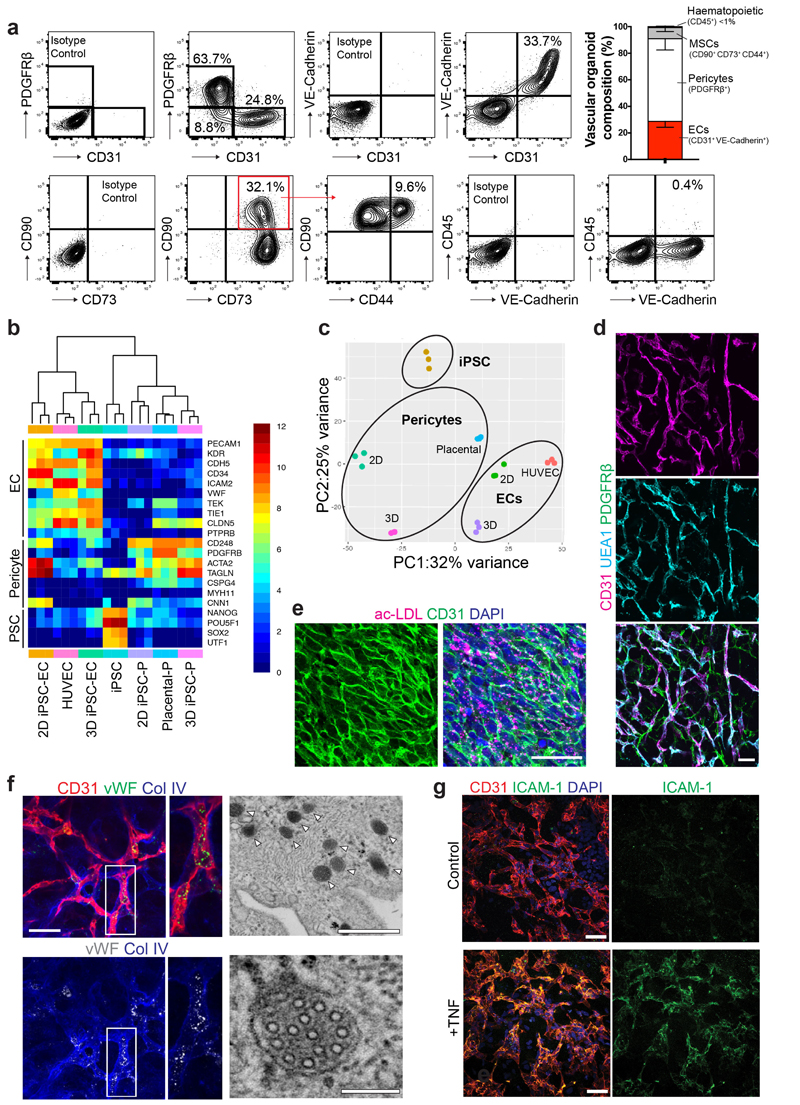
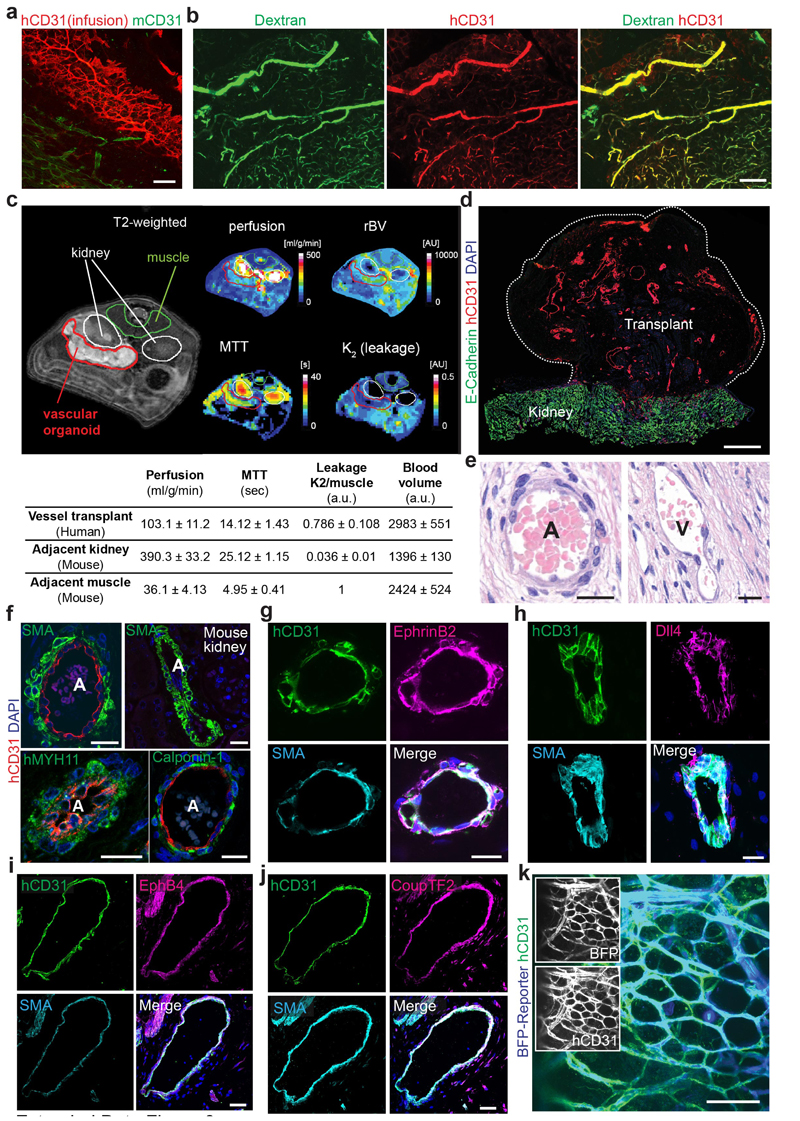
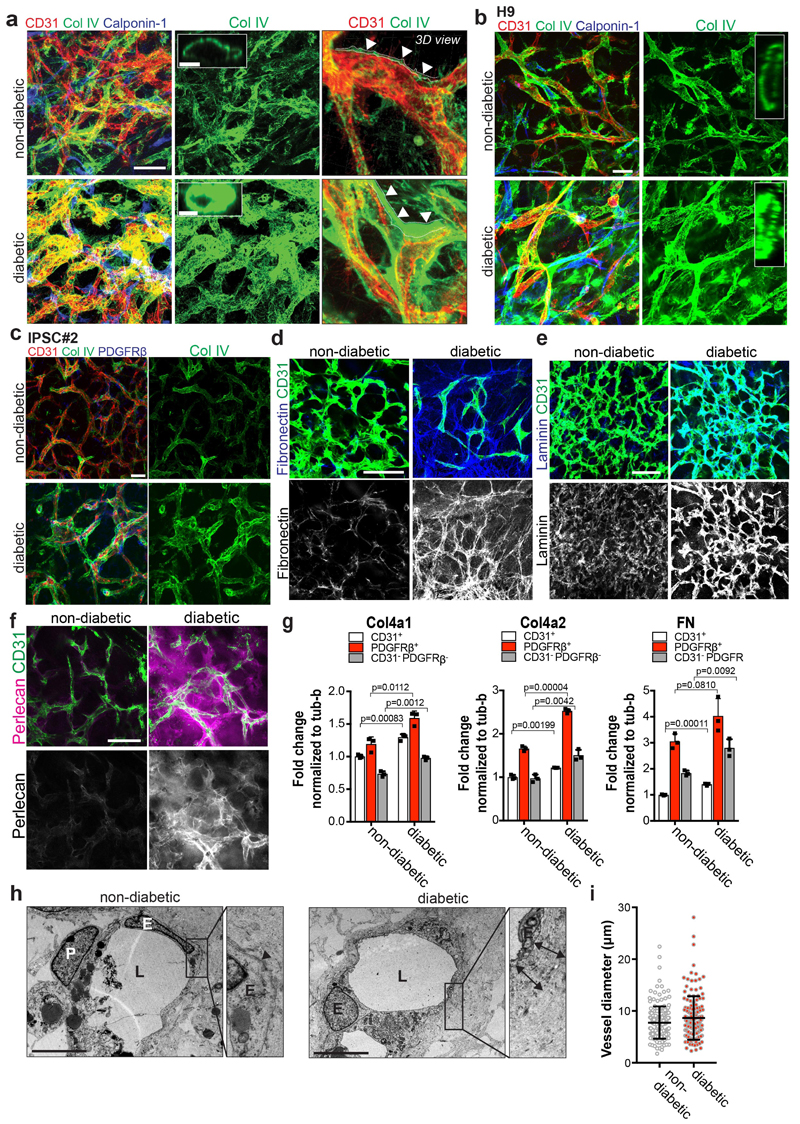
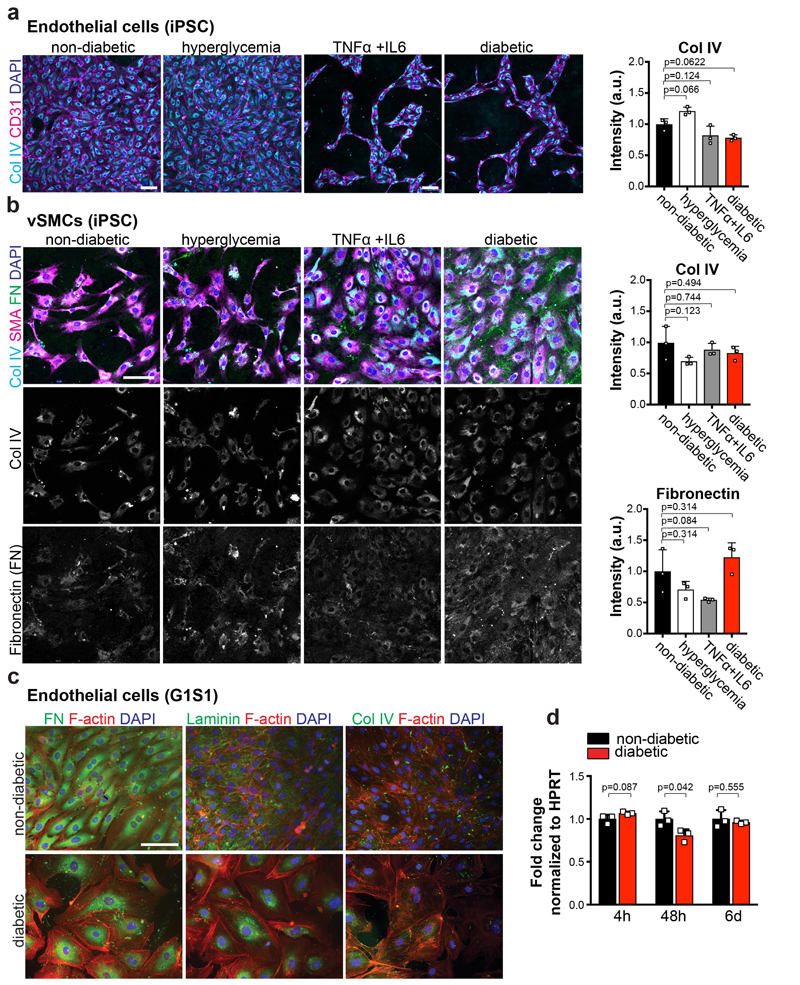
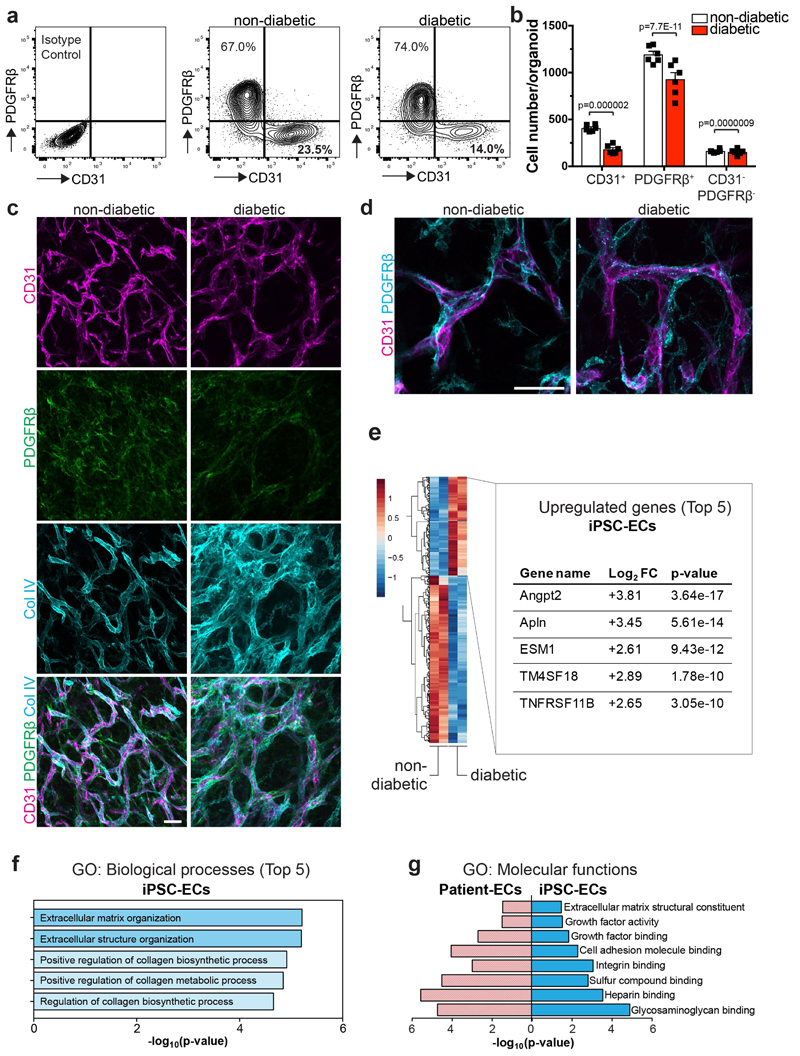
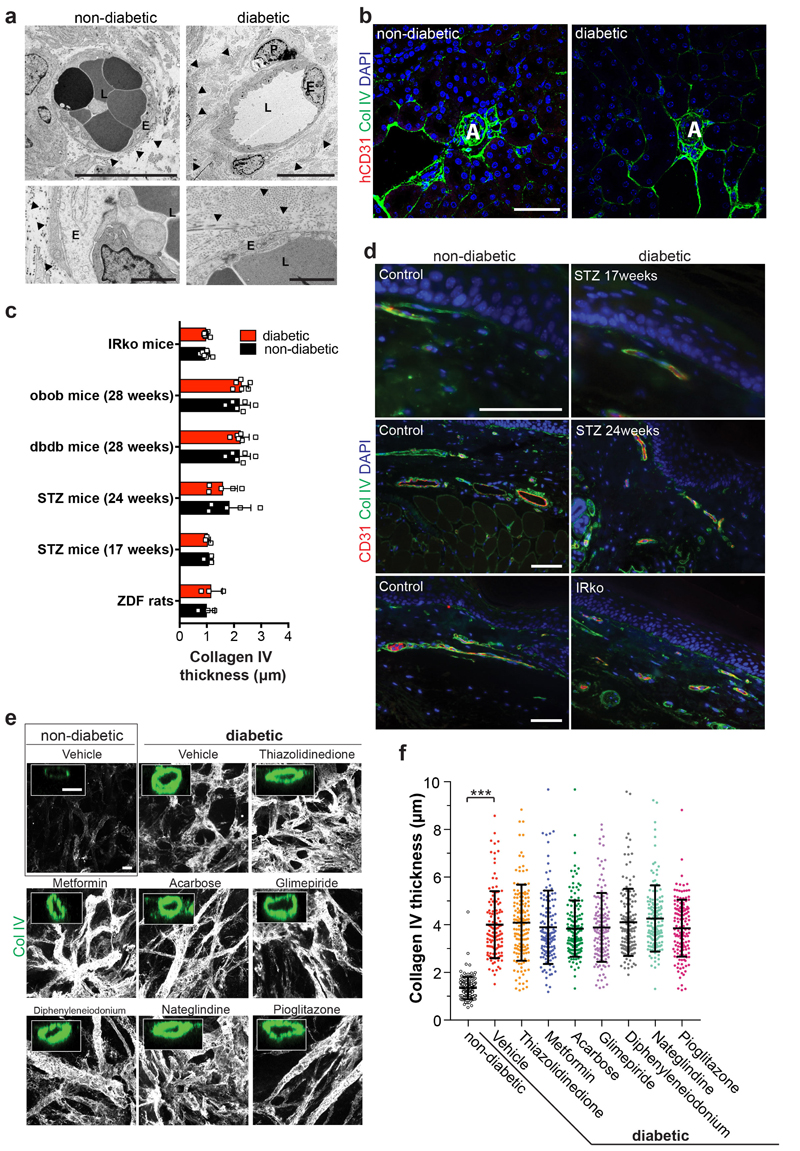
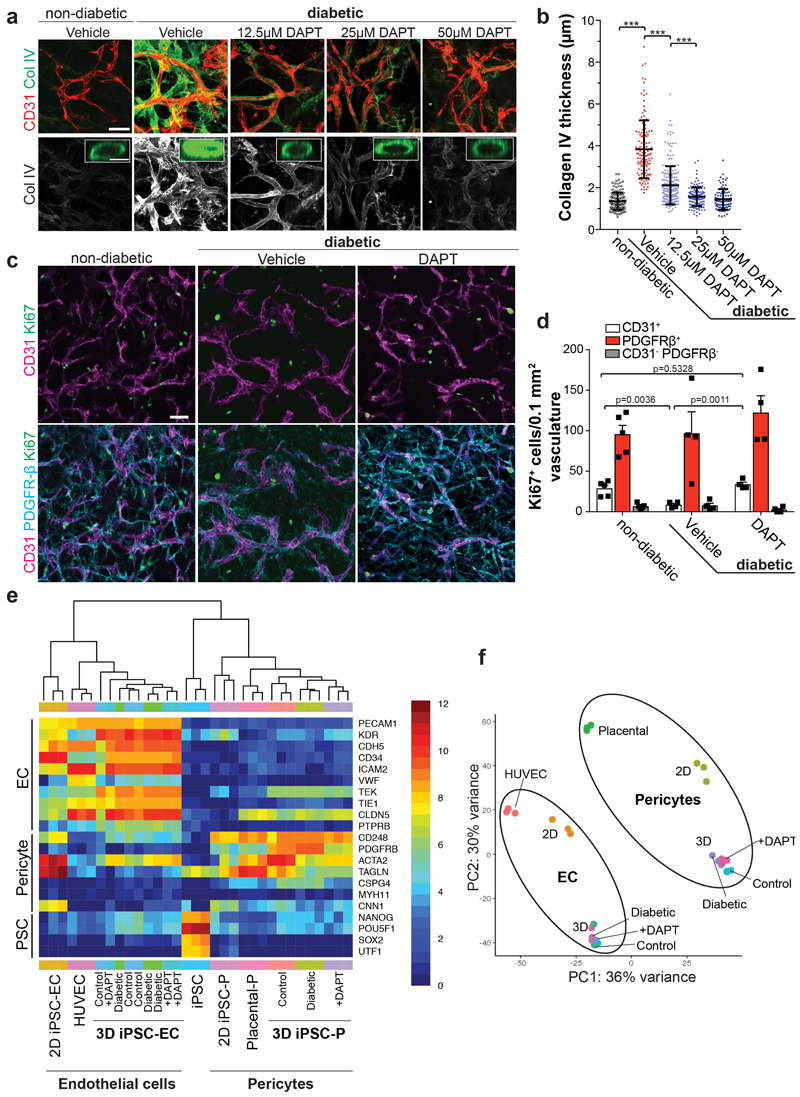
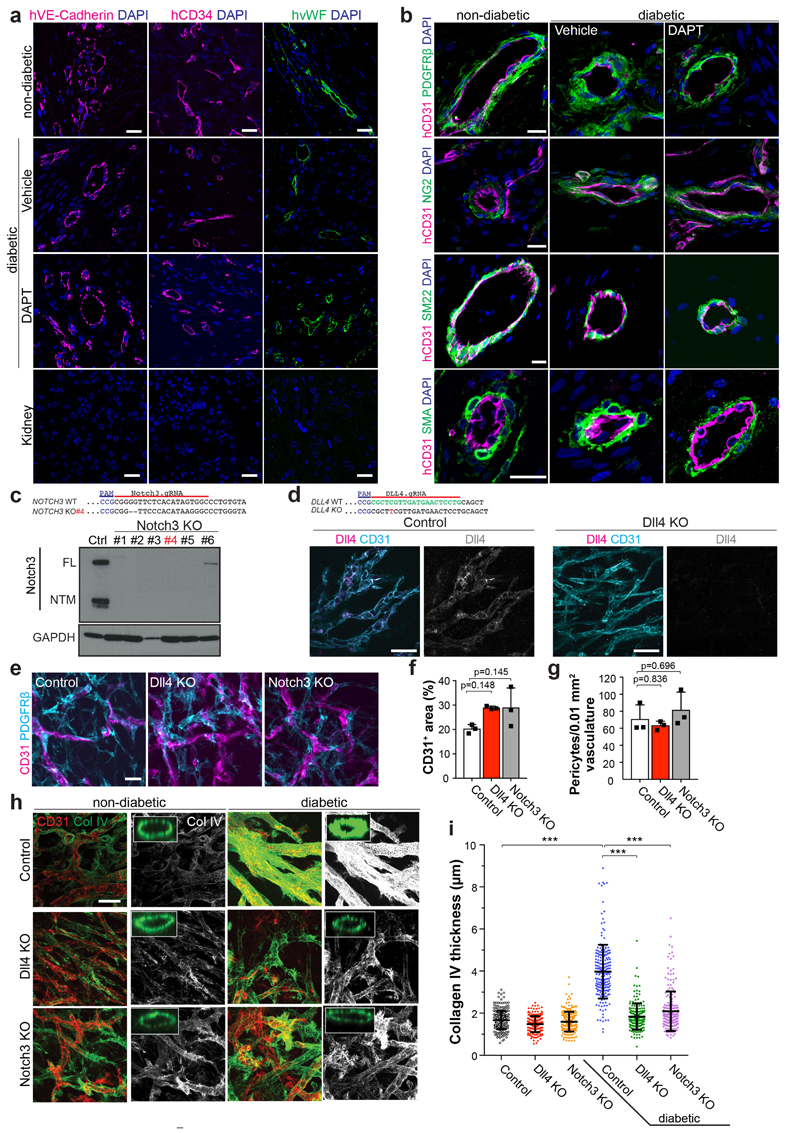
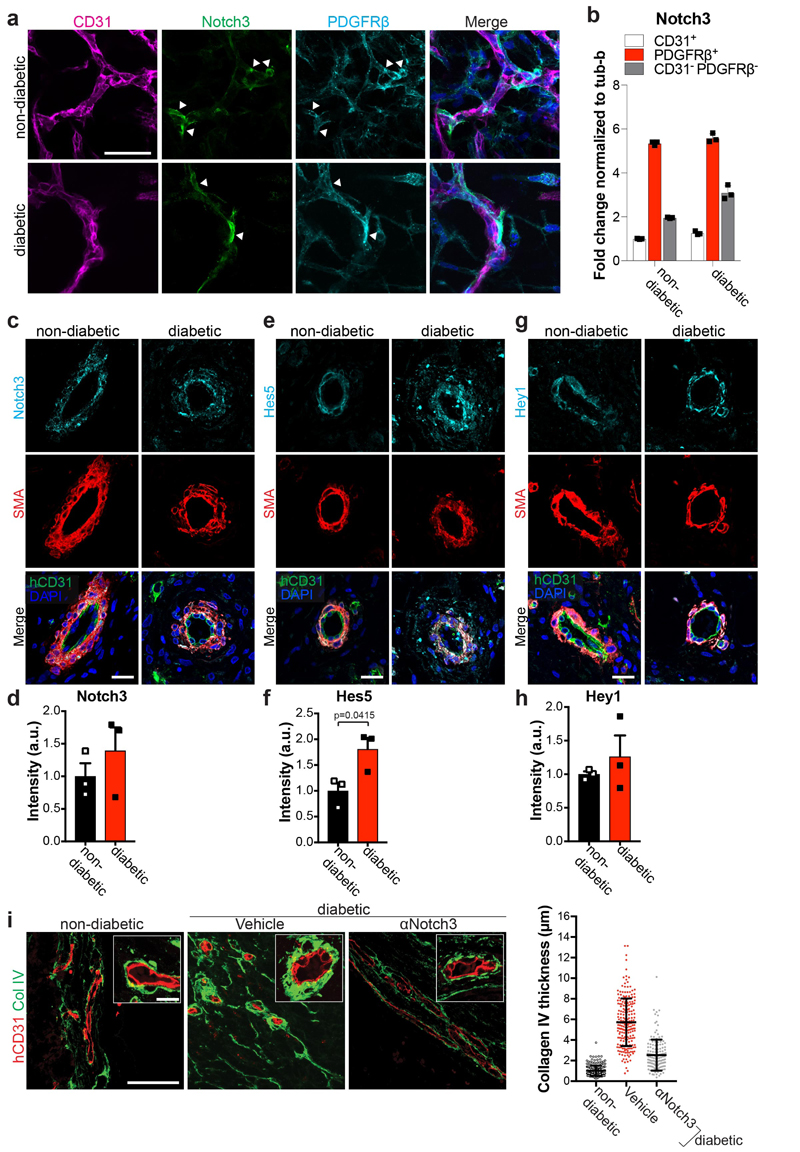
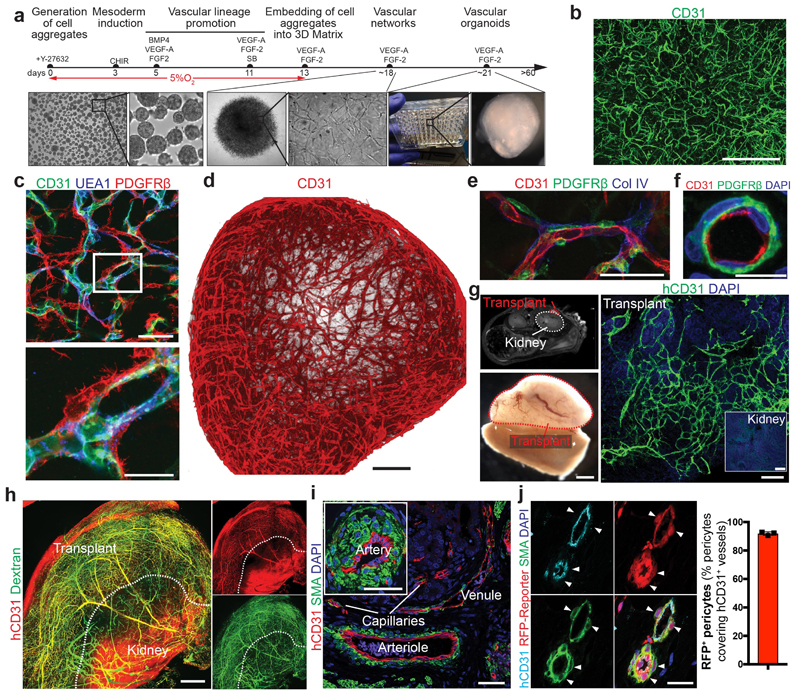
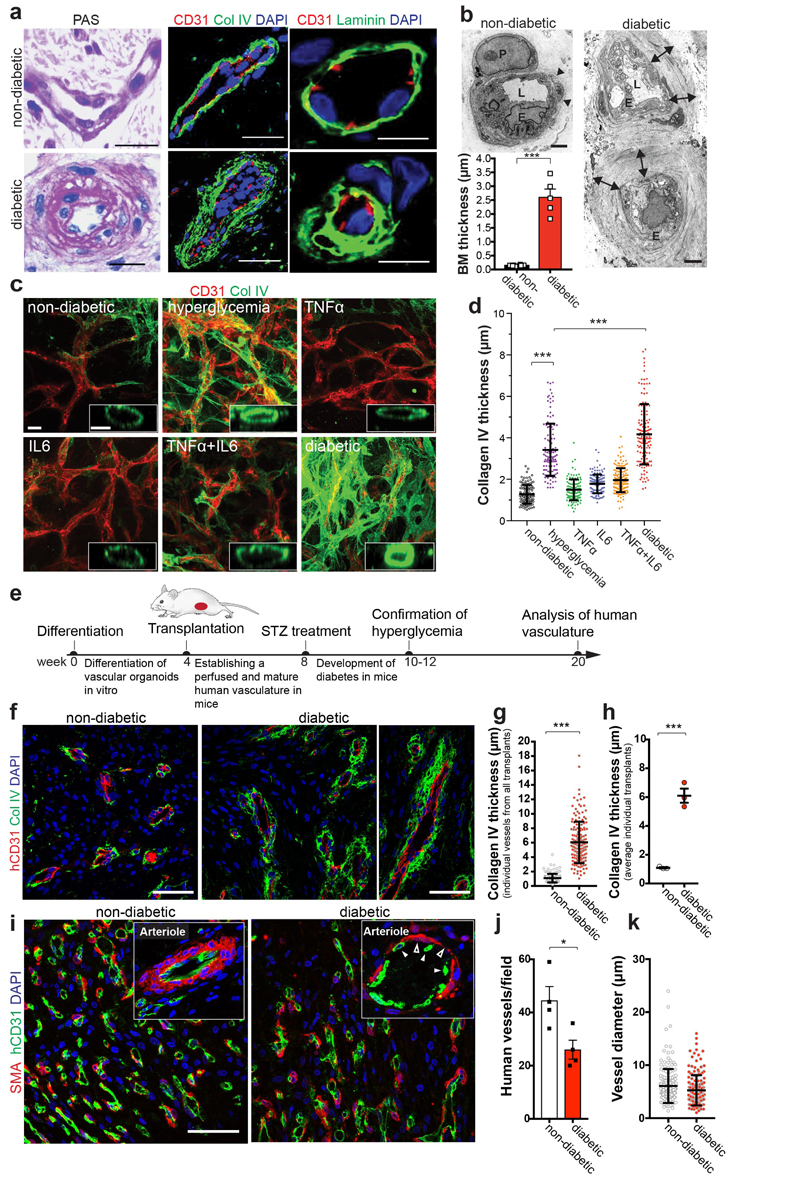
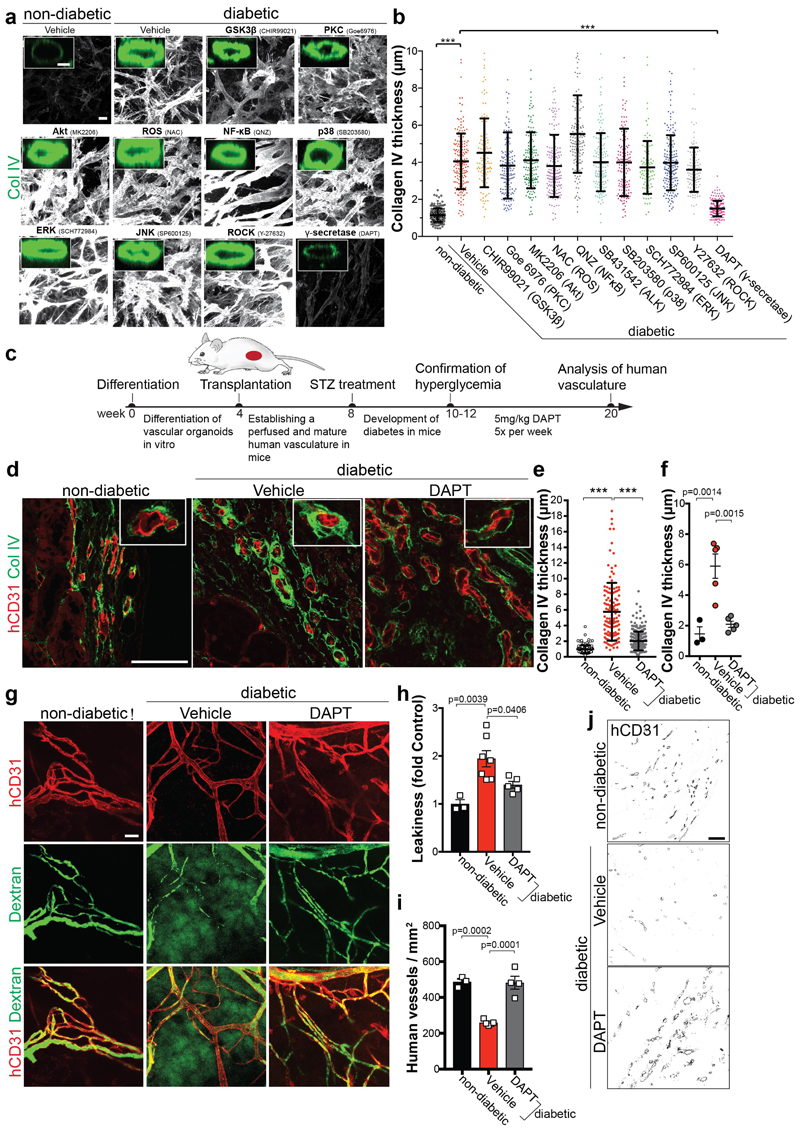
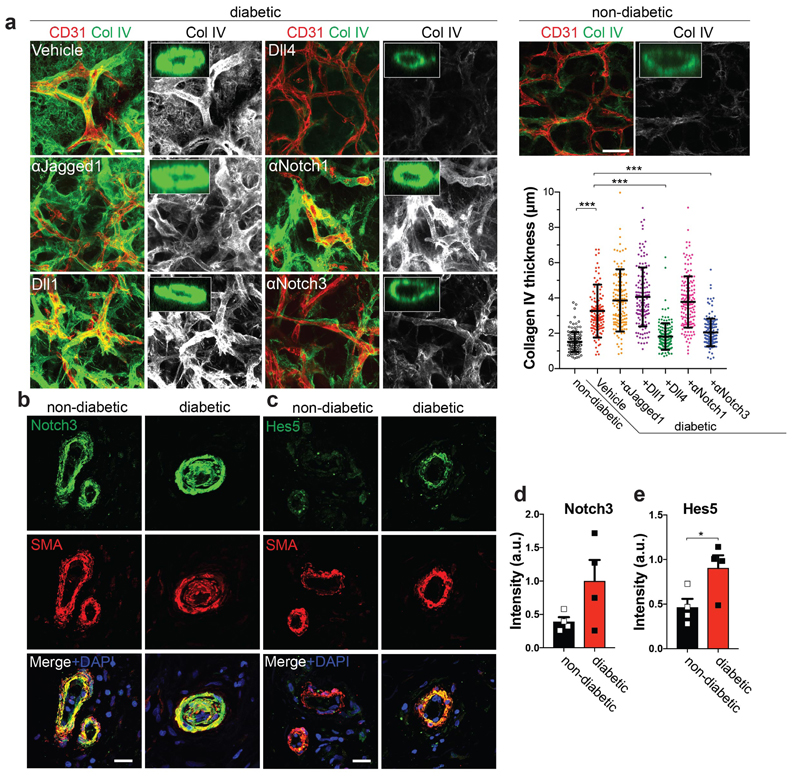
The increasing prevalence of diabetes has resulted in a global epidemic1. Diabetes is a major cause of blindness, kidney failure, heart attacks, stroke and amputation of lower limbs. These are often caused by changes in blood vessels, such as the expansion of the basement membrane and a loss of vascular cells2-4. Diabetes also impairs the functions of endothelial cells5 and disturbs the communication between endothelial cells and pericytes6. How dysfunction of endothelial cells and/or pericytes leads to diabetic vasculopathy remains largely unknown. Here we report the development of self-organizing three-dimensional human blood vessel organoids from pluripotent stem cells. These human blood vessel organoids contain endothelial cells and pericytes that self-assemble into capillary networks that are enveloped by a basement membrane. Human blood vessel organoids transplanted into mice form a stable, perfused vascular tree, including arteries, arterioles and venules. Exposure of blood vessel organoids to hyperglycaemia and inflammatory cytokines in vitro induces thickening of the vascular basement membrane. Human blood vessels, exposed in vivo to a diabetic milieu in mice, also mimic the microvascular changes found in patients with diabetes. DLL4 and NOTCH3 were identified as key drivers of diabetic vasculopathy in human blood vessels. Therefore, organoids derived from human stem cells faithfully recapitulate the structure and function of human blood vessels and are amenable systems for modelling and identifying the regulators of diabetic vasculopathy, a disease that affects hundreds of millions of patients worldwide.


Conflict of interest statement

Author information. Reprints and permissions information is available at www.nature.com/reprints. The authors declare competing financial interests. A patent application related to this work has been filed. Readers are welcome to comment on the online version of the paper.

Figures

Extended Data Figure 1
Extended Data Figure 1. Phenotypical characterization of vascular organoids.
a, Calponin1 positive pericytes are tightly associated with endothelial networks (CD31). Collagen IV (Col IV) staining is used to visualize the basement membrane. b, Formation of a basement membrane is shown by abluminal Col IV deposition. a,b, Experiments were repeated independently n = 10 times with similar results.c, Co-culture of differentiated (NC8) endothelial cells and pericytes in a Collagen 1 / Matrigel matrix. The formed endothelial networks (CD31+), showed only weak interaction with pericytes (PDGFRβ+) and were not enveloped by a Col IV+ basement membrane. Experiments were repeated independently n = 3 times with similar results. d, Successful generation of vascular networks from embryonic stem cells (H9) and two independent iPS cell lines. Note how PDGFR-β+ pericytes are in close proximity to the endothelial tubes (CD31+) and the formation of a Col IV+ basement membrane. Experiments were repeated independently n = 3 times with similar results. e, Vascular organoid generation from H9 cells. Endothelial networks are shown by CD31 staining and pericytes are shown by PDGFRβ. Experiments were repeated independently n = 10 times with similar results. f, Representative electron microcopy of vascular organoids (NC8). Note the generation of lumenized, continuous capillary-like structures with the appearance of tight junctions (white arrowheads) and a basement membrane (black arrowheads). L, lumen; E, endothelial cell. Experiments were repeated independently n = 3 times with similar results. g, Tip cells (arrowheads) identified by CD31+ filopodia mark newly forming vessels. The Col IV+ basement membrane is absent at the site of active angiogenesis. Experiments were repeated independently n = 10 times with similar results. a-g Scale bars: a,b,d,e(left panel)=50μm, c(left panel)=500μm, c(right panel)=100μm), ,e(right panel)=10μm, f=2μm, g=20μm.
Extended Data Figure 2
Extended Data Figure 2. Cellular, molecular and functional characterization of vascular organoids.
a, FACS analysis to determine different cell populations present in vascular organoids (NC8). Endothelial cells were defined as CD31+ VE-Cadherin+, pericytes as PDGFRβ+, mesenchymal stem-like cells (MSCs) by CD90+CD73+CD44+ and hematopoietic cells by CD45+. Bar graphs in the right panels indicate the relative populations of endothelial cells (ECs), pericytes, mesenchymal stem-like cells (MSCs) and hematopoietic cells. Graph represents mean ± S.D from n=3 independent experiments. b, Heatmap of prototypic marker genes for pluripotent stem cells (PSC), pericytes and endothelial cells (ECs). Rows represent genes (log2 TPM+1) and columns are samples. FACS sorted CD31+ endothelial cells (EC) and PDGFRβ+ pericytes (P) from vascular organoids (3D iPSC), from 2D differentiated monocultures (2D iPSC) or primary 2D monocultures (HUVEC, placental pericytes (P)) were analyzed by RNAseq and compared to the parental iPSC line (NC8). Hierarchical clustering of samples demonstrates similar marker gene expression of organoid cells (3D) and primary human cells (HUVEC, Placental-P). n=3 biologically independent samples per cell type were analaysed. c, Principal component analysis (PCA) was performed on samples from b and separates parental iPSC (NC8) from differentiated vascular organoid cells (3D). d, Endothelial cells (CD31) in vascular organoids (NC8) stain also positive for the lectin Ulex europaeus agglutinin 1 (UEA-1). Pericytes are visualized by PDGFRβ staining. Experiments were repeated independently n = 10 times with similar results. e, FACS isolated endothelial cells (CD31+) from vascular organoids take up acetylated low-density lipoprotein (ac-LDL). Experiments were repeated independently n = 3 times with similar results. f, von Willebrand Factor (vWF) expression in endothelial cells (CD31+) from vascular organoids (NC8). Col IV staining is also shown to outline the basement membrane. Right panels show electron microscopy, revealing the appearance of Weibel Palade bodies (white arrowheads). Experiments were repeated independently n = 3times with similar results. g, TNFα-mediated activation of vascular organoids (NC8) revealed by the induction of ICAM-1 expression in endothelial cells (CD31). ICAM-1 induction was determined 24 hours after addition of TNFα (100ng/mL). Experiments were repeated independently n = 3 times with similar results. DAPI was used to counterstain nuclei. Scale bars d,e,f(left panel),g=50μm, f(upper right panel)=500nm, f(lower right panel)=100nm
Extended Data Figure 3
Extended Data Figure 3. Analysis of vascular organoids transplanted into mice.
a, Infusion of the human specific anti-CD31 antibody (i.v.) to label perfused human blood vessels (NC8) transplanted into immunodeficient NSG mice. Murine vessels are visualized by a mouse-specific anti-CD31 antibody (mCD31). b, Functional human vasculature (detected by human-specific anti-CD31 immunostaining, hCD31, red) in mice revealed by FITC-Dextran perfusion (green). a,b, Experiments were repeated independently on n = 3 biological samples, with similar results. c, Representative axial T2-weighted image, blood flow (perfusion), relative blood volume (rBV), mean transit time (MTT) and leakage (K2) measured by MRI. The axial plane was chosen so that both kidneys (outlined in white) and the implant (outlined in red) are visible. The analysed muscle tissue is outlined in green. Quantitative values (mean +/- SD) for perfusion, rBV, MTT and K2 are given in the table. n = 3 mice analysed. d, Representative low magnification image of a transplanted vascular organoid stained for E-Cadherin and human CD31. e, Arteriole (A) and venule (V) phenotypes appearing within the human vascular organoid transplants (NC8). Representative H&E stained histological sections are shown. f, Generation of human arterioles (A) shown by staining for human specific CD31 (endothelial cells), tightly covered with vascular smooth muscle cells (vSMC) detected by SMA, Calponin-1, and human-specific MYH11 immunostaining. As a control, endothelial cells of murine kidney arterioles do not cross react with the human-specific CD31 antibody (right top panel). Samples were also stained with DAPI to determine nuclei. g,h, Arterioles of human origin (hCD31+) express arterial markers EphrinB2 and Dll4. i,j, Human venous structures (hCD31+) show expression of the venous markers EphB4 and CoupTF2. k, BFP-tagged vascular organoids (H9), transplanted into mice, co-stained with human-specific CD31 (hCD31) antibody, revealing human identity. A representative image from n=5 mice is shown. d-k, Experiments were repeated independently on n = 3 biological samples, with similar results. DAPI was used to counterstain nuclei. Scale bars: a=200μm, b,k=100μm, d=500μm e,f,g,h,i,j=20μm, f,g=50μm.
Extended Data Figure 4
Extended Data Figure 4. Basement membrane changes in diabetic vascular organoids
a, High glucose/IL6/TNFα (diabetic) treatment leads to a marked expansion of the Col IV-positive basement membrane lining the human capillaries (NC8). Calponin-1 immunostaining marks pericytes. Insets indicate confocal cross-sections of vessel lumina. Right panels show 3D reconstructions of basement membrane thickening directly coating the CD31+ endothelial tubes. b, Vascular organoids derived from H9 cells display basement membrane thickening (Col IV) upon stimulation with diabetic media as compared to cultures in non-diabetic medium. Endothelial cells were visualized using anti-CD31 immunostaining and pericytes by staining with Calponin-1. c, Basement membrane thickening (Col IV) in vascular organoids from a second iPSC line (IPSC#2) upon cultivation in diabetic media. Endothelial cells were visualized using anti-CD31 immunostaining and pericytes were marked with PDGFRβ. a-c, Experiments were repeated independently n = 5 times with similar results. d,e,f, Increased deposition of the basement membrane components d, fibronectin e, laminin and f, perlecan in diabetic versus non-diabetic vascular organoids (NC8). Endothelial cells were visualized using anti-CD31 immunostaining. Experiments were repeated independently n = 3 times with similar results. g, RT-qPCR of FACS isolated endothelial cells (CD31+), pericytes (PDGFRβ+) and the remaining negative cells (CD31-PDGFRβ-) from vascular organoids cultured for two days in diabetic media or non-diabetic media. Values are normalized to the endothelial (CD31+) fraction and are shown as mean ± S.E.M of 3 biological replicates with 50 organoids per experiment. P-values are indicated in the panel (two-tailed student t-test). h, Representative electron microscopy images of vascular organoids (NC8), cultured under diabetic and non-diabetic conditions, confirm the marked basement membrane thickening upon diabetic treatment. Note multiple layers of basement membrane in the diabetic condition (two-sided arrows) which are not observed in the control organoids (arrowheads). L, lumen; E, endothelial cell; P, pericyte. Experiments were repeated independently n = 3 times with similar results. i, Diameter of CD31 positive vessels were measured in non-diabetic and diabetic vascular organoids. Values are presented as mean ± S.D. n (non-diabetic) = 179 vessels, n (diabetic) = 151 vessels measured from 4 independent experiments. Scale bars: a=50μm a(insert),h=5μm b,c=50μm, d,e,f=100μm
Extended Data Figure 5
Extended Data Figure 5. Mono-cultures of vascular cells in diabetic media
a, iPSC (NC8) derived endothelial cells cultured in non-diabetic conditions, in 75mM D-glucose (hyperglycemia), 1ng/mL TNFα+ 1ng/mL IL6, or diabetic media (hyperglycemia + TNFα+IL6), were stained for CD31 and Col IV. Right panel shows quantification of Col IV intensity of individual cells endothelial cells. The data is presented as mean ± S.D. from n=3 independent experiments. p values are indicated in the panel (One-way ANOVA) b, iPSC (NC8) derived vascular smooth muscle cells (vSMCs) were cultured in the presence of normal medium, hyperglycemia, TNFα+IL6 or diabetic media (hyperglycemia + TNFα+IL6). Cultures were stained for SMA, Col IV and Fibronectin (FN). Col IV and FN intensity of individual cells was quantified. The graph represents mean ± S.D. from n=3 independent experiments. P-values are indicated in the panel (One-way ANOVA) c, G1S1 endothelial cells were cultured in non-diabetic normal media and diabetic media (hyperglycemia + TNFα+IL6) and stained for Fibronectin (FN), Laminin or Collagen IV (Col IV). Phalloidin was used to visualize the actin cytoskeleton. Experiments were repeated independently n = 3 times with similar results. d, Col4a1expression was measured by RT-qPCR from G1S1 cells cultured in non-diabetic and diabetic media for different time points, as indicated. Expression was normalized to HPRT expression. n=3 independent experiments. P-values are indicated in the panel (Two-tailed t-test) Scale bars a,b,c=100μm.
Extended Data Figure 6
Extended Data Figure 6. Analysis of diabetic vascular organoids.
a,b FACS analysis of vascular organoids (NC8) cultured in non-diabetic or diabetic media. a, Representative FACS plots of endothelial cells (CD31+) and pericytes (PDGFRβ+) from diabetic and non-diabetic control vascular organoids. Experiments were repeated independently n = 6 times with similar results. b, Quantification of numbers of CD31+ endothelial cells, PDGFRβ+ pericytes and CD31-PDGFRβ- cells in diabetic and non-diabetic organoids. The graph represents mean ± S.E.M. of n=6 independent experiments. P-values are indicated in the panel (two-tailed student t-test). c,d, Pericyte (PDGFRβ) association with endothelial networks (CD31) in vascular organoids is shown for non-diabetic and diabetic condition in representative images. Note again in c the increase in Collagen IV (Col IV) deposition around the endothelium under diabetic conditions. Experiments were repeated independently n = 5 times with similar results. e, Transcriptome analysis of CD31+ endothelial cells (iPSC-ECs), FACS sorted from vascular organoids (NC8) cultured under diabetic (hyperglycemia/IL6/TNFα) and non-diabetic control conditions. Heat maps of differentially expressed genes and the top 5 upregulated genes (ranked by p-value) are shown for two independent organoids cultures for each condition. f, GO:biological processes of upregulated genes are shown for iPSC-ECs, FACS sorted from vascular organoids (NC8) cultured under diabetic and non-diabetic control conditions. g, GO:Molecular function terms comparing upregulated genes from CD31+ IPSC-ECs from diabetic blood vessel organoids and type II patient-derived dermal endothelial CD31+ cells (Patient-ECs) are plotted with their respective p-value. Upregulated genes in patients were derived from sorted CD31+ endothelial cells from type II diabetes patients compared to those from non-diabetic individuals. f,g, n=2 biologically independent iPSC-EC samples per group, n=4 independent patients per group were sequenced. P-values were calculated on DEGs using Enrichr software (Fisher Exact test).
Extended Data Figure 7
Extended Data Figure 7. Diabetic vascular basement membrane in vivo and treatment of diabetic vascular organoids with common diabetic drugs
a, Electron microscopy of transplants isolated from control normoglycemic or diabetic mice. Note the increased thickness and density of collagen fibrils (triangles) around the human vessels of the diabetic mice. L, Lumen; E, endothelial cell; P, Pericyte. Triangles indicate the basement membrane. Experiments were repeated independently on n = 4 biological samples, with similar results. b, Col IV stainining of the mouse kidney (adjacent to the human transplant) reveals no basement membrane thickening of endogenous vessels at 10 weeks after STZ induction (diabetic). Note the lack of cross reactivity of the human specific CD31 antibody with the renal mouse endothelium. Experiments were repeated independently on n = 3 biological samples, with similar results. c, Quantification of the basement membrane thickness of dermal blood capillaries in the indicated rat and mouse models of diabetes as compared to their non-diabetic control cohorts. See Supplementary Table 2 for details. Data are shown as mean values ± SD of analyzed blood vessels. ob/ob, db/db mice n=5, IRKO mice n=7, STZ mice (17 weeks) n=3, STZ mice (24 weeks) n=5, ZDF rats n=3. Age matched C57 BL/KsJ and C57 BL/Ks WT mice were used as controls. For the ZDF rat model, heterozygous rats (fa/+) were used as controls. Basement membrane thickening was determined based on morphometric analyses of Collagen IV immunostaining. d, Representative images of skin sections of various diabetic mouse models and respective controls stained for Col IV to visualize the basement membrane and CD31 to visualize endothelial cells. Experiments were repeated independently on n = 5 biological samples, with similar results. e, Human blood vessel organoids (NC8) were cultured in vitro under diabetic condition and treated with commonly prescribed diabetic drugs. The changes in vascular basement membrane deposition were anlaysed by Collagen IV (Col IV) stainings. Insets indicate confocal cross-sections of luminal vessels covered by Col IV. Experiments were repeated independently n = 3 times with similar results. f, Optical cross-sections of Collagen IV (Col IV) stainings were used to quantify basement membrane thickening. Each lumenized vessel is shown as a dot. Means are shown as centre bars ± SD. Non-diabetic n=142, Vehicle n=124, Thiazolidinedione n=156, Metformin n=137, Acarbose n=152, Glimepiride n=136, Diphenyleneiodonium n=141, Nateglindine n=152, Pioglitazone n=142 individual lumens were analyzed for each experimental condition from 3 independent biological replicates. *** p<0.0001 (One-way ANOVA). Drug doses and cultured conditions are described in the methods. Scale bars a(upper panel)=10μm, a(lower panel)=2μm b,d=50μm, e=20μm, e(insert)=10μm
Extended Data Figure 8
Extended Data Figure 8. DAPT treatment of diabetic vascular organoids.
a, Representative images of vascular organoids cultured in diabetic media in the presence of vehicle or varying doses of the γ-secretase inhibitor DAPT. Endothelial networks are shown by CD31 and the basement membrane is visualized by Collagen IV (Col IV) staining. Experiments were repeated independently n = 3 times with similar results. b, Quantification shows Collagen IV thickness of non-diabetic n=136, Vehicle n=126, 12.5μM DAPT n=208, 25μM DAPT n=142, 50μM DAPT n=96 lumen structures (dots) from 5 organoids (NC8) per condition exposed to vehicle of different doses of DAPT. The graph represents mean ± S.D. *** p<0.0001 (One-way ANOVA). c,d, Proliferation of endothelial cells (CD31) and pericytes (PDGFRβ) in diabetic and DAPT treated vascular organoids. c, Vascular organoids treated with indicated conditions were co-stained for endothelial cells (CD31), pericytes (PDGFRβ) and Ki67 to mark proliferating cells. Experiments were repeated independently n = 3 times with similar results. d, Quantification of Ki67 positive (proliferative) endothelial cells (CD31+), pericytes (PDGFRβ+) and CD31- PDGFRβ- cells in vascular organoids under diabetic and DAPT treated conditions. The graph represents mean ± S.D of n=4 (Vehicle, DAPT), n=5 (non-diabetic) vascular organoids. P-values are indicated in the panel (One-way ANOVA). e, Heatmap of prototypic marker genes for pluripotent stem cells (PSC), pericytes and endothelial cells (ECs). Rows represent genes (log2 TPM+1) and columns are samples. FACS sorted CD31+ endothelial cells (EC) and PDGFRβ+ pericytes (P) from non-diabetic (Control), diabetic (Diabetic) or DAPT treated diabetic (+DAPT) vascular organoids (3D iPSC), from 2D differentiated monocultures (2D iPSC) or primary 2D monocultures (HUVECS, placental pericytes (P)) were analyzed by RNAseq and compared to the parental iPSC line (NC8). Hierarchical clustering of samples shows similar marker gene expression of human primary endothelial cells (HUVEC) and pericytes (Placental-P) and organoid endothelial cells and pericytes cultured under non-diabetic (Control) or diabetic conditions in the absence (Diabetic) or presence (+DAPT) of the γ-secretase inhibitor DAPT. f, Principal component analysis (PCA) was performed on samples from e. The close clustering of untreated (Control) and diabetic endothelial cells and pericytes in the absence (Diabetic) or presence of DAPT (+DAPT) shows that cells within the vascular organoids maintain their differentiated cell fate. e,f, n=3 biologically independent samples per cell type and treatment were analaysed. Scale bars a,c=50μm, a(insert)=5μm
Extended Data Figure 9
Extended Data Figure 9. DAPT treatment of vascular organoids in vivo and Dll4 and Notch3 knock out vascular organoids
a,b, Analysis of vascular organoids transplanted into non-diabetic or diabetic STZ mice treated with vehicle or DAPT. a, Transplanted human blood vessels into diabetic STZ mice ± DAPT treatment were stained for human specific endothelial markers VE-Cadherin (hVEC), CD34 (hCD34) and vWF (hvWF). Note the absence of signal in the adjacent mouse kidney. b, Transplanted human blood vessels into diabetic STZ mice ± DAPT treatment were stained for the pericyte specific markers PDGFRβ, NG2, SM22 and SMA. Co-staining with a human specific CD31 (hCD31) antibody was used to identify human blood vessels. a,b, Experiments were repeated independently on n = 3 biological samples, with similar results. c,d, CRISPR/Cas9 genome editing was used to generate DLL4 and NOTCH3 knock out iPSCs (NC8). Single guide RNAs (sgRNAs) are indicated in the NOTCH3/DLL4 sequence as well as generated indels. c, Western blot shows ablation of Notch3 expression in target iPSCs. Clone #4 (red) was used for functional assays. FL, full length Notch3; NTM, transmembrane Notch3 subunit. d, Immunostaining in control vascular organoids shows expression of Dll4 in endothelial cells (CD31+) but not in CRISPR/Cas9 genome edited iPSCs. c,d, Experiments were repeated independently n = 2 times with similar results. e, Vascular organoids differentiated from Dll4 KO and Notch3 KO iPS cells (NC8) were stained for endothelial cells (CD31) and pericytes (PDGFRβ). Experiments were repeated independently n = 3 times with similar results. f, Quantification of endothelial networks (CD31+ area) in Dll4 KO and Notch3 KO vascular organoids. Graph represents mean ± S.D. from n=3 independent experiments. P-values are indicated in the panel (One-way ANOVA). g, Quantification of pericyte number in Dll4 KO and Notch3 KO vascular organoids. Graph represents mean ± S.D. from n=3 independent experiments. P-values are indicated in the panel (One-way ANOVA). h, Representative images of basement membranes stained for Collagen IV (Col IV) from control, Dll4 KO, and Notch3 KO vascular organoids (NC8 iPSCs) exposed to hyperglycemia/IL6/TNFα (diabetic) or maintained under standard culture conditions (non-diabetic). Experiments were repeated independently n = 3 times with similar results. i, Thickness of continuously surrounded lumina by Col IV was measured in optical cross-sections. Each individual measurement from a lumenized vessel is shown as a dot in the right panel. A total of non-diabetic (Control n=265, Dll4 KO n=203, Notch3 KO n=215) and diabetic (Control n=214, Dll4 KO n=187, Notch3 KO n= 206) lumina were analysed for each experimental condition from 3 independent biological replicates with equal sample size. Means are represented as centre bars ± SD. *** p<0.001 (One-way ANOVA). Scale bar a,b,e=20μm, d,h=50μm
Extended Data Figure 10
Extended Data Figure 10. Notch3 expression and signaling in vascular organoids
a, Vascular organoids were cultured under non-diabetic or diabetic conditions and co-stained for Notch3, endothelial cells (CD31) and pericytes (PDGFRβ). Predominant localization of Notch3 in pericytes is indicated by the white arrowheads. Experiments were repeated independently n=3 times with similar results.b, RT-qPCR of endothelial cells (CD31+), pericytes (PDGFRβ+) and the remaining CD31- PDGFRβ- cells shows highest Notch3 in pericytes. Graph represents mean ± S.E.M. from 3 independent experiments. c-h, Human vascular organoids transplanted into non-diabetic control or diabetic STZ mice were analysed for Notch3 expression and the Notch downstream targets Hes5 and Hey1. Histological sections of transplanted human blood vessels were stained for c, Notch3, e, Hes5 or g, Hey1 and co-stained for SMA (pericytes) and hCD31 (human endothelium). Note the localization of Notch3, Hes5 as well as Hey1 to SMA positive pericytes. Experiments were repeated independently on n = 3 biological samples, with similar results. Quantification of d, Notch3, f, Hes5 and h, Hey1 expression. Pericytes were segmented using SMA and the intensity of immunofluorescence signal for each marker was measured. Graph represents mean ± S.E.M from n = 3 mice. P-value is indicated in the panel (two tailed student t-test). i, Diabetic mice transplanted with human vascular organoids (H9 ESCs) were treated with a Notch3 blocking antibody. Basement membrane thickness of individual human blood vessels (hCD31+) of non-diabetic n= 223, non-diabetic+Vehicle =212 and diabetic+αNotch3 n=143 was determined based on Col IV staining from n = (non-diabetic=3, diabetic + Vehicle=3, diabetic + αNotch3=2) mice. Mean is shown as centre bar ± SD. Scale bar a,c,e,g,i=50μm
Figure 1
Figure 1. Generation and engraftment of human vascular organoids from human stem cells.
a, Schematic of human pluripotent stem cell differentiation into vascular organoids. b, Representative immunofluorescence of CD31 expressing endothelial cells shows establishment of vascular networks (NC8). c, Endothelial networks (CD31, UEA-1) are covered by pericytes (PDGFRβ) (NC8). d, 3D reconstruction of capillary organization (CD31) in a vascular organoid (NC8). e, Endothelial tubes (CD31) in vascular organoids (NC8) covered by pericytes (PDGFRβ) and a basement membrane (Col IV). f, Cross section of a vascular organoid capillary. b-f, Experiments were repeated independently n = 10 times with similar results. g, Transplantation of human vascular organoids (NC8) into NSG mice. Top left panel indicates site of transplantation using MRI. Lower left panel shows an entire transplant after isolation. The organoid derived vasculature is visualized by a human-specific anti-CD31 antibody (hCD31) (Transplant). h, Functional human vasculature (hCD31) in mice revealed by FITC-Dextran perfusion. i, Generation of human arteries, arterioles, capillaries and venules in transplanted human organoids (NC8) shown by staining for hCD31 and SMA. h,i, Experiments were repeated independently on n = 5 biological samples, with similar results. j, Transplanted blood vessel organoids stably expressing RFP (H9). Co-staining with human specific anti-CD31 and anti-SMA shows human origin of endothelial cells and pericytes (triangles). Experiments were repeated independently on n = 3 biological samples, with similar results. Mean ± S.E.M. of RFP positive pericytes (RFP+SMA+) covering human endothelium (hCD31+). n=3 transplants. Scale bars b,h=500μm, c,e,i=50μm, , d=200μm, f=10μm, g(lower left panel)=1mm, g(right panel)=100μm, j=20μm. DAPI is shown to image nuclei.
Figure 2
Figure 2. Modelling diabetic microvasculopathy in human blood vessel organoids.
a, Basement membrane thickening of dermal capillaries in skin biopsies of late-stage type 2 diabetic patients shown by PAS (left), Col IV and laminin stainings. Experiments were repeated independently on n = 5 biological samples, with similar results. b, Representative electron microscopy of dermal capillaries of late-stage type 2 diabetic patients. Note the abnormally thick basement membrane in diabetic patients (two-sided arrows) as compared to non-diabetic controls (arrowheads). L, lumen; E, endothelial cell; P, pericyte. Bar graph shows quantification of basement membrane thickening (mean ± S.E.M.). Non-diabetic n=8 and diabetic n=5 independent patients. *** p=0.0000002 (unpaired, two-tailed t-test). c, Representative images of basement thickening (Col IV staining) (NC8). Experiments were repeated independently n = 3 times with similar results. d, Vessel cross-sections were used to quantify basement membrane thickening (ColIV); non-diabetic, TNFα n=120, high glucose n=120, IL-6 n=139, TNFα+IL6 n=151, diabetic n=134 lumina were analysed from 3 independent biological replicates with equal sample size (NC8). Mean ± SD. ***p<0.0001 (One-way ANOVA). e, Schematic of human vascular organoid transplantion and diabetes induction in NSG mice. f, Increased collagen type IV (Col IV) deposits around human CD31+ blood vessels in STZ treated mice (diabetic). Experiments were repeated independently on n = 6 biological samples, with similar results. g, Col IV thickness of individual human blood vessels (hCD31+) (non-diabetic, n=164, diabetic, n=170). Mean ± SD. *** p=9.64E-66 two-tailed student t-test. h, Graph shows mean Col IV thickness of n=3 mice per condition. Means ± S.E.M. *** p=0.00052 two-tailed student t-test i, Representative sections stained for human endothelial cells (hCD31+) and SMA to visualize mural cell coverage. The round cell shape (open arrowheads) and gaps in diabetic arterioles (filled arrowheads) indicates cell death. Experiments were repeated independently on n = 4 biological samples, with similar results. j, Quantification of human blood vessels/field as shown in i. n=4 mice per treatment and 7-10 fields analysed per mouse; Mean ± S.E.M. *p=0.027 two-tailed student t-test. k, Quantification of transplanted human vessel (hCD31+) (non-diabetic n=176, diabetic n=172 from n=4 animals per condition); Mean ± SD. Scale bars a(left,middle panel),c=20μm, a(right panel),c(insert)=5μm, b=2μm, f,i=50μm
Figure 3
Figure 3. Inhibition of γ-secretase abrogates diabetic microvasculopathy of human blood vessel organoids.
a, Representative images of basement membranes in diabetic blood vessels (NC8) treated with small molecule inhibitors of various signaling pathways. Insets show confocal cross-sections of individual vessels surrounded by collagen type IV (Col IV). Experiments were repeated independently n=3 times with similar results. b, The thickness of the Col IV+ coat of individual vessels was measured in optical cross-sections. Non-diabetic n=171, Vehicle n=172, CHIR99021 n=110, Goe 6976 n=156, MK2206 n=165, NAC n=193, QNZ n=147, SB431542 n=151, SB203580 n=148, SCH772984 n=96, SP600125 n=183, Y27632 n=122, DAPT n=196 individal lumina were analysed from 3 independent biological replicates with equal sample size. Mean ± S.D.*** p<0.0001 (One-way ANOVA). c, Schematic of vascular organoid transplantion (H9) and treatment of mice. d, Basement membrane thickening (Col IV) around human blood vessels (hCD31) is greatly prevented by DAPT treatment. Experiments were repeated independently on n = 3 biological samples, with similar results. e, Col IV thickness of individual human blood vessels (hCD31+) in non-diabetic and STZ-induced diabetic mice ± DAPT treatment. Non-diabetic n=132, Vehicle n=131, DAPT n=271. Mean ± SD. *** p<0.0001 (One-way ANOVA). f, Means ± SD of Col IV thickness of human blood vessels (hCD31+) from individual transplants. Non-diabetic n=3, Vehicle, DAPT n=5. (One-way ANOVA). g, Vascular permeability assessed by i.v. injection of FITC-Dextran and co-staining with hCD31 to visualize the human vasculature. Note the diffuse FITC signal in the diabetic mice (Vehicle) which indicates vessel leakage. Experiments were repeated independently on n = 3 biological samples, with similar results. h, Quantification of vessel leakage determined by FITC-Dextran extravasation. Mean ± S.E.M. n= (non-diabetic=3, diabetic + Vehicle control=7, diabetic + DAPT =5) mice. (One-way ANOVA). i, Quantification of human blood vessel density in transplanted vascular organoids. Mean ± S.E.M. n= (non-diabetic=3, diabetic + Vehicle=5, diabetic + DAPT=4) mice. *** Non-diabetic vs Vehicle p=0.0002, Vehicle vs DAPT p=0.0001 (One-way ANOVA). j, Representative images of human CD31+ blood vessel density. Experiments were repeated independently on n = 3 biological samples, with similar results. Scale bars, a=20μm, a(insert)=5μm, c,f,i=50μm.
Figure 4
Figure 4. Identification of Dll4-Notch3 as driver for diabetic vascular basement membrane thickening.
a, Representative images of Col IV in diabetic blood vessel organoids (NC8), treated with antibodies against Jagged-1, Notch1, Notch3, or recombinant Dll1 and Dll4. The thickness of the Col IV+ coat of vessels was measured in optical cross-sections. Non-diabetic n=132, Vehicle n=139, α-Jagged1 n=141, Dll1 n=132, Dll4 n=153, α-Notch1 n=156, α-Notch3 n=156 lumina were analysed from 3 independent biological replicates with equal sample size. Mean ± SD. *** p<0.0001 (One-way ANOVA). b, Dermal blood vessels of T2D patients (diabetic) and healthy controls (non-diabetic) were stained for Notch3 and SMA. c, Hes5 and SMA were co-stained in dermal sections of T2D patients (diabetic) and non-diabetic controls. Note the strong Hes5 signal in pericytes (SMA) of diabetic patients. d,e, Quantification of Notch3 and Hes5 expression data from c and d. Mean ± S.E.M of n = (non-diabetic =4, diabetic=4) independent patients. * p=0.043 two-tailed student t-test. Scale bars a=50μm, b,c=20μm.

Comment in

Similar articles

Cited by

References

    1. World Health Organization. Global Report on Diabetes. 2016 ISBN 978.
    1. Bianchi E, et al. Age and diabetes related changes of the retinal capillaries: An ultrastructural and immunohistochemical study. Int J Immunopathol Pharmacol. 2016;29:40–53. - PMC - PubMed
    1. Roy S, Ha J, Trudeau K, Beglova E. Vascular Basement Membrane Thickening in Diabetic Retinopathy. Curr Eye Res. 2010;35:1045–1056. - PubMed
    1. Fowler MJ. Microvascular and macrovascular complications of diabetes. Clin Diabetes. 2011;29:116–122.
    1. Eelen G, De Zeeuw P, Simons M, Carmeliet P. Endothelial cell metabolism in normal and diseased vasculature. Circulation Research. 2015;116:1231–1244. - PMC - PubMed

Publication types

MeSH terms

Substances