

Automated Tumour Recognition and Digital Pathology Scoring Unravels New Role for PD-L1 in Predicting Good Outcome in ER-/HER2+ Breast Cancer
- PMID: 30651729
- PMCID: PMC6311859
- DOI: 10.1155/2018/2937012
Automated Tumour Recognition and Digital Pathology Scoring Unravels New Role for PD-L1 in Predicting Good Outcome in ER-/HER2+ Breast Cancer
Abstract
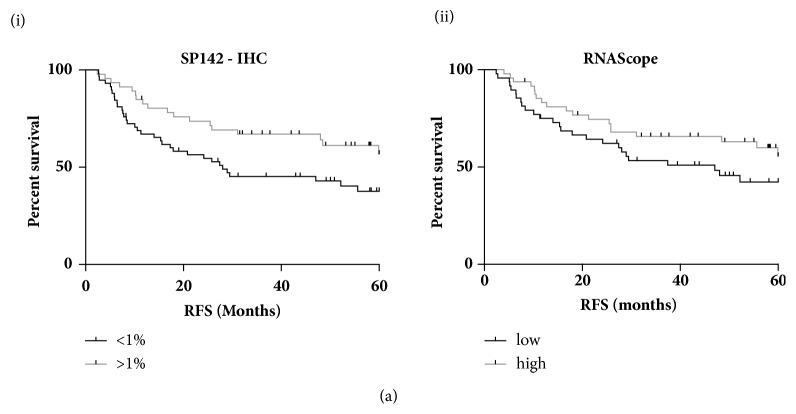
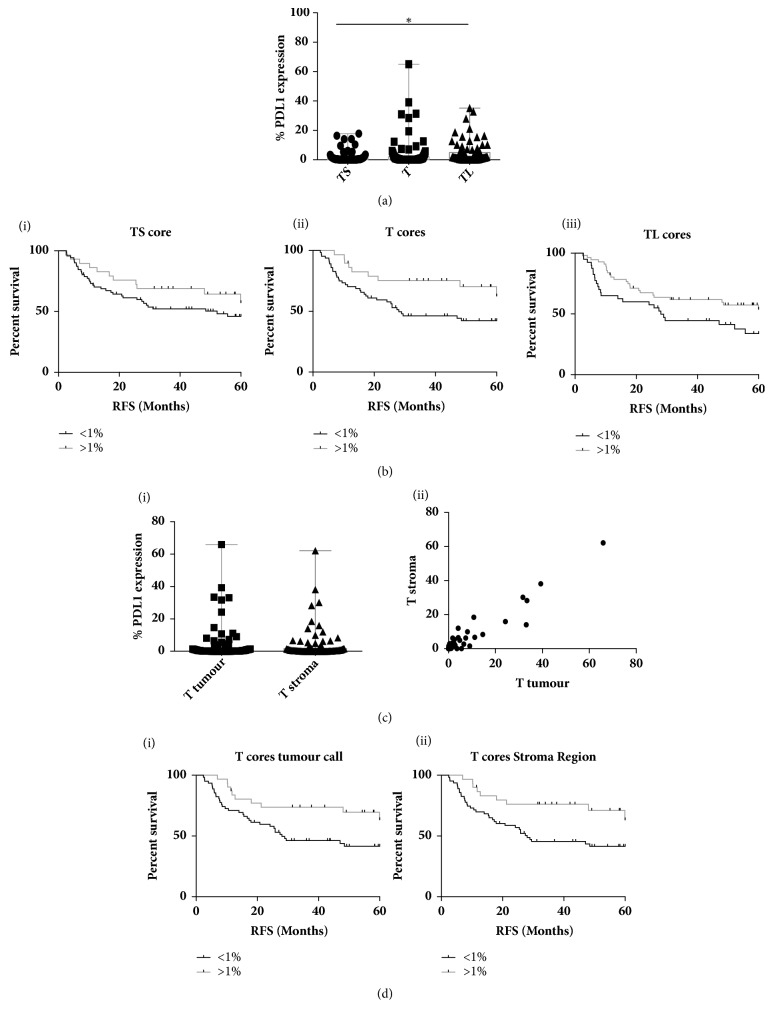
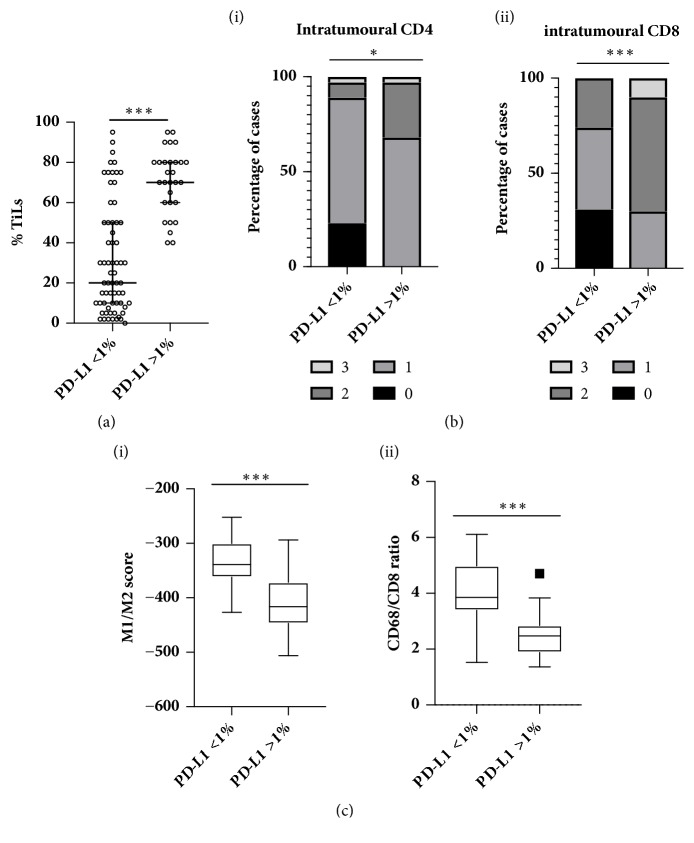
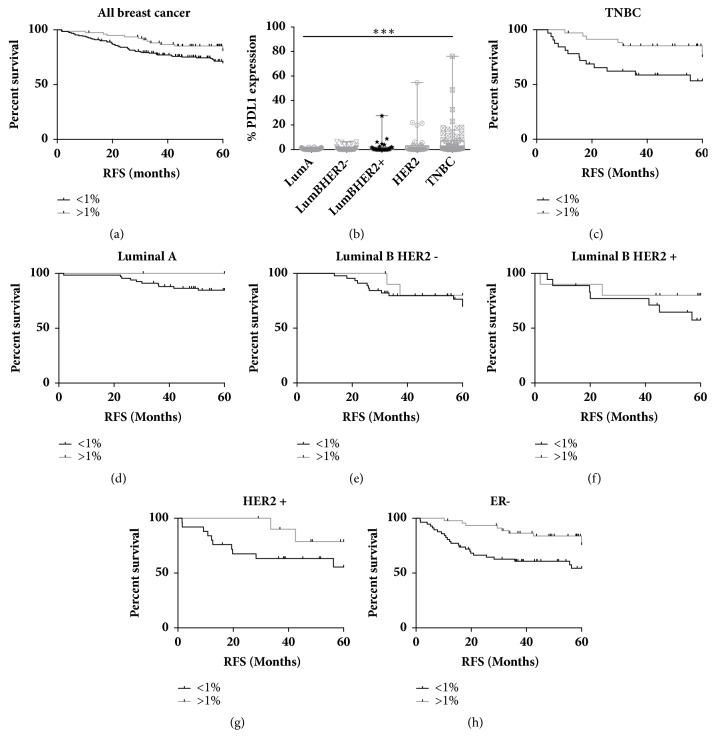
The role of PD-L1 as a prognostic and predictive biomarker is an area of great interest. However, there is a lack of consensus on how to deliver PD-L1 as a clinical biomarker. At the heart of this conundrum is the subjective scoring of PD-L1 IHC in most studies to date. Current standard scoring systems involve separation of epithelial and inflammatory cells and find clinical significance in different percentages of expression, e.g., above or below 1%. Clearly, an objective, reproducible and accurate approach to PD-L1 scoring would bring a degree of necessary consistency to this landscape. Using a systematic comparison of technologies and the application of QuPath, a digital pathology platform, we show that high PD-L1 expression is associated with improved clinical outcome in Triple Negative breast cancer in the context of standard of care (SoC) chemotherapy, consistent with previous findings. In addition, we demonstrate for the first time that high PD-L1 expression is also associated with better outcome in ER- disease as a whole including HER2+ breast cancer. We demonstrate the influence of antibody choice on quantification and clinical impact with the Ventana antibody (SP142) providing the most robust assay in our hands. Through sampling different regions of the tumour, we show that tumour rich regions display the greatest range of PD-L1 expression and this has the most clinical significance compared to stroma and lymphoid rich areas. Furthermore, we observe that both inflammatory and epithelial PD-L1 expression are associated with improved survival in the context of chemotherapy. Moreover, as seen with PD-L1 inhibitor studies, a low threshold of PD-L1 expression stratifies patient outcome. This emphasises the importance of using digital pathology and precise biomarker quantitation to achieve accurate and reproducible scores that can discriminate low PD-L1 expression.
Figures
Similar articles
-
Comparison of SP142 and 22C3 PD-L1 assays in a population-based cohort of triple-negative breast cancer patients in the context of their clinically established scoring algorithms.Breast Cancer Res. 2023 Oct 10;25(1):123. doi: 10.1186/s13058-023-01724-2. Breast Cancer Res. 2023. PMID: 37817263 Free PMC article.
-
A Prospective, Multi-institutional, Pathologist-Based Assessment of 4 Immunohistochemistry Assays for PD-L1 Expression in Non-Small Cell Lung Cancer.JAMA Oncol. 2017 Aug 1;3(8):1051-1058. doi: 10.1001/jamaoncol.2017.0013. JAMA Oncol. 2017. PMID: 28278348 Free PMC article.
-
SP142 PD-L1 Scoring Shows High Interobserver and Intraobserver Agreement in Triple-negative Breast Carcinoma But Overall Low Percentage Agreement With Other PD-L1 Clones SP263 and 22C3.Am J Surg Pathol. 2021 Aug 1;45(8):1108-1117. doi: 10.1097/PAS.0000000000001701. Am J Surg Pathol. 2021. PMID: 34232604 Free PMC article.
-
Tumor Infiltrating Lymphocytes (TILS) and PD-L1 Expression in Breast Cancer: A Review of Current Evidence and Prognostic Implications from Pathologist's Perspective.Cancers (Basel). 2023 Sep 8;15(18):4479. doi: 10.3390/cancers15184479. Cancers (Basel). 2023. PMID: 37760449 Free PMC article. Review.
-
The efficacy and safety of PD-1/PD-L1 inhibitors in combination with chemotherapy as a first-line treatment for unresectable, locally advanced, HER2-negative gastric or gastroesophageal junction cancer: a meta-analysis of randomized controlled trials.Front Immunol. 2025 Mar 26;16:1566939. doi: 10.3389/fimmu.2025.1566939. eCollection 2025. Front Immunol. 2025. PMID: 40207218 Free PMC article.
Cited by
-
QuPath: The global impact of an open source digital pathology system.Comput Struct Biotechnol J. 2021 Jan 21;19:852-859. doi: 10.1016/j.csbj.2021.01.022. eCollection 2021. Comput Struct Biotechnol J. 2021. PMID: 33598100 Free PMC article. Review.
-
Improving the Diagnostic Accuracy of the PD-L1 Test with Image Analysis and Multiplex Hybridization.Cancers (Basel). 2020 Apr 29;12(5):1114. doi: 10.3390/cancers12051114. Cancers (Basel). 2020. PMID: 32365629 Free PMC article.
-
The search for a TNBC vaccine: the guardian vaccine.Cancer Biol Ther. 2025 Dec;26(1):2472432. doi: 10.1080/15384047.2025.2472432. Epub 2025 Mar 15. Cancer Biol Ther. 2025. PMID: 40089851 Free PMC article. Review.
-
Programmed Cell Death Ligand 1 in Breast Cancer: Technical Aspects, Prognostic Implications, and Predictive Value.Oncologist. 2019 Nov;24(11):e1055-e1069. doi: 10.1634/theoncologist.2019-0197. Epub 2019 Aug 23. Oncologist. 2019. PMID: 31444294 Free PMC article. Review.
-
A Pyramid Architecture-Based Deep Learning Framework for Breast Cancer Detection.Biomed Res Int. 2021 Oct 1;2021:2567202. doi: 10.1155/2021/2567202. eCollection 2021. Biomed Res Int. 2021. PMID: 34631877 Free PMC article.
References
-
- Loi S., Sirtaine N., Piette F., et al. Prognostic and predictive value of tumor-infiltrating lymphocytes in a phase III randomized adjuvant breast cancer trial in node-positive breast cancer comparing the addition of docetaxel to doxorubicin with doxorubicin-based chemotherapy: BIG 02-98. Journal of Clinical Oncology. 2013;31(7):860–867. doi: 10.1200/jco.2011.41.0902. - DOI - PubMed
Grants and funding
LinkOut - more resources
Full Text Sources
Research Materials
Miscellaneous
