Inhibins regulate peripheral regulatory T cell induction through modulation of dendritic cell function
- PMID: 30652081
- PMCID: PMC6325588
- DOI: 10.1002/2211-5463.12555
Inhibins regulate peripheral regulatory T cell induction through modulation of dendritic cell function
Abstract
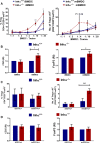
We have previously reported that the absence of inhibins results in impaired dendritic cell (DC) maturation and function, leading to decreased T cell activation and diminished delayed-type hypersensitivity responses. Here, we investigated the role of inhibins in peripheral regulatory T cell (Treg) induction in vitro and in vivo. Inhibin deficient (Inhα-/-) mice showed an increased percentage of peripherally induced Tregs in colonic lamina propria and mesenteric lymph nodes, compared to Inhα+/+ mice, which correlated with increased expression of PD-L1 in CD103+ and CD8α+ DCs. Lipopolysaccharide-stimulated bone marrow-derived and ex vivo spleen- and lymph node-purified CD11c+ Inhα-/- DCs induced higher Tregs in vitro. Moreover, in vivo anti-DEC205-ovalbumin (OVA) DC targeting of mice with adoptively transferred OVA-specific T cells showed enhanced induced peripheral Treg conversion in Inhα-/- mice. These data identify inhibins as key regulators of peripheral T cell tolerance.
Keywords: Tregs; dendritic cells; inhibins; peripheral tolerance.
Figures


Similar articles
-
A Key Role for Inhibins in Dendritic Cell Maturation and Function.PLoS One. 2016 Dec 9;11(12):e0167813. doi: 10.1371/journal.pone.0167813. eCollection 2016. PLoS One. 2016. PMID: 27936218 Free PMC article.
-
Mesenteric lymph node CD11b- CD103+ PD-L1High dendritic cells highly induce regulatory T cells.Immunology. 2017 Sep;152(1):52-64. doi: 10.1111/imm.12747. Epub 2017 Jun 1. Immunology. 2017. PMID: 28423181 Free PMC article.
-
Age-Dependent Decrease in the Induction of Regulatory T Cells Is Associated With Decreased Expression of RALDH2 in Mesenteric Lymph Node Dendritic Cells.Front Immunol. 2020 Aug 11;11:1555. doi: 10.3389/fimmu.2020.01555. eCollection 2020. Front Immunol. 2020. PMID: 32849526 Free PMC article.
-
The isoflavone puerarin induces Foxp3+ regulatory T cells by augmenting retinoic acid production, thereby inducing mucosal immune tolerance in a murine food allergy model.Biochem Biophys Res Commun. 2019 Aug 27;516(3):626-631. doi: 10.1016/j.bbrc.2019.06.051. Epub 2019 Jun 22. Biochem Biophys Res Commun. 2019. PMID: 31235250
-
Glucocorticoid-induced leucine zipper enhanced expression in dendritic cells is sufficient to drive regulatory T cells expansion in vivo.J Immunol. 2014 Dec 15;193(12):5863-72. doi: 10.4049/jimmunol.1400758. Epub 2014 Oct 31. J Immunol. 2014. PMID: 25362183
Cited by
-
A bioinformatic analysis of the inhibin-betaglycan-endoglin/CD105 network reveals prognostic value in multiple solid tumors.PLoS One. 2021 Apr 5;16(4):e0249558. doi: 10.1371/journal.pone.0249558. eCollection 2021. PLoS One. 2021. PMID: 33819300 Free PMC article.
-
Probiotics ingestion prevents HDAC11-induced DEC205+ dendritic cell dysfunction in night shift nurses.Sci Rep. 2019 Nov 29;9(1):18002. doi: 10.1038/s41598-019-54558-4. Sci Rep. 2019. PMID: 31784669 Free PMC article.
-
Molecular and biological characterization of transforming growth factor-β homolog derived from Trichinella spiralis.Sci Rep. 2024 Dec 28;14(1):31229. doi: 10.1038/s41598-024-82599-x. Sci Rep. 2024. PMID: 39732815 Free PMC article.
-
Evolving roles of activins and inhibins in ovarian cancer pathophysiology.Am J Physiol Cell Physiol. 2023 Feb 1;324(2):C428-C437. doi: 10.1152/ajpcell.00178.2022. Epub 2023 Jan 9. Am J Physiol Cell Physiol. 2023. PMID: 36622068 Free PMC article. Review.
References
-
- Ivanov I, Zhou L, Huh J, Santori F, Manel N, Chong M, Umesaki Y, Brodie E, Honda K and Littman DR (2009) Role of microbiota and transcription factors in control of Th17 cell differentiation. Cytokine 48, 18.
-
- Zheng Y and Rudensky AY (2007) Foxp3 in control of the regulatory T cell lineage. Nat Immunol 8, 457–462. - PubMed
-
- Kitagawa Y and Sakaguchi S (2017) Molecular control of regulatory T cell development and function. Curr Opin Immunol 49, 64–70. - PubMed
Publication types
MeSH terms
Substances
LinkOut - more resources
Full Text Sources
Research Materials

