

Conventional analysis of movement on non-flat surfaces like the plasma membrane makes Brownian motion appear anomalous
- PMID: 30652124
- PMCID: PMC6325064
- DOI: 10.1038/s42003-018-0240-2
Conventional analysis of movement on non-flat surfaces like the plasma membrane makes Brownian motion appear anomalous
Abstract
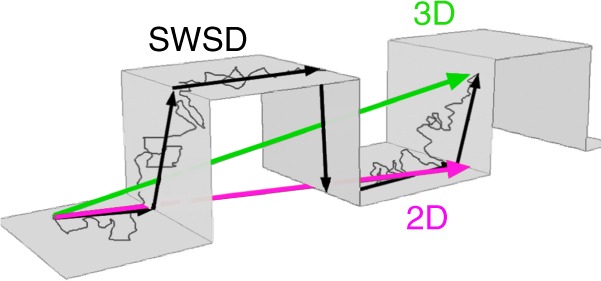
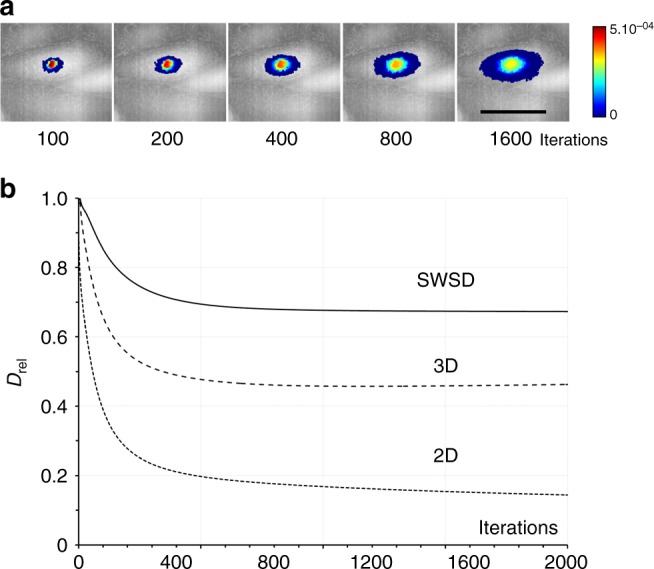
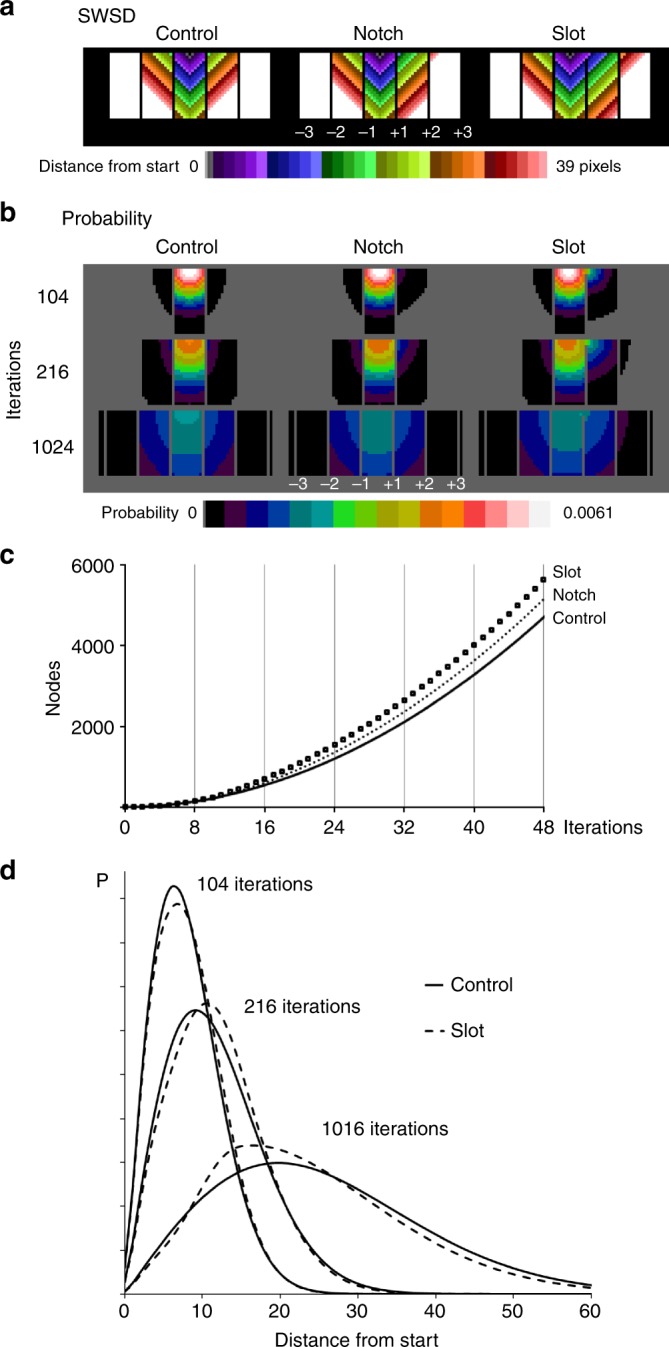
Cells are neither flat nor smooth, which has serious implications for prevailing plasma membrane models and cellular processes like cell signalling, adhesion and molecular clustering. Using probability distributions from diffusion simulations, we demonstrate that 2D and 3D Euclidean distance measurements substantially underestimate diffusion on non-flat surfaces. Intuitively, the shortest within surface distance (SWSD), the geodesic distance, should reduce this problem. The SWSD is accurate for foldable surfaces but, although it outperforms 2D and 3D Euclidean measurements, it still underestimates movement on deformed surfaces. We demonstrate that the reason behind the underestimation is that topographical features themselves can produce both super- and subdiffusion, i.e. the appearance of anomalous diffusion. Differentiating between topography-induced and genuine anomalous diffusion requires characterising the surface by simulating Brownian motion on high-resolution cell surface images and a comparison with the experimental data.
Conflict of interest statement
The authors declare no competing interests.
Figures


Similar articles
-
Sampling the cell with anomalous diffusion - the discovery of slowness.Biophys J. 2008 Jan 1;94(1):90-4. doi: 10.1529/biophysj.107.117044. Epub 2007 Sep 7. Biophys J. 2008. PMID: 17827216 Free PMC article.
-
Anomalous diffusion due to hindering by mobile obstacles undergoing Brownian motion or Orstein-Ulhenbeck processes.Phys Rev E Stat Nonlin Soft Matter Phys. 2014 Feb;89(2):022708. doi: 10.1103/PhysRevE.89.022708. Epub 2014 Feb 7. Phys Rev E Stat Nonlin Soft Matter Phys. 2014. PMID: 25353510
-
Meaningful interpretation of subdiffusive measurements in living cells (crowded environment) by fluorescence fluctuation microscopy.Curr Pharm Biotechnol. 2010 Aug;11(5):527-43. doi: 10.2174/138920110791591454. Curr Pharm Biotechnol. 2010. PMID: 20553227 Free PMC article.
-
Mechanisms underlying anomalous diffusion in the plasma membrane.Curr Top Membr. 2015;75:167-207. doi: 10.1016/bs.ctm.2015.03.002. Epub 2015 Apr 15. Curr Top Membr. 2015. PMID: 26015283 Review.
-
Anomalous transport in the crowded world of biological cells.Rep Prog Phys. 2013 Apr;76(4):046602. doi: 10.1088/0034-4885/76/4/046602. Epub 2013 Mar 12. Rep Prog Phys. 2013. PMID: 23481518 Review.
Cited by
-
Membrane topography and the overestimation of protein clustering in single molecule localisation microscopy - identification and correction.Commun Biol. 2024 Jun 29;7(1):791. doi: 10.1038/s42003-024-06472-3. Commun Biol. 2024. PMID: 38951588 Free PMC article.
-
Variations in Plasma Membrane Topography Can Explain Heterogenous Diffusion Coefficients Obtained by Fluorescence Correlation Spectroscopy.Front Cell Dev Biol. 2020 Aug 11;8:767. doi: 10.3389/fcell.2020.00767. eCollection 2020. Front Cell Dev Biol. 2020. PMID: 32903922 Free PMC article.
-
Increased Confinement and Polydispersity of STIM1 and Orai1 after Ca2+ Store Depletion.Biophys J. 2020 Jan 7;118(1):70-84. doi: 10.1016/j.bpj.2019.11.019. Epub 2019 Nov 22. Biophys J. 2020. PMID: 31818466 Free PMC article.
-
Synergistic factors control kinase-phosphatase organization in B-cells engaged with supported bilayers.Mol Biol Cell. 2020 Mar 19;31(7):667-682. doi: 10.1091/mbc.E19-09-0507. Epub 2019 Dec 26. Mol Biol Cell. 2020. PMID: 31877064 Free PMC article.
-
Diffusion Analyses along Mean and Gaussian-Curved Membranes with CurD.J Phys Chem Lett. 2024 Mar 21;15(11):3214-3220. doi: 10.1021/acs.jpclett.4c00338. Epub 2024 Mar 14. J Phys Chem Lett. 2024. PMID: 38483514 Free PMC article.
References
Publication types
MeSH terms
Substances
LinkOut - more resources
Full Text Sources
Other Literature Sources
