. 2019 Jan 14:2:19.
doi: 10.1038/s42003-018-0271-8. eCollection 2019.

Regulation of RNA editing by RNA-binding proteins in human cells

Affiliations

Regulation of RNA editing by RNA-binding proteins in human cells

Giovanni Quinones-Valdez et al. Commun Biol. .

Abstract

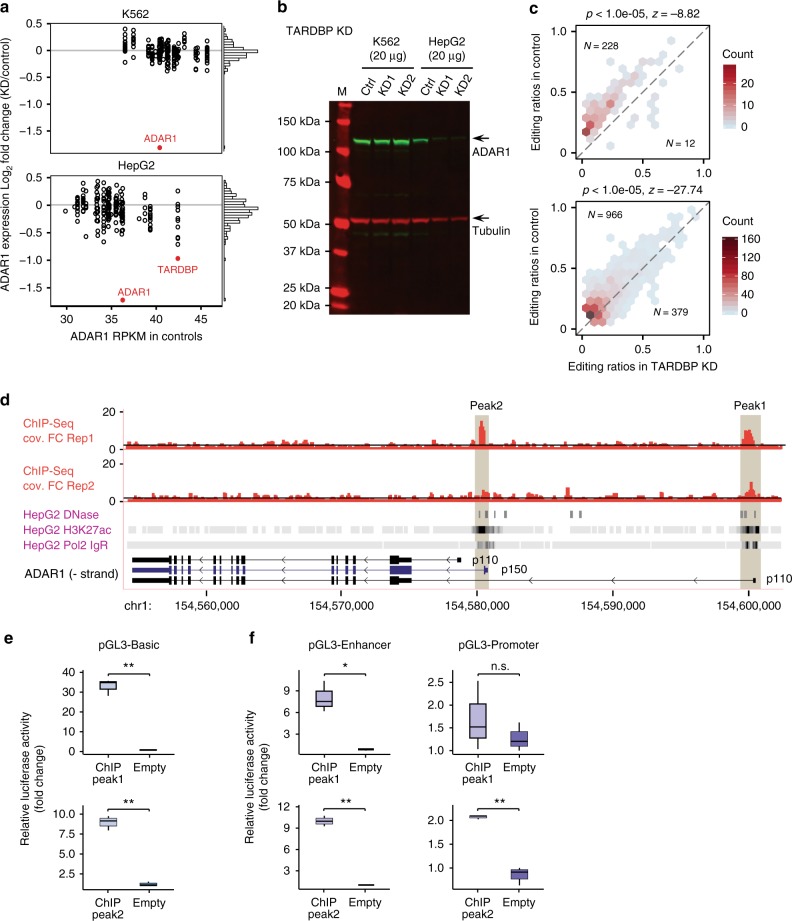
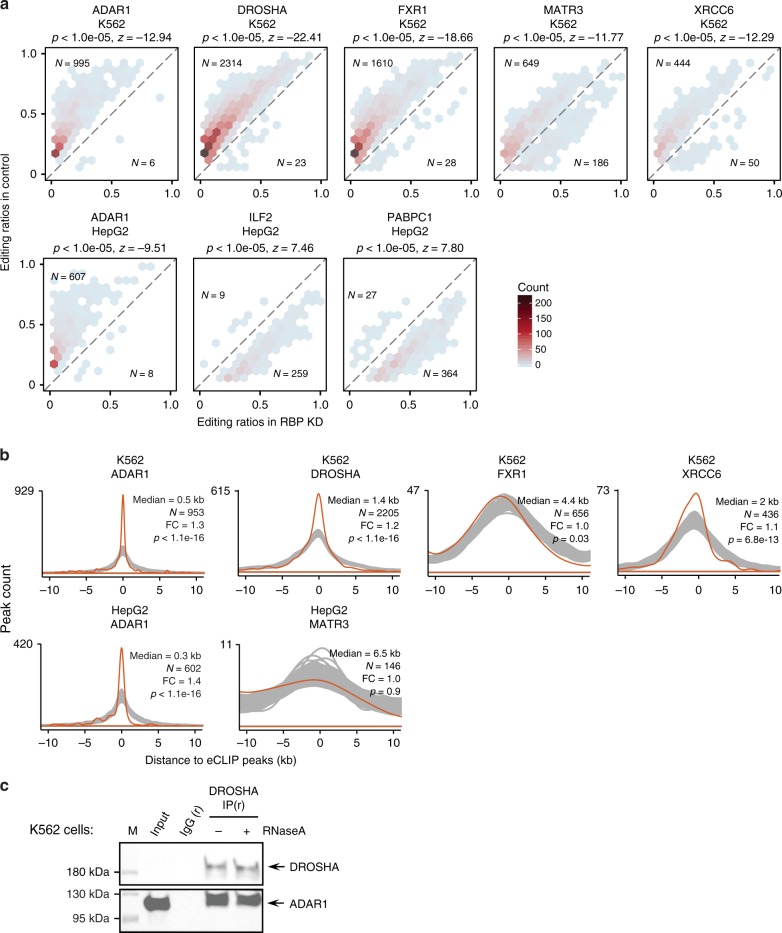
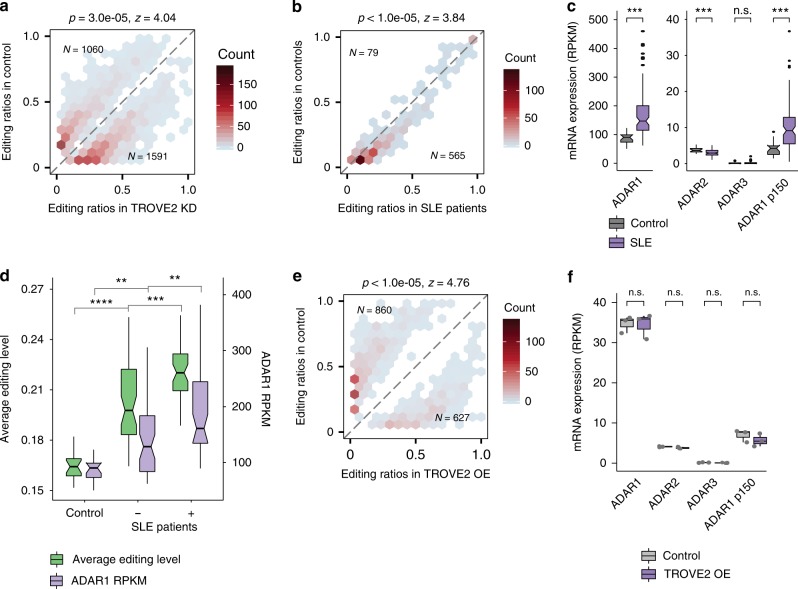
Adenosine-to-inosine (A-to-I) editing, mediated by the ADAR enzymes, diversifies the transcriptome by altering RNA sequences. Recent studies reported global changes in RNA editing in disease and development. Such widespread editing variations necessitate an improved understanding of the regulatory mechanisms of RNA editing. Here, we study the roles of >200 RNA-binding proteins (RBPs) in mediating RNA editing in two human cell lines. Using RNA-sequencing and global protein-RNA binding data, we identify a number of RBPs as key regulators of A-to-I editing. These RBPs, such as TDP-43, DROSHA, NF45/90 and Ro60, mediate editing through various mechanisms including regulation of ADAR1 expression, interaction with ADAR1, and binding to Alu elements. We highlight that editing regulation by Ro60 is consistent with the global up-regulation of RNA editing in systemic lupus erythematosus. Additionally, most key editing regulators act in a cell type-specific manner. Together, our work provides insights for the regulatory mechanisms of RNA editing.


Conflict of interest statement

G.W.Y. is a co-founder of Locana and Eclipse Bioinnovations and member of the scientific advisory boards of Locana, Eclipse Bioinnovations and Aquinnah Pharmaceuticals. E.V.N is a co-founder and member of the scientific advisory board of Eclipse BioInnovations. The terms of these arrangements have been reviewed and approved by the University of California, San Diego in accordance with its conflict of interest policies. The remaining authors declare no competing interests.

Figures

Fig. 1
Fig. 1
Global overview of RNA editing regulation by RBPs. a CIRCOS plot illustrating differential editing patterns upon knockdown of each RBP in each cell line. For each cell line, 100 RBPs are shown as those with the highest percentage of differentially edited sites among all testable sites (represented by the height of the outer box). The color of the box denotes the average changes in editing levels of differentially edited sites relative to controls upon RBP knockdown. For the links between RBPs, the thickness and color of the line both reflect an overlap score, that is, the fraction of shared differentially edited sites among shared testable sites between two RBPs (Methods). Positive overlap scores reflect concordant direction in the editing changes induced by the pair of RBPs, while negative values represent the opposite. The width of the box is set automatically to accommodate all the links associated with each box. ADAR1 has the greatest impact on global editing in both cell lines, which serves as a positive control. b Hierarchical clustering of RBPs using pair-wise directional agreement scores (Methods). The top 31 RBPs with the highest percentage of differentially edited sites among all testable sites per cell line are shown. The size of the dot and its color both reflect the directional agreement score. These RBPs cluster in two main groups composed of those associated with positive or negative editing changes upon their knockdown. c Correlation between actual average editing levels per sample and predicted RNA editing levels calculated via linear regression of gene expression levels of the top 15 RBPs in each cell line (including ADAR1). Each dot represents one sample and all RBP knockdown samples are included. R2 and p values were calculated by Pearson correlation. The expression of these RBPs explained about 35 and 52% of the total variance in editing in HepG2 and K562 cells, respectively
Fig. 2
Fig. 2
Regulation of ADAR1 expression by TARDBP. a Differential ADAR1 mRNA expression upon RBP knockdown in K562 and HepG2 cells compared to controls. Histograms on the right show the distributions of log-fold-change (LFC) values. TARDBP is the only RBP whose knockdown caused differential expression of ADAR1 (absolute value of LFC knockdown/Control ≥1 and DESeq q-value < 10−9). b Western blot of shRNA-mediated TARDBP knockdown and control (Ctrl) cells. Blots were probed with antibodies detecting ADAR1 and Tubulin (as a control). TARDBP knockdown significantly reduced ADAR1 expression in HepG2 cells only. c Editing ratios in TARDBP knockdown samples in HepG2 compared to their respective control values. The numbers (N) of editing sites with decreased and increased editing upon TARDBP knockdown are shown. The top panel includes only differentially edited sites and the bottom panel shows all testable editing sites. P-values and z scores were calculated using a bootstrap sampling strategy to evaluate the bias in the numbers of up- vs. down-regulated editing sites (Methods). Knockdown of TARDBP caused a global downregulation in editing levels. d TDP-43 (encoded by the TARDBP gene) ChIP-seq peaks in HepG2 cells overlapping ADAR1 transcripts. Fold change of read coverage relative to input control is shown for two replicated experiments (Rep1 and 2). Black line denotes fold change = 2. Three representative ADAR1 transcripts (RefSeq annotation) are shown, coding for the p110 and p150 forms of the ADAR1 protein. In addition, H3K27Ac, DNase hypersensitivity data in HepG2 cells and RNA polymerase 2 binding data generated by the ENCODE consortium are shown. e, f Luciferase assays of a series of pGL3 constructs containing the TDP-43 ChIP peak regions. The ChIP sequence for peak1 and peak2 were built into the construct. Basic pGL3 construct (e) and pGL3-Enhancer (lacking the SV40 promoter) and pGL3-Promoter (lacking the SV40 enhancer) constructs (f) are shown. The ratio of firefly luciferase to renilla luciferase was calculated for each experiment. The mean value (3 replicates) for each test construct was normalized to the activity of the empty vector. (Unpaired, two-tailed Student’s t-test, *P < 0.05, **P < 0.01, n.s.: not significant)
Fig. 3
Fig. 3
Regulation of RNA editing by ADAR1-interacting RBPs. a Editing ratios of differentially edited sites in RBP knockdown samples and their corresponding controls for ADAR1 and ADAR1-interacting proteins, similar as Fig. 2c. b Distribution of distances between eCLIP peaks and their closest differentially edited sites (orange) or control sites (gray) (Methods). The median distance is shown. N represents the number of differentially edited sites used in the calculation. Calculations of fold change and p values are described in the Methods section. ADAR1, DROSHA and XRCC6 bind significantly closer to differentially edited sites than to control sites. c Co-IP experiment with and without RNase A treatment in K562 cells demonstrates interaction between ADAR1 and DROSHA. Immunoprecipitation was performed using DROSHA antibody or corresponding rabbit (r) isotype IgG. Blots for immunoprecipitation samples were probed with antibodies detecting ADAR1 and DROSHA
Fig. 4
Fig. 4
Regulation of RNA editing by Alu-binding RBPs. a Top RBPs ranked by their fractions of eCLIP peaks that overlap Alu elements. RBPs were required to have both RNA-seq and eCLIP-seq data in the same cell line. ADAR CLIP-seq data was obtained in the U87MG cells. Sense and antisense Alus denote Alu elements with consensus sequence on the same or opposite strand as the CLIP or eCLIP peaks, respectively. The fraction of antisense Alus among all Alu-overlapping peaks is shown for each protein (next to the bar). b For the RBPs in a, comparison between the fraction of differentially edited sites among all testable sites and the fraction of eCLIP peaks that overlap Alu elements. The dots are colored according to the average editing changes of differentially edited sites (knockdown-control). There is no direct correlation between Alu-binding frequency and editing regulation for the tested RBPs. c Distribution of distances between eCLIP peaks and their closest differentially edited sites (orange) or control sites (gray) (Methods), for RBPs in a with eCLIP data, calculated similarly as in Fig. 3b. AUH, PUS1 and TROVE2 bind significantly closer to differentially edited sites than to control sites
Fig. 5
Fig. 5
Regulation of RNA editing by TROVE2. a Editing ratios of differentially edited sites in TROVE2 knockdown samples and the corresponding controls in K562 cells, similar as Fig. 2c. b Similar as a, editing ratios of differentially edited sites in blood samples of SLE patients and control subjects. The data demonstrate reduced editing levels in SLE patients. c mRNA expression of ADAR1, ADAR2, ADAR3 and the ADAR1 p150 isoform in blood samples of SLE patients and control subjects (18 Controls, 99 SLE Patients, p values were calculated using two-tailed Wilcoxon ranksum test, ***P < 0.001, ****P < 10−5). d Average editing levels and ADAR1 mRNA expression (RPKM) of control subjects, SLE patients with medium to high Ro60 antibody levels (+) and SLE patients without detectable Ro60 antibody levels (−). Increasing levels of Ro60 antibody correlated with higher ADAR1 expression and editing levels (P-values were calculated using two-tailed a Wilcoxon rank sum test and corrected for multiple testing using Bonferroni correction, **P < 0.01, ***P < 0.001, ****P < 10−8). e Similar as a, editing levels of differentially edited sites in TROVE2 overexpression samples and the corresponding controls in K562 cells. Overexpression of TROVE2 led to a bias toward lower editing levels. f mRNA expression of ADAR genes in TROVE2 overexpression samples in K562 cells (N = 3 biological replicates, P values were calculated using a two-tailed Wilcoxon ranksum test). No significant change was observed in ADAR expression in TROVE2 overexpression samples compared to controls
Fig. 6
Fig. 6
Cell type-specific impact of RBPs on RNA editing. a Overlap of differentially edited sites between K562 and HepG2 cells for RBPs with at least 10% testable sites being differentially edited sites in at least one cell line. The differentially edited sites are separated into 3 groups based on the expression levels (RPKM) of the corresponding genes in the two cell lines. In each group, a ratio (level of overlap) was calculated for each RBP between the number of shared differentially edited sites and the number of the union of differentially edited sites between the two cell lines. P values were calculated using Wilcoxon rank sum test. Editing sites in highly expressed genes common to the two cell lines had the highest overlap between the two cell lines among the 3 groups of genes. b For RBPs in a, directional agreement scores (Methods) of their differentially edited sites between K562 and HepG2 cells

Similar articles

Cited by

References

    1. Axel B, Anita M, Stefan B. RNA editing. FEMS Microbiol. Rev. 1999;23:297–316. doi: 10.1111/j.1574-6976.1999.tb00401.x. - DOI - PubMed
    1. Shaw JM, Feagin JE, Stuart K, Simpson L. Editing of kinetoplastid mitochondrial mRNAs by uridine addition and deletion generates conserved amino acid sequences and AUG initiation codons. Cell. 1988;53:401–411. doi: 10.1016/0092-8674(88)90160-2. - DOI - PubMed
    1. Nishikura K. A-to-I editing of coding and non-coding RNAs by ADARs. Nat. Rev. Mol. Cell Biol. 2016;17:83–96. doi: 10.1038/nrm.2015.4. - DOI - PMC - PubMed
    1. Bentley DL. Coupling mRNA processing with transcription in time and space. Nat. Rev. Genet. 2014;15:163–175. doi: 10.1038/nrg3662. - DOI - PMC - PubMed
    1. Esther Hsiao, Y.-H. et al. RNA editing in nascent RNA affects pre-mRNA splicing. Cold Spring Harb. Lab. Press May3, gr.231209.117 (2018). - PMC - PubMed

Publication types

MeSH terms