. 2019 Aug;56(8):5586-5607.
doi: 10.1007/s12035-018-1464-3. Epub 2019 Jan 16.

Neuroprotective Mitochondrial Remodeling by AKAP121/PKA Protects HT22 Cell from Glutamate-Induced Oxidative Stress

Affiliations

Neuroprotective Mitochondrial Remodeling by AKAP121/PKA Protects HT22 Cell from Glutamate-Induced Oxidative Stress

Jingdian Zhang et al. Mol Neurobiol. 2019 Aug.

Abstract

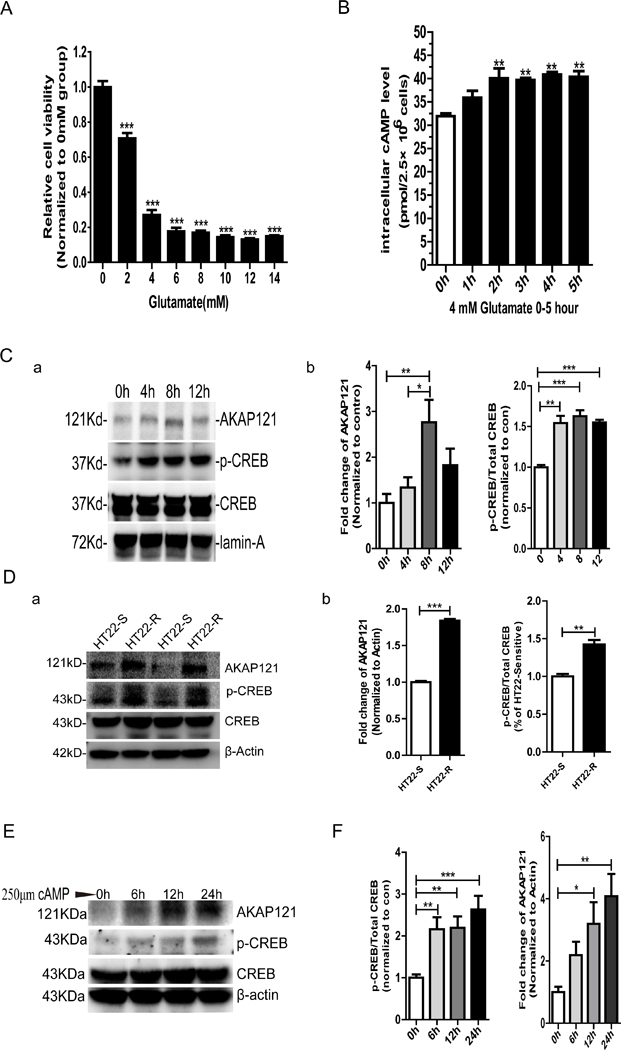
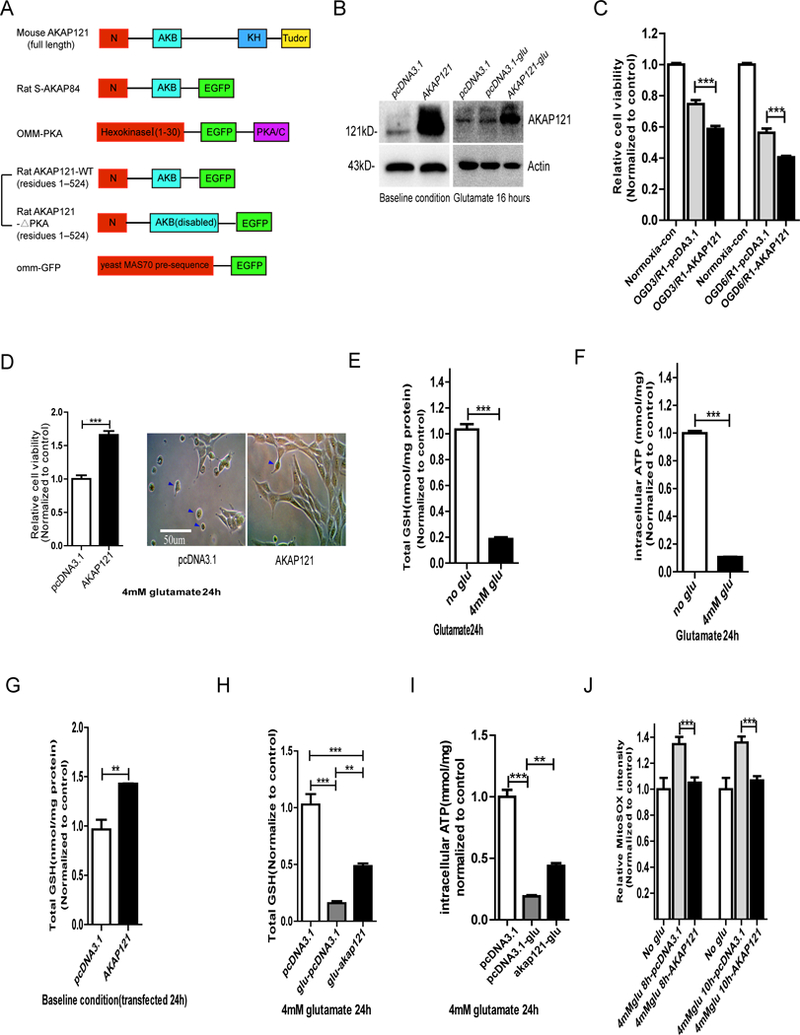
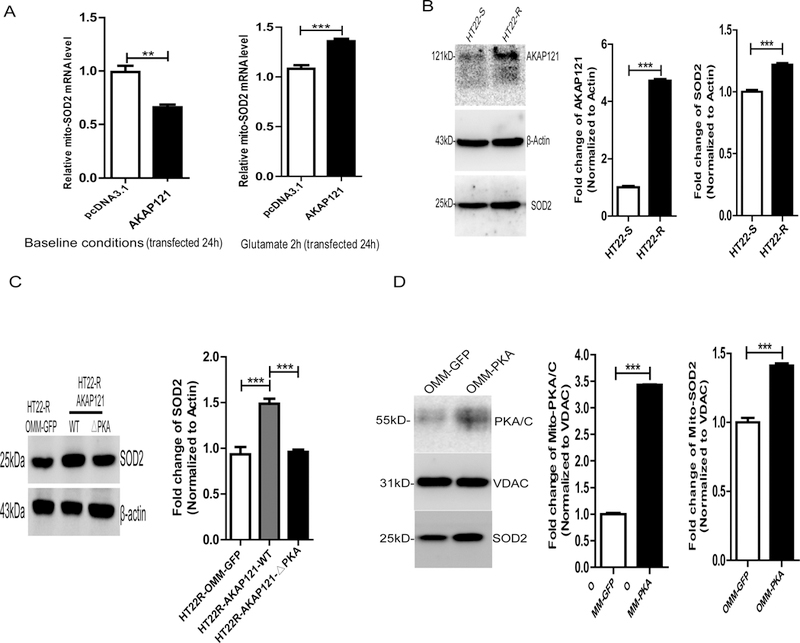
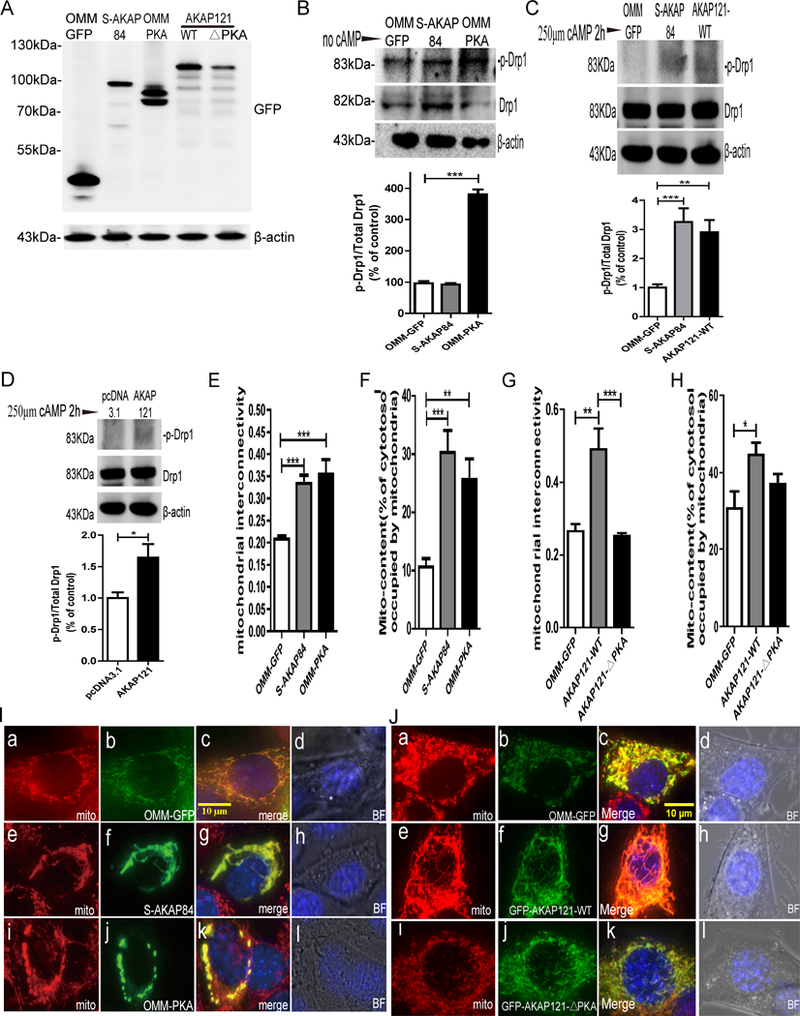
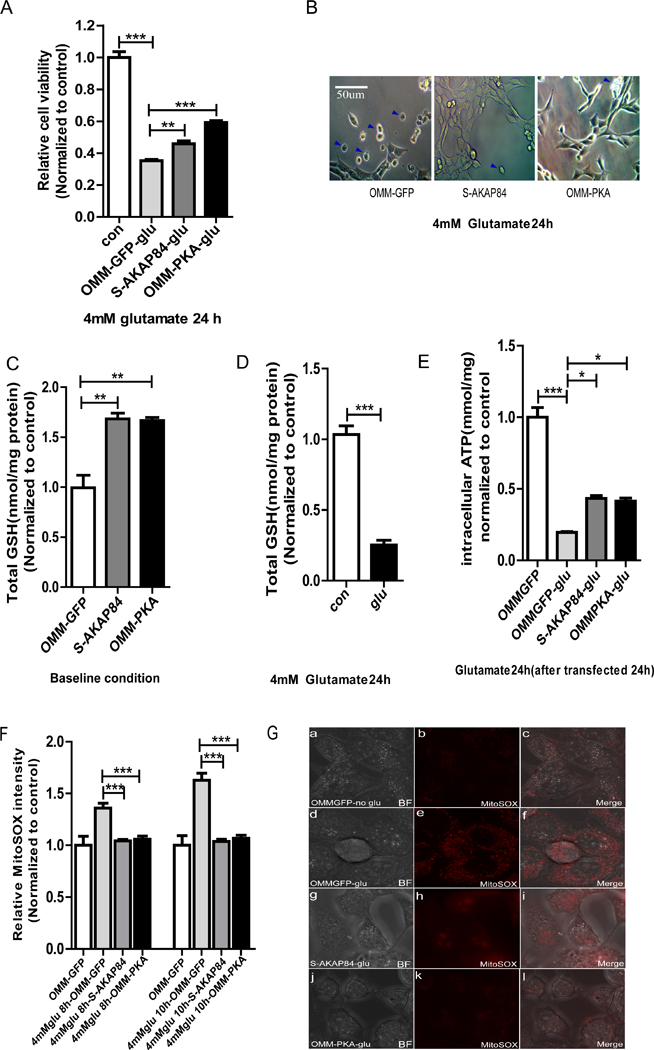
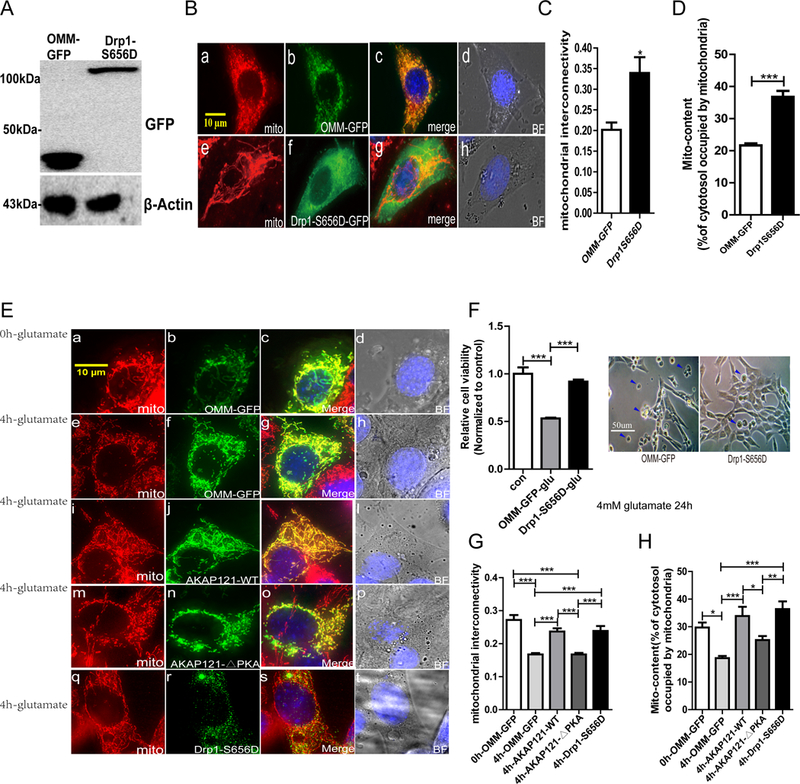
Protein kinase A (PKA) is a ser/thr kinase that is critical for maintaining essential neuronal functions including mitochondrial homeostasis, bioenergetics, neuronal development, and neurotransmission. The endogenous pool of PKA is targeted to the mitochondrion by forming a complex with the mitochondrial scaffold A-kinase anchoring protein 121 (AKAP121). Enhanced PKA signaling via AKAP121 leads to PKA-mediated phosphorylation of the fission modulator Drp1, leading to enhanced mitochondrial networks and thereby blocking apoptosis against different toxic insults. In this study, we show for the first time that AKAP121/PKA confers neuroprotection in an in vitro model of oxidative stress induced by exposure to excess glutamate. Unexpectedly, treating mouse hippocampal progenitor neuronal HT22 cells with an acute dose or chronic exposure of glutamate robustly elevates PKA signaling, a beneficial compensatory response that is phenocopied in HT22 cells conditioned to thrive in the presence of excess glutamate but not in parental HT22 cells. Secondly, redirecting the endogenous pool of PKA by transiently transfecting AKAP121 or transfecting a constitutively active mutant of PKA targeted to the mitochondrion (OMM-PKA) or of an isoform of AKAP121 that lacks the KH and Tudor domains (S-AKAP84) are sufficient to significantly block cell death induced by glutamate toxicity but not in an oxygen deprivation/reperfusion model. Conversely, transient transfection of HT22 neuronal cells with a PKA-binding-deficient mutant of AKAP121 is unable to protect against oxidative stress induced by glutamate toxicity suggesting that the catalytic activity of PKA is required for AKAP121's protective effects. Mechanistically, AKAP121 promotes neuroprotection by enhancing PKA-mediated phosphorylation of Drp1 to increase mitochondrial fusion, elevates ATP levels, and elicits an increase in the levels of antioxidants GSH and superoxide dismutase 2 leading to a reduction in the level of mitochondrial superoxide. Overall, our data supports AKAP121/PKA as a new molecular target that confers neuroprotection against glutamate toxicity by phosphorylating Drp1, to stabilize mitochondrial networks and mitochondrial function and to elicit antioxidant responses.

Keywords: A-kinase anchoring protein 121; Dynamin-related protein 1 (Drp1); HT22; Mitochondrion; Oxidative stress; Protein kinase A.


Figures

Figure 1:
Figure 1:. Glutamate-mediated oxidative stress elicit cyclic AMP-dependent PKA signaling
A. Effect of glutamate on cell viability. Cells were seeded in 96 well culture plates at 5,000 cells/well, overnight, then treated with glutamate at the indicated concentrations for 24 h. Cell viability was determined using the cck-8 assay.(***:p<0.001 vs. 0mM., One-Way ANOVA, Tukey’s test) B. An intracellular rise in cAMP level is observed as a result of oxidative glutamate toxicity. Parental HT22 cells were seeded in 6 well culture plates at 2×10⁵ cells per well overnight and subsequently challenged with 4mM glutamate for the indicated time points. Cells were then harvested per well in lysis buffer and intracellular cAMP was assayed by performing the competitive immunoassay.(**p < 0.01, vs. 0h., One-Way ANOVA, Tukey’s test) C.Cells lysates derived from parental HT22 cells that were challenged with 4mM glutamate for the indicated time points and immunoblotted for endogenous AKAP121, p-CREB and total CREB (T-CREB) to analyzeAKAP121 level and the p-CREB to CREB ratios. The representative Western blot, representative of three experiments, (a) shows that challenging HT22 cells with glutamate increases the level of endogenous AKAP121 and of p-CREB, suggesting that glutamate toxicity is associated with increased intracellular cAMP-dependent signaling. The bar graphs on the right show densitometric-based quantifications of the mean intensity of the immunoreactive bands for AKAP121 (left bar graph) or of p-CREB/T-CREB ratio. (For both graphs: ***:p<0.001 vs. 0h., One-Way ANOVA, Tukey’s test). D. Cells lysates derived from HT22-sensitive and-resistance cell clones (HT22-R)were immunoblotted for endogenous AKAP121, p-CREB and CREB to analyze the extent to which exposure of cells to chronic and high concentrations of glutamate elicits PKA signaling. The bar graphs on the right show imaged based quantifications of the mean intensity of the immunoreactive bands for AKAP121 (left bar graph) or of p-CREB/T-CREB ratio. (For both graphs: **p < 0.01,***:p<0.001 vs. HT22-S., student t-test). E. Cell lysates derived from HT22 cells incubated in 250μM cAMP for indicated time were immunoblotted for the level of AKAP121and p-CREB/CREB ratio.The representative Western blot, representative of three experiments, shows that incubating HT22 cells with 250μM cAMP robustly increases the level of endogenous AKAP121 and of p-CREB. F. The bar graphs show imaged based quantifications of the mean intensity of the immunoreactive bands for AKAP121 (right bar graph) or of p-CREB/T-CREB ratio (left bar graph). (For both graphs: *p < 0.05,**p < 0.01,***:p<0.001 vs. 0h., student t-test). All the data were pooled from experiments that were repeated at least three times which yielded similar results (a representative data set is shown).
Figure 2.
Figure 2.. AKAP121 over-expression can increase the level of antioxidants SOD2 and GSH as a molecular mechanism to reduce oxidative stress.
A. Schematic showing the domain structure of S-AKAP84,OMM-PKA,AKAP121,the AKAP121-WT and AKAP121-△PKA pair, and mitochondrial targeted GFP (OMM-GFP). The DNA constructs used in the experiments are shown throughout figures 2–6. The relative positions of functional domains are labeled and indicated in different colors. “N” corresponds to the 30-residue mitochondrial targeting domain whereas the AKB stands for the PKA-binding domain of S-AKAP84, full-length AKAP121, AKAP121-WT-GFP and AKAP121-△PKA-GFP. Note that the K homology (KH) and Tudor domains are homologous to the corresponding RNA-binding domains. Hexokinase I (–30) serves as the N-terminal OMM-targeting sequence for OMM-PKA.PKA/C stands for the catalytic subunit of PKA. B. Lysates from cells transiently transfected the empty vector control (pcDNA3.1) or AKAP121 vector were immunoblotted for the level of AKAP121under baseline conditions or in the presence of excess glutamate. C. Cells were transfected with empty vector(pcDNA3.1) or with AKAP121 for 24 h. and seeded in 96 well culture plates at 5,000 cells/well overnight. Cells were then subjected with OGD/R. Cell viability was determined by employing the cck-8 assay. (***:p<0.001 vs. pCDNA3.1, One-Way ANOVA, Tukey’s test). D. HT22 cells were incubated with 4mM glutamate for 24h. The cell morphology was visualized with a phase-contrast microscope.The representative phase-contrast images show that transient expression of AKAP121 preserves normal cell morphology compared to cells expressing an empty vector. ( ***:p<0.001 vs. pcDNA3.1., student t-test).Scale bar = 50μm. E.F. Cell lysates derived from untreated or glutamate exposed (4mM, 24 h.) HT22 cells were assayed for the level of intracellular glutathione (E) and of ATP levels (F).(For both graphs: ***:p<0.001 vs. no glu., student t-test). G. Cell lysates derived from hippocampal progenitor HT22 neuronal cells transiently transfected with pcDNA3.1 empty vector control or with AKAP121 were assayed for the level of intracellular glutathione HT22 cells and normalized to protein concentration. (**:p<0.01 vs. con-pcDNA3.1., student t-test). H. and I. Confluent HT22 cells were transfected with AKAP121 or with pcDNA3.1. Cells transfected with empty vector without glutamate incubation as a control. 24 h. postransfection, cells were challenging with 4mM glutamate for 24 h harvested, lysed and the intracellular total glutathione and ATP content were measured to assess the extent to which transient expression of AKAP121 restores T-GSH and ATP levels. (For both graphs: **:p<0.01, ***:p<0.001 vs. con-pcDNA3.1., student t-test). J.HT22 cells were untreated or challenged with 4mM glutamate for 8 and 10 h. Cells were then stained with the cell permeable, red fluorescent dye MitoSOX Red (5μM) to assess the levels of superoxide. Quantitation of fluorescence intensity of MitoSOX in HT22 cells was assessed by employing a microplate reader and normalized to cell number measured by employing the cck-8 assay.(For both 8 or 10 h. exposures to glutamate: ***:p<0.001 vs. 4mM glut pcDNA3.1, One-Way ANOVA, Tukey’s test). All the data were pooled from experiments that were repeated at least three times which yielded similar results (a representative data set is shown).
Figure3.
Figure3.. Mitochondrial Superoxide Dismutase SOD2 content is elevated in a PKA-dependent manner in HT22 cells.
A.RT-qPCR mediated quantification of the relative mRNA level for SOD2 derived from HT22 cells transiently transfected with AKAP121 or empty control vector under baseline conditions or following treatment with excess glutamate for 2 h., and normalized to β-Actin. For both graphs: **p < 0.01,***p < 0.001,vs. pcDNA3.1 group., student t-test). B. Cells lysates derived from HT22-sensitive (HT22-S) or from glutamate resistant HT22 cells (HT22-R) were immunoblotted for endogenous AKAP121, SOD2 and for β-actin as a loading control. The representative Western blot shows that HT22-R cell possess a higher AKAP121level together with an increasing level of SOD2 compared to HT22-S cell. (For both graphs: ***:p<0.001 vs. HT22-S, student t-test). C. Cells lysates derived from glutamate resistant HT22 cells (HT22-R) transfected with OMM-GFP,AKAP121-WT and AKAP121-△PKA were immunoblotted for endogenous SOD2 and for β-actin as a loading control.(***:p<0.001 vs.OMM-GFP, One-Way ANOVA, Tukey’s test) D. Mitochondrial fractions derived from HT22 cells transiently transfected with the indicated OMM-PKA vector were immunoblotted for PKA/C, SOD2 and VDAC as a loading control for mitochondria analyze the extent to which enhancing PKA signaling in the mitochondrion, via transient transfection of OMM-PKA, affects the protein levels of SOD2. (For both graphs: ***:p<0.001 vs. OMM-GFP, student t-test). All the data were pooled from experiments that were repeated at least three times which yielded similar results (a representative data set is shown).
Figure4.
Figure4.. Mitochondrial localized PKA promotes neuroprotection against glutamate oxidative toxicity by remodeling mitochondria and phosphorylatingDrp1.
A. Lysates derived from cells transiently transfected the indicated plasmids were immunoblotted for GFP in order to analyze the expression level of vectors. The representative Western blot shows that transient expression level of the indicated vectors were detectable and expressed at the expected molecular weights for each recombinant protein as published(1). B. Lysates derived from HT22 transfected with OMM-GFP,S-AKAP84,and OMM-PKA were immunoblotted for p-Drp1and total Drp1(T-Drp1)to analyze the ability of PKA modulating plasmids to phosphorylate the AKAP121/PKA substrate Drp1 under basal conditions.(***:p<0.001 vs.OMM-GFP, One-Way ANOVA, Tukey’s test) C. Lysates derived from HT22 transfected with OMM-GFP,S-AKAP84,and AKAP121-WT were immunoblotted for p-Drp1and total Drp1(T-Drp1)to analyze the ability of PKA modulating plasmids to phosphorylate the AKAP121/PKA substrates Drp1 in the presence of 250μM cAMP incubated for 2 h.(**:p<0.01,***:p<0.001 vs. OMM-GFP, One-Way ANOVA, Tukey’s test) D. Lysates derived from HT22 transfected with pcDNA3.1 and the full length AKAP121 were immunoblotted for p-Drp1and total Drp1(T-Drp1)to analyze the ability of PKA modulating plasmids to phosphorylate the AKAP121/PKA substrate Drp1 in the presence of 250μM cAMP incubated for 2 h.(*:p<0.05 vs. pcDNA3.1, student t-test) E. Image-based quantification of mitochondrial interconnectivity (area/perimeter ratio of mitochondrion per cell) in HT22 cells transiently transfected with the indicated PKA- modulating plasmids.(For both graphs: ***:p<0.001 vs. OMM-GFP, One-Way ANOVA, Tukey’s test). F. Imaged-based quantification of mitochondrial content (% of cytosol occupied by mitochondria) in HT22 cells transiently transfected with the indicated PKA- modulating plasmids. (For both graphs: **:p<0.01,***:p<0.001vs. OMM-GFP, One-Way ANOVA, Tukey’s test). G. Image-based quantification of mitochondrial interconnectivity (area/perimeter ratio of mitochondrion per cell) in HT22 cells transiently transfected with the indicated PKA- modulating plasmids.(For both graphs:**:p<0.01,***:p<0.001 vs. OMM-GFP, One-Way ANOVA, Tukey’s test). H. Quantification of mitochondrial content in HT22 cells transiently transfected with the indicated PKA- modulating plasmids.(For both graphs: *:p<0.05 vs. OMM-GFP, One-Way ANOVA, Tukey’s test). I. Representative immunofluorescent images of HT22 cells transfected with OMM-GFP, S-AKAP84 or OMM-PKAthat were stained with 30nmMitoTracker Red and 2ug/ml Hoechst 33342 for 15 min at 37°C to visualize mitochondria and nuclei respectively. RGB images were then captured through the midplane of the soma of cells by employing the API DeltaVision Elite Live cell Imaging System (a.e.i.MitoTracker Red; b.f.j.EGFP; c.g.k. Mergedimage of three colors; d.h.l. Hoechst33342 with bright field reference),Scale bar = 10μm. J. Representative immunofluorescent images of HT22 cells transfected with OMM-GFP, AKAP121-WT and AKAP121-△PKA were stained with 30nmMitoTracker Red and 2ug/ml Hoechst 33342 for 15 min at 37°C to visualize mitochondria and nuclei respectively. RGB images were captured through the midplane of the soma by employing the API DeltaVision Elite Live cell Imaging System (a.e.i.MitoTracker Red; b.f.j.EGFP; c.g.k. Merged image of three colors; d.h.l. Hoechst33342 with bright field reference),Scale bar = 10μm. All the data were pooled from experiments that were repeated at least three times which yielded similar results (a representative data set is shown).
Figure 5.
Figure 5.. Mitochondrial localized PKA increases total GSH, reduced mitochondrial ROS and elevates neuronal survival against oxidative glutamate toxicity.
A. Over-expression of S-AKAP84 or OMM-PKA can protect neuronal HT22 cells from oxidative glutamate toxicity. Cells were transfected for 24 h and seeded in a 96 well culture plate at 5000 cells/well,overnight and exposed to glutamate for 24 h. Cell viability was determined using the cck-8 assay.(For both graphs:**:p<0.01,***:p<0.001 vs. control, One-Way ANOVA, Tukey’s test). B. Representative bright field images of HT22 transfected with indicated vectors and incubated 4mM glutamate for 24 hours as analyzed by capturing phase contrast images with a phase-contrast microscope.It is worth noting that cells transiently expressing S-AKAP84 or OMM-PKA and treated with glutamate exhibited a healthier cell morphology and less number of apoptotic or floating cells compared to cells transfected with an empty vector in the presence of glutamate.Scale bar = 50μm. C-D. Total glutathione content was measured in HT22 cells transiently transfected with the indicated plasmids under baseline conditions normalized to protein concentration.(For the graphs: **:p<0.01,***:p<0.001 vs. OMM-GFP, One-Way ANOVA, C. Tukey’s test. D. student t-test). E. Total intracellular ATP content (μM ATP per μg of protein) was measured in HT22 cells transiently transfected with the indicated plasmids for 24 h. in the presence or absence of 4mM glutamate for another 24 h.(***:p<0.001 vs. con, One-Way ANOVA, Tukey’s test) F. Transfected HT22 cells were exposed to 4mM glutamate for the indicated time points and stained with 5 μM MitoSOX Red to analyze for the level of mitochondrial superoxide. The bar graphs show the compiled quantification of the mean fluorescence intensity of MitoSOX in glutamate-treated in HT22 cells as assessed by employing a fluorescence microplate reader and normalized to cell number measured by cck-8. (***:p<0.001 vs. OMM-GFP, One-Way ANOVA, Tukey’s test). G. Transfected HT22 cells were exposed to 4mM glutamate for the indicated time point and stained with 5 μM MitoSOX Red, then subjected to immunofluorescence microscope. All the data were pooled from experiments that were repeated at least three times which yielded similar results (a representative data set is shown).
Figure6.
Figure6.. The neuroprotective effects of AKAP121 are conferred via PKA-mediated phosphorylation of Drp1
A. Lysates derived from cells transiently transfected with OMM-GFP control or with the PKA phosphomimetic of Drp1 (Drp1- Ser656Asp) were immunoblotted for GFP to analyze the levels of recombinant GFP-tagged proteins attained in HT22 cells under basal conditions. B. HT22 cells were transfected with OMM-GFP control or with Drp1-S656D(Drp1- Ser656Asp) for 24 h. Cells were then stained with 30nM MitoTracker Red and 2ug/ml Hoechst 33342 for 15 min at 37°C to visualize mitochondria and nuclei respectively under basal conditions. Fluorescent images were captured through the midplane of the soma by employing a DeltaVision Elite Live cell Imaging System (a.e. MitoTracker Red; b.f. EGFP; c.g. Merged image of three colors; d.h. Hoechst33342 with bright field reference),Scale bar = 10μm. C. Quantification of mitochondrial interconnectivity (area/perimeter ratio per cell) in HT22 cells transiently expressing Drp1-S656D or OMM-GFP control. (*p<0.05 vs. OMM-GFP, student t-test). D. Quantification of mitochondrial content (% of cytosol occupied by mitochondria) in HT22 cells transiently expressing Drp1- S656D vector or OMM-GFP control. (***p<0.001 vs. OMM-GFP, student t-test). E.HT22 cells were transfected with OMM-GFP control or with AKAP121-WT, AKAP121-△PKA,Drp1-S656D for 24 h. Transfected HT22 cells were then subjected to 4mM glutamate insults for 4 hours and stained with 30nM Mito-Tracker Red and 2ug/ml Hoechst 33342 for 15 min at 37°C to visualize mitochondria and nuclei respectively.Fluorescent images were captured through the midplane of the soma by employing a DeltaVision Elite Live cell Imaging System (a.e.i.m.q. MitoTracker Red; b.f.j.n.r. EGFP; c.g.k.o.s. Merged image of three colors; d.h.i.p.t. Hoechst33342 with bright field reference)Scale bar = 10μm. F. Transient over-expression of Drp-S656D significantly protects HT22 cells from glutamate toxicity. Cells were transfected for 24 hours with the indicated plasmids and seeded in 96 well culture plates at 5,000 cells/well overnight prior to exposing cells with 4mM glutamate for 24 h. Cell viability was determined by employing the cck-8 assay. (***p<0.001 vs con, student t-test). right: The cell morphologies of cells exposed to glutamate were analyzed by capturing bright field images by employing a phase-contrast microscope. Note that HT22 cells transiently expressing Drp1-S656D showed a healthier cell morphology, less number of floaters and apoptotic cells (condensed/shrunken) as indicated by blue arrowhead.Scale bar = 50μm. G. Quantification of mitochondrial interconnectivity (area/perimeter ratio per cell) in HT22 cells transiently expressing AKAP121-WT,AKAP121-△PKA, Drp1-S656D and OMM-GFP in the absence or presence of 4 hr. incubation of 4mM glutamate .(***:p<0.001 One-Way ANOVA, Tukey’s test). H. Quantification of mitochondrial content (% of cytosol occupied by mitochondria) in HT22 cells transiently expressingAKAP121-WT, AKAP121-△PKA, Drp1-S656D and OMM-GFP in the absence or presence of a 4 hr. incubation of 4mM glutamate incubation. (*:p<0.05,**:p<0.01,***:p<0.001 One-Way ANOVA, Tukey’s test). All the data were pooled from experiments that were repeated at least three times which yielded similar results (a representative data set is shown).
Figure 7:
Figure 7:
Schematic model that depicts the neuroprotective mechanisms of AKAP121/PKA in the cell culture model of oxidative glutamate toxicity. In HT22 cells, external stimuli or toxicity as induced by exposures to 4mM glutamate, 10mM glutamate chronic exposure or to treatment with250μM of exogenous cAMP can lead to an intracellular elevation of cAMP. The increase in the intracellular level of cAMP level activates PKA, which leads to PKA-mediated phosphorylation of CREB and thereby eliciting a transcriptional-mediated upregulation of the level of AKAP121. AKAP121 is targeted to the OMM to increase the amount and specificity of PKA at the mitochondrion. In this manner, AKAP121 facilitates PKA-cAMP signaling at the mitochondrion, enhances oxidative phosphorylation and elevates Δψm. Furthermore, cAMP, AKAP121, and mitochondrial-PKA form a positive feed-forward loop which can enhance the strength and fidelity of PKA at the mitochondrion. Therefore, this feed-forward loop leads to enhanced survival of HT22 neuronal cells against oxidative glutamate toxicity via two mechanisms. First of all, mitochondrial PKA (AKAP121/PKA) can increase the rate of phosphorylation ofDrp1, leading to the inactivation of this mechanoenzyme and to enhanced mitochondrial fusion to form interconnected mitochondrial networks. Hence, this elevated state of mitochondrial fusion confers neuroprotection against oxidative glutamate toxicity. Secondly, mitochondrial PKA can enhance the binding of SOD2 mRNA to the KH domain of AKAP121, leading to an increase in the level of mitochondrial SOD2. In addition, increased level of AKAP121 is associated with an increase in the level of total GSH through an unknown mechanism. Overall, elevated PKA signaling at the mitochondrion and at the cytosolic/nuclear compartments induced by oxidative glutamate toxicity elicits compensatory signaling pathways that serve to increase the level of antioxidants in the mitochondrion and increases mitochondrial health to confer increased resistance of HT22 cells against oxidative stress.

Similar articles

Cited by

References

    1. T.Coyle J, and Puttfarcken P (1993) Oxidative stress, glutamate, and neurodegenerative disorders. Science 262(5134), 689–695. - PubMed
    1. Gardoni F, and Di Luca M (2015) Targeting glutamatergic synapses in Parkinson’s disease. Current opinion in pharmacology 20, 24–28 - PubMed
    1. Dong XX, Wang Y, and Qin ZH (2009) Molecular mechanisms of excitotoxicity and their relevance to pathogenesis of neurodegenerative diseases. Acta pharmacologica Sinica 30, 379–387 - PMC - PubMed
    1. Murphy TH, Miyamoto M, Sastre A, Schnaar RL, and Coyle JT (1989) Glutamate toxicity in a neuronal cell line involves inhibition of cystine transport leading to oxidative stress. Neuron 2, 1547–1558 - PubMed
    1. Fukui M, Song JH, Choi J, Choi HJ, and Zhu BT (2009) Mechanism of glutamate-induced neurotoxicity in HT22 mouse hippocampal cells. Eur J Pharmacol 617, 1–11 - PubMed

MeSH terms