. 2019 May 20;38(11):2074-2102.
doi: 10.1002/sim.8086. Epub 2019 Jan 16.

Using simulation studies to evaluate statistical methods

Affiliations

Using simulation studies to evaluate statistical methods

Tim P Morris et al. Stat Med. .

Abstract

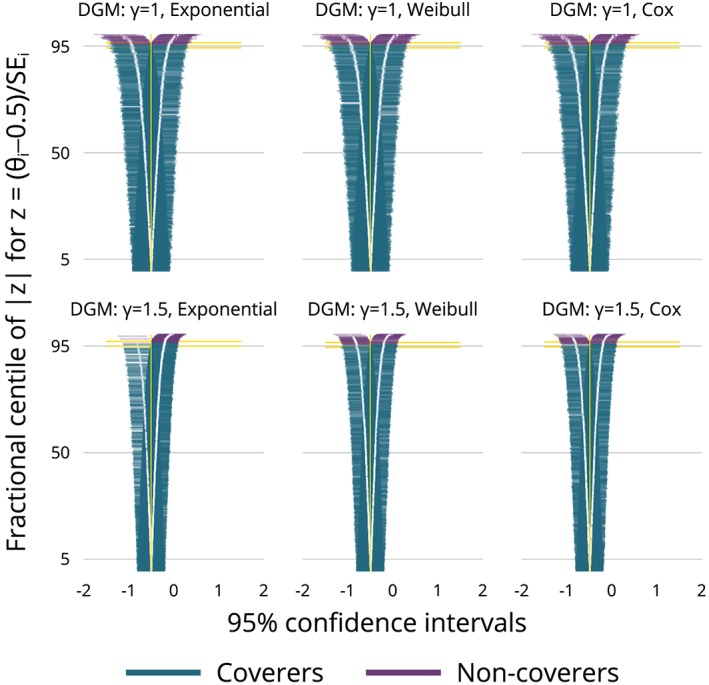
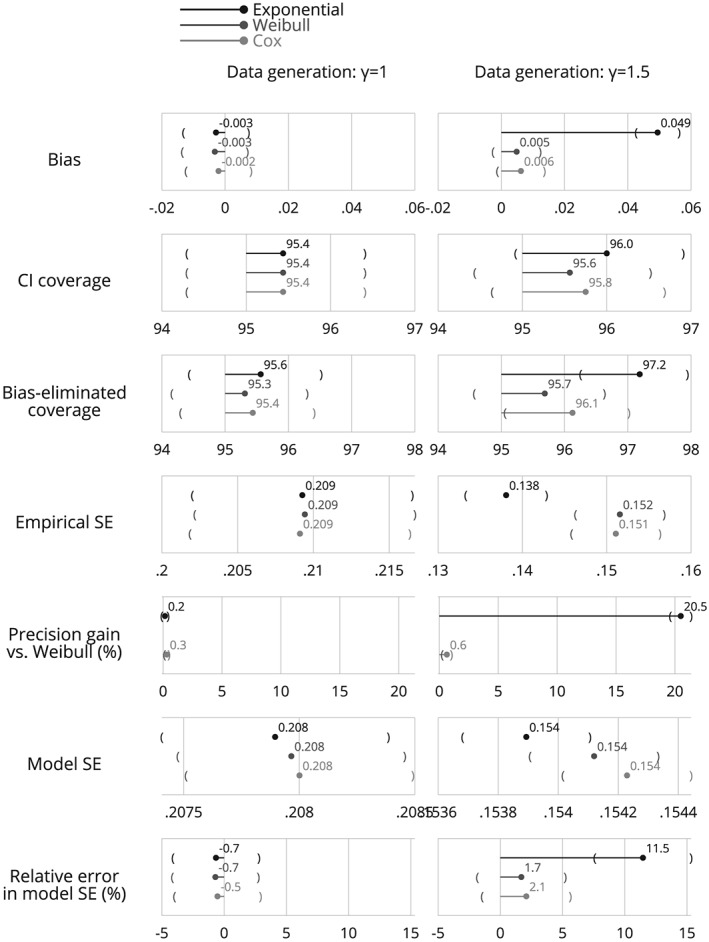
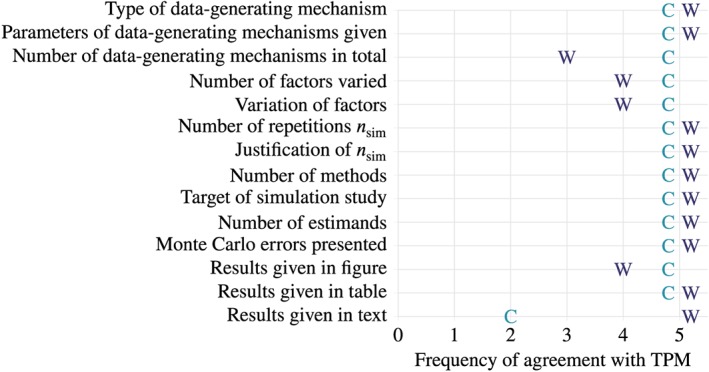
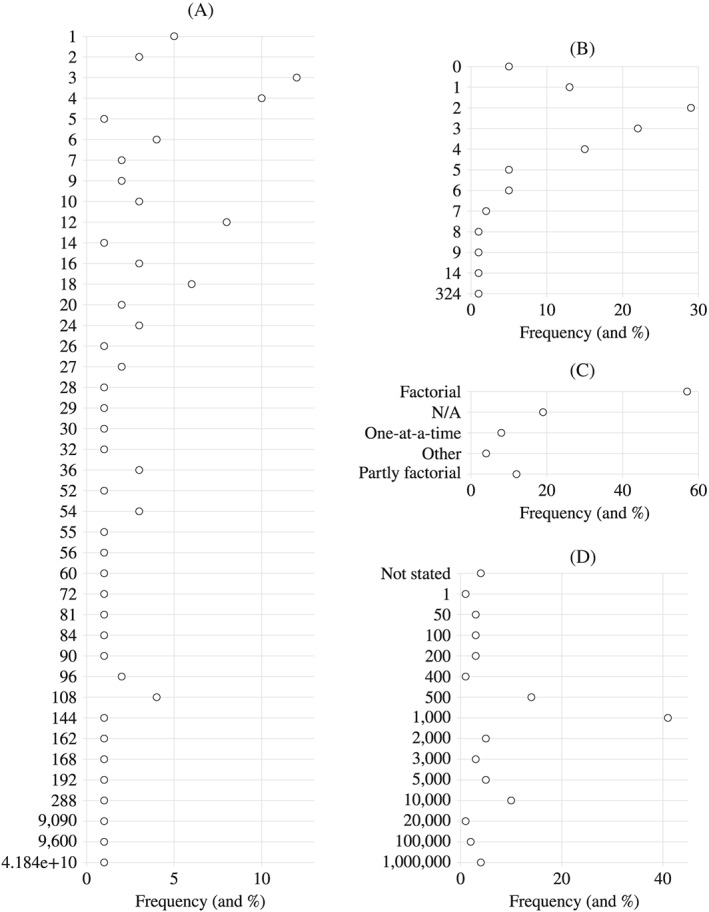
Simulation studies are computer experiments that involve creating data by pseudo-random sampling. A key strength of simulation studies is the ability to understand the behavior of statistical methods because some "truth" (usually some parameter/s of interest) is known from the process of generating the data. This allows us to consider properties of methods, such as bias. While widely used, simulation studies are often poorly designed, analyzed, and reported. This tutorial outlines the rationale for using simulation studies and offers guidance for design, execution, analysis, reporting, and presentation. In particular, this tutorial provides a structured approach for planning and reporting simulation studies, which involves defining aims, data-generating mechanisms, estimands, methods, and performance measures ("ADEMP"); coherent terminology for simulation studies; guidance on coding simulation studies; a critical discussion of key performance measures and their estimation; guidance on structuring tabular and graphical presentation of results; and new graphical presentations. With a view to describing recent practice, we review 100 articles taken from Volume 34 of Statistics in Medicine, which included at least one simulation study and identify areas for improvement.

Keywords: Monte Carlo; graphics for simulation; simulation design; simulation reporting; simulation studies.


Figures

Figure 1
Figure 1
The impacts of bias and empirical SE on root MSE and coverage of nominal 95% confidence intervals, compared for three methods: Method A is unbiased but imprecise; Method B is biased (independent of n obs) and more precise; Method C is biased (with bias 1/nobs) and the same precision as method B. The comparison of root MSE and coverage depends on the choice of n obs; the constant bias of method B dominates its increasingly poor MSE and coverage as n obs increases [Colour figure can be viewed at wileyonlinelibrary.com]
Figure 2
Figure 2
Visualisation of the true hazard rate over follow‐up time in the two data‐generating mechanisms. Black (flat) lines are for the first data‐generating mechanism, where γ = 1; Red curves are for the second, where γ = 1.5 [Colour figure can be viewed at wileyonlinelibrary.com]
Figure 3
Figure 3
Plot of the 1600 θ^i (left panels) and SE^(θ^)i (right panels) by data‐generating mechanisms, for the three analysis methods. The vertical axis is repetition number, to provide some separation between points. The yellow pipes are sample means [Colour figure can be viewed at wileyonlinelibrary.com]
Figure 4
Figure 4
Comparison of estimates for methods when γ = 1.5, where each point represents one repetition. A, Upper triangle displays θ^i; lower triangle displays SE^(θ^i); B, Plot of difference vs mean for θ^i and SE^(θ^i), with Weibull as the comparator
Figure 5
Figure 5
“Zip plot” of the 1600 confidence intervals for each data‐generating mechanism and analysis method. The vertical axis is the fractional centile of |z| with z=(θ^iθ)/ModSE associated with the confidence interval [Colour figure can be viewed at wileyonlinelibrary.com]
Figure 6
Figure 6
Lollipop plot of performance for measures of interest (Monte Carlo 95% confidence intervals in parentheses). Concerning features need not be highlighted since they are readily visible. See, also, Table 8
Figure A1
Figure A1
Reviewer agreement on key variables for Statistics in Medicine Volume 34 review. Frequency of agreement of TPM with IRW (marker W) and MJC (marker C). For the same frequency, C is nudged left and W right to avoid visual clash [Colour figure can be viewed at wileyonlinelibrary.com]
Figure A2
Figure A2
Results of Statistics in Medicine Volume 34 review for data‐generating mechanisms. Values are both frequency and %
Figure A3
Figure A3
Results of Statistics in Medicine Volume 34 review for estimands (A) and methods (B) evaluated

Similar articles

Cited by

References

    1. Feiveson AH. Power by simulation. Stata J. 2002;2(2):107‐124.
    1. Rubin DB. Bayesianly justifiable and relevant frequency calculations for the applies statistician. Ann Stat. 1984;12(4):1151‐1172.
    1. Grieve AP. Idle thoughts of a ‘well‐calibrated’ Bayesian in clinical drug development. Pharm Stat. 2016;15(2):96‐108. - PubMed
    1. Hoaglin DC, Andrews DF. The reporting of computation‐based results in statistics. Am Stat. 1975;29(3):122‐126.
    1. Hauck WW, Anderson S. A survey regarding the reporting of simulation studies. Am Stat. 1984;38(3):214‐216.

Publication types