Multicenter Study
. 2019 Sep;50(3):878-888.
doi: 10.1002/jmri.26652. Epub 2019 Jan 16.

Multisite reliability and repeatability of an advanced brain MRI protocol

Affiliations
Multicenter Study

Multisite reliability and repeatability of an advanced brain MRI protocol

Daniel L Schwartz et al. J Magn Reson Imaging. 2019 Sep.

Abstract

Background: MRI is the imaging modality of choice for diagnosis and intervention assessment in neurological disease. Its full potential has not been realized due in part to challenges in harmonizing advanced techniques across multiple sites.

Purpose: To develop a method for the assessment of reliability and repeatability of advanced multisite-multisession neuroimaging studies and specifically to assess the reliability of an advanced MRI protocol, including multiband fMRI and diffusion tensor MRI, in a multisite setting.

Study type: Prospective.

Population: Twice repeated measurement of a single subject with stable relapsing-remitting multiple sclerosis (MS) at seven institutions.

Field strength/sequence: A 3 T MRI protocol included higher spatial resolution anatomical scans, a variable flip-angle longitudinal relaxation rate constant (R1 ≡ 1/T1 ) measurement, quantitative magnetization transfer imaging, diffusion tensor imaging, and a resting-state fMRI (rsFMRI) series.

Assessment: Multiple methods of assessing intrasite repeatability and intersite reliability were evaluated for imaging metrics derived from each sequence.

Statistical tests: Student's t-test, Pearson's r, and intraclass correlation coefficient (ICC) (2,1) were employed to assess repeatability and reliability. Two new statistical metrics are introduced that frame reliability and repeatability in the respective units of the measurements themselves.

Results: Intrasite repeatability was excellent for quantitative R1 , magnetization transfer ratio (MTR), and diffusion-weighted imaging (DWI) based metrics (r > 0.95). rsFMRI metrics were less repeatable (r = 0.8). Intersite reliability was excellent for R1 , MTR, and DWI (ICC >0.9), and moderate for rsFMRI metrics (ICC∼0.4).

Data conclusion: From most reliable to least, using a new reliability metric introduced here, MTR > R1 > DWI > rsFMRI; for repeatability, MTR > DWI > R1 > rsFMRI. A graphical method for at-a-glance assessment of reliability and repeatability, effect sizes, and outlier identification in multisite-multisession neuroimaging studies is introduced.

Level of evidence: 1 Technical Efficacy: Stage 2 J. Magn. Reson. Imaging 2019;50:878-888.

Keywords: MRI; multiple sclerosis; multisite; reliability; repeatability.


Figures

Figure 1.
Figure 1.
Timeline, hardware and software details for data acquisition at each site. Sites are anonymized for reporting of all results, but are color coded the same throughout all figures. The bar plot illustrates the time between sessions at each site.
Figure 2.
Figure 2.
MTR and R1 image results. Left. Between session agreement for all sites for MTR (bottom) and R1 (top) for each tissue class. Right. Between site agreement for all tissue classes for mean MTR (bottom) and R1 (top).
Figure 3.
Figure 3.
Diffusion-weighted image results. Left and middle. Measurements of FA, MD, and the first eigenvalue (LD) over NAWM ROIs, grand site mean shown in bar graphs. Right. Mean over session within site for tensor measurements in lesion and NAWM.
Figure 4.
Figure 4.
rsFMRI image results. Top. Scatter plot depicting session-wise agreement for all sites (colors) and for each region pair (10 pairs), identity is depicted as a solid line, linear regression shown as a dotted line, and regression lines are drawn for each site (inset). Bottom. Lines drawn for each site across 10 region pairs (left), grand mean values between sites depicted in bar graph (right).
Figure 5.
Figure 5.
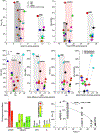
Repeatability and reliability of each MRI metric. Top two rows. RAJ plots of R1, MTR, DWI, and rsFMRI measurements, respectively. Interpretation of various elements of RAJ plots: a) taller tissue boxes indicate more variable measurement across site, b) proximity of a marker to the abscissa is proportional to that site’s reliability, c) the magnitude of the horizontal range bars is inversely proportional to that site’s repeatability, d) the horizontal overlap of tissue boxes is inversely proportional to the differentiability of tissue types using the method, e) the point on the abscissa of the traced “V” is the grand mean of that measurement. Bottom left. RAJ over all methods; bars are colored by RPT. Bottom right. The inverse relationship of ICC(2,1) and RAJ.

References

    1. Barkhof F The clinico-radiological paradox in multiple sclerosis revisited. Curr Opin Neurol 2002;15(3):239–245. - PubMed
    1. Oh J, Bakshi R, Calabresi PA, et al. The NAIMS cooperative pilot project: Design, implementation and future directions. Mult Scler 2017:1352458517739990. - PMC - PubMed
    1. Rooney WD, Johnson G, Li X, et al. Magnetic field and tissue dependencies of human brain longitudinal 1H2O relaxation in vivo. Magn Reson Med 2007;57(2):308–318. - PubMed
    1. Tagge I, O’Connor A, Chaudhary P, et al. Spatio-Temporal Patterns of Demyelination and Remyelination in the Cuprizone Mouse Model. PLoS One 2016;11(4):e0152480. - PMC - PubMed
    1. Chen JT, Easley K, Schneider C, et al. Clinically feasible MTR is sensitive to cortical demyelination in MS. Neurology 2013;80(3):246–252. - PMC - PubMed

Publication types