High-Throughput Architecture for Discovering Combination Cancer Therapeutics
- PMID: 30652536
- PMCID: PMC6873994
- DOI: 10.1200/CCI.17.00054
High-Throughput Architecture for Discovering Combination Cancer Therapeutics
Abstract
Purpose: The amount of available next-generation sequencing data of tumors, in combination with relevant molecular and clinical data, has significantly increased in the last decade and transformed translational cancer research. Even with the progress made through data-sharing initiatives, there is a clear unmet need for easily accessible analyses tools. These include capabilities to efficiently process large sequencing database projects to present them in a straightforward and accurate way. Another urgent challenge in cancer research is to identify more effective combination therapies.
Methods: We have created a software architecture that allows the user to integrate and analyze large-scale sequencing, clinical, and other datasets for efficient prediction of potential combination drug targets. This architecture permits predictions for all genes pairs; however, Food and Drug Administration-approved agents are currently lacking for most of the identified gene targets.
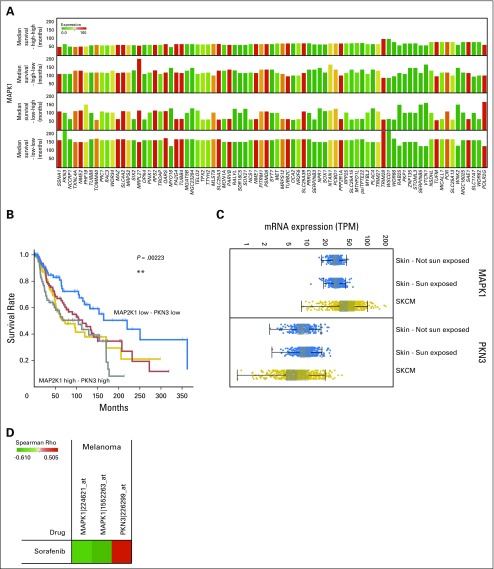
Results: By applying this approach, we performed a comprehensive study and analyzed all possible combination partners and identified potentially synergistic target pairs for 38 approved targets currently in clinical use. We further showed which genes could be synergistic prediction markers and potential targets with MAPK/ERK inhibitors for the treatment of melanoma. Moreover, we integrated a graph analytics technique in this architecture to identify pathways that could be targeted synergistically to enhance the efficacy of certain therapeutics in cancer.
Conclusion: The architecture and the results presented provide a foundation for discovering effective combination therapeutics.
Conflict of interest statement
Matt Gianni
Yong Qin
No relationship to disclose
Geert Wenes
No relationship to disclose
Becca Bandstra
No relationship to disclose
Anthony P. Conley
Vivek Subbiah
Raya Leibowitz-Amit
Suhendan Ekmekcioglu
No relationship to disclose
Elizabeth A. Grimm
No relationship to disclose
Jason Roszik
No relationship to disclose
Figures


Similar articles
-
Functional oncogene signatures guide rationally designed combination therapies to synergistically induce breast cancer cell death.Oncotarget. 2016 Jun 14;7(24):36138-36153. doi: 10.18632/oncotarget.9147. Oncotarget. 2016. PMID: 27153554 Free PMC article.
-
A 2015 update on predictive molecular pathology and its role in targeted cancer therapy: a review focussing on clinical relevance.Cancer Gene Ther. 2015 Sep;22(9):417-30. doi: 10.1038/cgt.2015.39. Epub 2015 Sep 11. Cancer Gene Ther. 2015. PMID: 26358176 Review.
-
IMPACT web portal: oncology database integrating molecular profiles with actionable therapeutics.BMC Med Genomics. 2018 Apr 20;11(Suppl 2):26. doi: 10.1186/s12920-018-0350-1. BMC Med Genomics. 2018. PMID: 29697364 Free PMC article.
-
The possibility of clinical sequencing in the management of cancer.Jpn J Clin Oncol. 2016 May;46(5):399-406. doi: 10.1093/jjco/hyw018. Epub 2016 Feb 24. Jpn J Clin Oncol. 2016. PMID: 26917600 Review.
-
CANEapp: a user-friendly application for automated next generation transcriptomic data analysis.BMC Genomics. 2016 Jan 13;17:49. doi: 10.1186/s12864-015-2346-y. BMC Genomics. 2016. PMID: 26758513 Free PMC article.
Cited by
-
Cancer Informatics in 2018: The Mysteries of the Cancer Genome Continue to Unravel, Deep Learning Approaches the Clinic, and Passive Data Collection Demonstrates Utility.Yearb Med Inform. 2019 Aug;28(1):236-238. doi: 10.1055/s-0039-1677931. Epub 2019 Aug 16. Yearb Med Inform. 2019. PMID: 31419838 Free PMC article.
-
Gene Expression Analysis Identifies Novel Targets for Cervical Cancer Therapy.Front Immunol. 2018 Sep 19;9:2102. doi: 10.3389/fimmu.2018.02102. eCollection 2018. Front Immunol. 2018. PMID: 30283446 Free PMC article.
-
Drug combination sensitivity scoring facilitates the discovery of synergistic and efficacious drug combinations in cancer.PLoS Comput Biol. 2019 May 20;15(5):e1006752. doi: 10.1371/journal.pcbi.1006752. eCollection 2019 May. PLoS Comput Biol. 2019. PMID: 31107860 Free PMC article.
-
Repression of GCN5 expression or activity attenuates c-MYC expression in non-small cell lung cancer.Am J Cancer Res. 2019 Aug 1;9(8):1830-1845. eCollection 2019. Am J Cancer Res. 2019. PMID: 31497362 Free PMC article.
References
-
- National Cancer Institute: Genomic Data Commons. https://gdc.cancer.gov.
-
- Oncology Research Information Exchange Network: ORIEN homepage. http://oriencancer.org/
-
- American Association for Cancer Research: Project GENIE. http://www.aacr.org/Research/Research/Pages/aacr-project-genie.aspx.
-
- Webster RM: Combination therapies in oncology. Nat Rev Drug Discov 15:81-82, 2016 - PubMed
Publication types
MeSH terms
Substances
Grants and funding
LinkOut - more resources
Full Text Sources
Miscellaneous