Computational Model of Progression to Multiple Myeloma Identifies Optimum Screening Strategies
- PMID: 30652561
- PMCID: PMC6873949
- DOI: 10.1200/CCI.17.00131
Computational Model of Progression to Multiple Myeloma Identifies Optimum Screening Strategies
Abstract
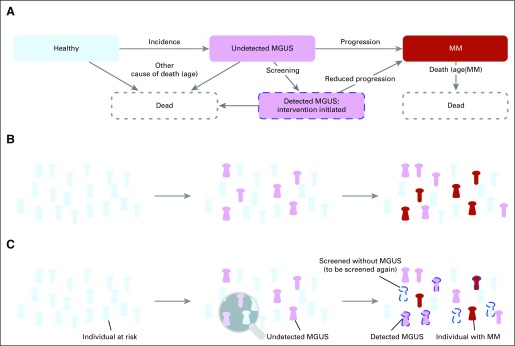
Purpose: Recent advances have uncovered therapeutic interventions that might reduce the risk of progression of premalignant diagnoses, such as monoclonal gammopathy of undetermined significance (MGUS) to multiple myeloma (MM). It remains unclear how to best screen populations at risk and how to evaluate the ability of these interventions to reduce disease prevalence and mortality at the population level. To address these questions, we developed a computational modeling framework.
Materials and methods: We used individual-based computational modeling of MGUS incidence and progression across a population of diverse individuals to determine best screening strategies in terms of screening start, intervals, and risk-group specificity. Inputs were life tables, MGUS incidence, and baseline MM survival. We measured MM-specific mortality and MM prevalence after MGUS detection from simulations and mathematic modeling predictions.
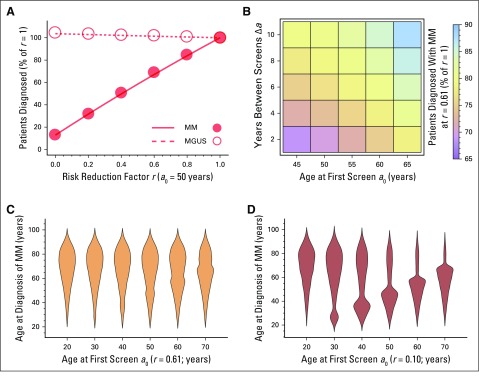
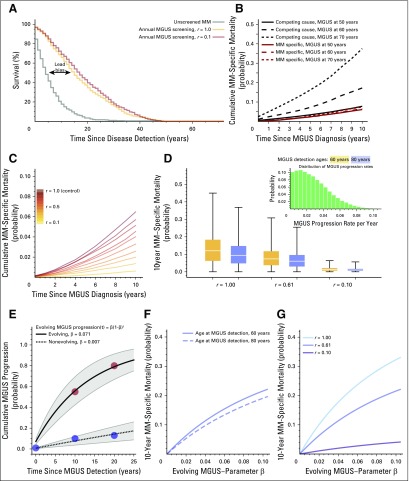
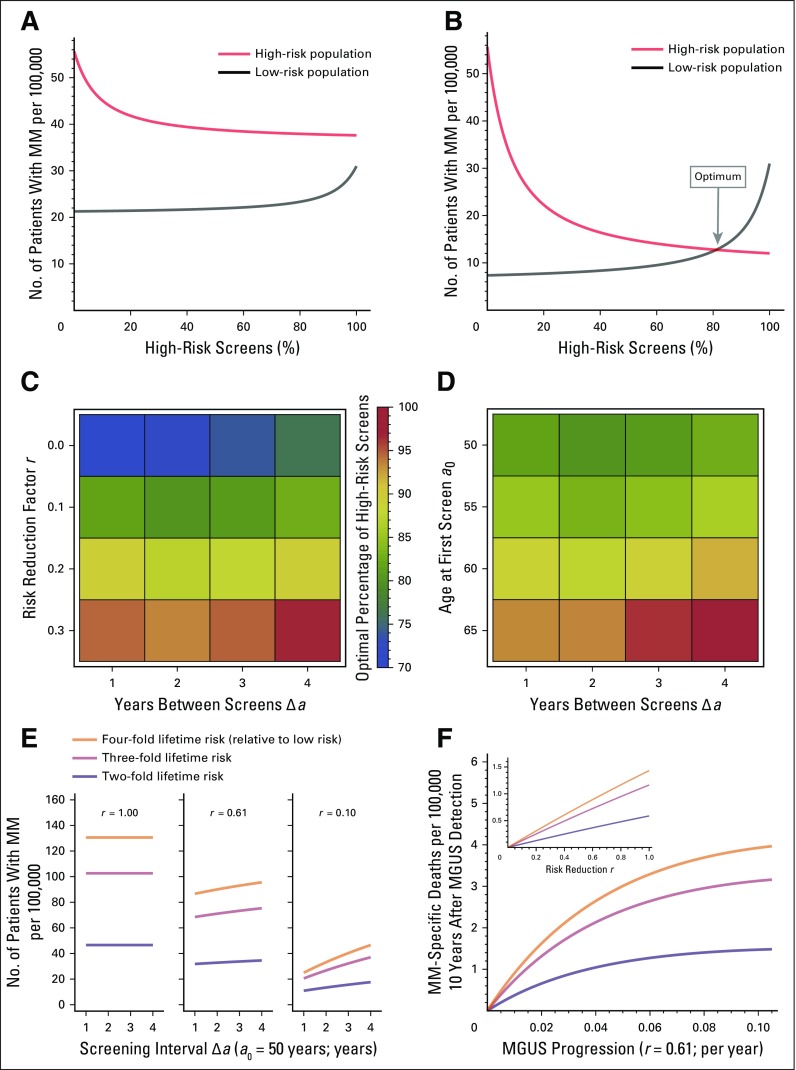
Results: Our framework is applicable to a wide spectrum of screening and intervention scenarios, including variation of the baseline MGUS to MM progression rate and evolving MGUS, in which progression increases over time. Given the currently available point estimate of progression risk reduction to 61% risk, starting screening at age 55 years and performing follow-up screening every 6 years reduced total MM prevalence by 19%. The same reduction could be achieved with starting screening at age 65 years and performing follow-up screening every 2 years. A 40% progression risk reduction per patient with MGUS per year would reduce MM-specific mortality by 40%. Specifically, screening onset age and screening frequency can change disease prevalence, and progression risk reduction changes both prevalence and disease-specific mortality. Screening would generally be favorable in high-risk individuals.
Conclusion: Screening efforts should focus on specifically identified groups with high lifetime risk of MGUS, for which screening benefits can be significant. Screening low-risk individuals with MGUS would require improved preventions.
Conflict of interest statement
Philipp M. Altrock
No relationship to disclose
Jeremy Ferlic
No relationship to disclose
Tobias Galla
Michael H. Tomasson
No relationship to disclose
Franziska Michor
No relationship to disclose
Figures
Similar articles
-
The Role of Diagnosis and Clinical Follow-up of Monoclonal Gammopathy of Undetermined Significance on Survival in Multiple Myeloma.JAMA Oncol. 2015 May;1(2):168-74. doi: 10.1001/jamaoncol.2015.23. JAMA Oncol. 2015. PMID: 26181017
-
Monoclonal Gammopathy of Undetermined Significance After Kidney Transplantation: Single-Center Experience.Transplantation. 2017 Nov;101(11):e337-e342. doi: 10.1097/TP.0000000000001884. Transplantation. 2017. PMID: 28731904
-
Monoclonal Gammopathy of Undetermined Significance: Current Concepts and Future Prospects.Curr Hematol Malig Rep. 2020 Apr;15(2):45-55. doi: 10.1007/s11899-020-00569-2. Curr Hematol Malig Rep. 2020. PMID: 32222885 Review.
-
Asymptomatic Incidence of Monoclonal Gammopathy of Undetermined Significance and Preclinical Duration to Myeloma Diagnosis: A Modeling Study.Cancer Epidemiol Biomarkers Prev. 2024 Dec 2;33(12):1690-1697. doi: 10.1158/1055-9965.EPI-24-0490. Cancer Epidemiol Biomarkers Prev. 2024. PMID: 39106151 Free PMC article.
-
[Monoclonal gammopathy of undetermined significance--potential risk factor of multiple myeloma].Przegl Lek. 2012;69(5):194-6. Przegl Lek. 2012. PMID: 23050415 Review. Polish.
Cited by
-
Designing optimal allocations for cancer screening using queuing network models.PLoS Comput Biol. 2022 May 27;18(5):e1010179. doi: 10.1371/journal.pcbi.1010179. eCollection 2022 May. PLoS Comput Biol. 2022. PMID: 35622852 Free PMC article.
-
Optimal Timing for Cancer Screening and Adaptive Surveillance Using Mathematical Modeling.Cancer Res. 2021 Feb 15;81(4):1123-1134. doi: 10.1158/0008-5472.CAN-20-0335. Epub 2020 Dec 8. Cancer Res. 2021. PMID: 33293425 Free PMC article.
-
The 2019 mathematical oncology roadmap.Phys Biol. 2019 Jun 19;16(4):041005. doi: 10.1088/1478-3975/ab1a09. Phys Biol. 2019. PMID: 30991381 Free PMC article. Review.
-
System-based approaches as prognostic tools for glioblastoma.BMC Cancer. 2019 Nov 12;19(1):1092. doi: 10.1186/s12885-019-6280-2. BMC Cancer. 2019. PMID: 31718568 Free PMC article. Review.
-
Prevention Is the Best Treatment: The Case for Understanding the Transition from Monoclonal Gammopathy of Undetermined Significance to Myeloma.Int J Mol Sci. 2018 Nov 16;19(11):3621. doi: 10.3390/ijms19113621. Int J Mol Sci. 2018. PMID: 30453544 Free PMC article. Review.
References
-
- National Cancer Institute : Cancer incidence: Surveillance, Epidemiology, and End Results (SEER) registries research data. http://seer.cancer.gov/data
-
- Hideshima T, Mitsiades C, Tonon G, et al. : Understanding multiple myeloma pathogenesis in the bone marrow to identify new therapeutic targets. Nat Rev Cancer 7:585-598, 2007 - PubMed
-
- Raab MS, Podar K, Breitkreutz I, et al. : Multiple myeloma. Lancet 374:324-339, 2009 - PubMed
-
- Kuehl WM, Bergsagel PL: Multiple myeloma: Evolving genetic events and host interactions. Nat Rev Cancer 2:175-187, 2002 - PubMed
Publication types
MeSH terms
Grants and funding
LinkOut - more resources
Full Text Sources
Medical