. 2019 Aug 15;145(4):901-915.
doi: 10.1002/ijc.32138. Epub 2019 Feb 7.

LIPG-promoted lipid storage mediates adaptation to oxidative stress in breast cancer

Affiliations

LIPG-promoted lipid storage mediates adaptation to oxidative stress in breast cancer

Cristina Cadenas et al. Int J Cancer. .

Abstract

Endothelial lipase (LIPG) is a cell surface associated lipase that displays phospholipase A1 activity towards phosphatidylcholine present in high-density lipoproteins (HDL). LIPG was recently reported to be expressed in breast cancer and to support proliferation, tumourigenicity and metastasis. Here we show that severe oxidative stress leading to AMPK activation triggers LIPG upregulation, resulting in intracellular lipid droplet accumulation in breast cancer cells, which supports survival. Neutralizing oxidative stress abrogated LIPG upregulation and the concomitant lipid storage. In human breast cancer, high LIPG expression was observed in a limited subset of tumours and was significantly associated with shorter metastasis-free survival in node-negative, untreated patients. Moreover, expression of PLIN2 and TXNRD1 in these tumours indicated a link to lipid storage and oxidative stress. Altogether, our findings reveal a previously unrecognized role for LIPG in enabling oxidative stress-induced lipid droplet accumulation in tumour cells that protects against oxidative stress, and thus supports tumour progression.

Keywords: LIPG; PLIN2; TXNRD1; breast cancer; endothelial lipase; lipid droplets; oxidative stress.


Figures

Figure 1
Figure 1
LIPG overexpression in MCF‐7 cells results in intracellular lipid storage. MCF‐7 cells were transfected with a LIPG construct (LIPG‐OE) or an empty vector (EV) and incubated for 48 h with (a) 800 μg HDL, (b) 800 μg PC‐OA in serum‐free DMEM, (c) 800 μg oleic acid (OA) complexed to bovine serum albumin and (d) no substrate. Intracellular triacylglyceride (TAG) levels were quantified with the triglyceride quantification assay kit. PLIN2 mRNA levels were analysed by qPCR. Lipid droplets were visualized with Bodipy 493/503 staining (green). Nuclei were stained with DAPI (blue). The bars represent the mean ±SEM and pictures are representative of three independent experiments. *p < 0.05; **p < 0.01; ***p < 0.001, unpaired two‐tailed Student's t‐test. [Color figure can be viewed at wileyonlinelibrary.com]
Figure 2
Figure 2
Upregulation of LIPG in NeuT‐induced senescence contributes to lipid storage. (a) Representative Western blot showing expression of the NeuT oncogene in MCF‐7/NeuT cells treated with doxycycline (+dox) or untreated (−dox) at different time points. (b) Immunofluorescence illustrating senescence‐associated morphological changes and co‐induction of the reporter EGFP (green) upon dox treatment. The actin cytoskeleton was stained with rhodamine phalloidin (red); nuclei were stained with DAPI (blue); scale bar: 50 μm. (c) qPCR showing LIPG mRNA expression in MCF‐7/NeuT cells incubated with/without dox during the indicated time periods. Data represent the mean fold change in mRNA relative to time point 0 h ± SEM (n = 3). (d) Representative Western blot showing the 68 kDa LIPG protein and its 40 kDa cleavage product in supernatants of MCF‐7/NeuT cells (6d −/+ dox) incubated with heparin and densitometric quantification of the 68 kDa LIPG band from Western blots signals of three independent experiments (see also Fig. S3, Supporting Information). (e) Quantification of cellular triacylglycerides (TAG) in MCF‐7/NeuT cells cultivated for 7d with/without dox (time point of high LIPG expression). (f) PLIN2 mRNA expression, analysed by qPCR as in (c). (g) Quantification of cellular triacylglycerides (TAG) in MCF‐7/NeuT cells cultivated for 6d with/without dox (±dox) in the presence or absence of 16 nM or 32 nM of the LIPG inhibitor GSK264220A. (h) Oil Red O (ORO) staining (red) to visualize lipid droplets in MCF‐7/NeuT cells treated for 6d‐7d ±dox in the presence or absence of the LIPG inhibitor GSK264220A (32 nM); blue: DAPI green: EGFP. Scale bar: 40 μm. All bar plots represent the mean ± SEM of three independent experiments. **p < 0.01; ***p < 0.001 (for comparison between –dox and + dox incubated cells); # p < 0.05 (dox + GSK264220A‐incubated vs. dox only‐incubated cells); + p < 0.05 (GSK264220A‐treated vs. untreated cells). p‐Values were calculated by unpaired two‐tailed Student's t‐test. [Color figure can be viewed at wileyonlinelibrary.com]
Figure 3
Figure 3
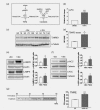
LIPG becomes upregulated upon cellular stress‐mediated inhibition of de novo fatty acid synthesis (FAS). (a) Schematic illustration of the initial steps of de novo FAS, regulation of acetyl‐CoA carboxylase (ACC) by AMPK, and pharmacological inhibition by TOFA and cerulenin. (b) qPCR analysis of LIPG mRNA expression in MCF‐7 cells incubated for 24 h with 6 μM TOFA (n = 4). (c) Representative Western blot showing protein levels of TXNRD1 in MCF‐7/NeuT cells incubated with/without dox at the indicated time points. (d) TBARS assay showing levels of ROS in cellular extracts of MCF‐7/NeuT cells incubated 7d with/without dox (n = 3). (e) Representative Western blots showing the phosphorylation status of AMPK in MCF‐7/NeuT cells (6d with/without dox) and densitometric quantification of the ratios of phospho‐AMPK (p‐AMPK) and total‐AMPK (t‐AMPK) to β‐actin from Western blot signals of three independent experiments. (f) Representative Western blot showing the phosphorylation status of ACC in MCF‐7/NeuT cells (6d with/without dox) and densitometric quantification of the ratios of phospho‐ACC (p‐ACC) and total‐ACC (t‐ACC) to calnexin from Western blot signals of three independent experiments. Bars indicate mean ± SEM. ***p < 0.001; *p < 0.05, unpaired two‐tailed Student's t‐test. (g) Mitochondrial integrity of cells transfected with LIPG or empty vector (EV), fed with LIPG substrate (PC) and subsequently treated with TOFA to block fatty acid synthesis. The bar diagrams represent the mean ± SEM of three independent experiments. ***p < 0.001, unpaired two‐tailed Student's t‐test.
Figure 4
Figure 4
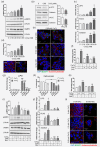
Upregulation of LIPG by CoCl2 contributes to lipid storage and adaptation to oxidative stress and is abrogated by ROS scavengers. (a) Representative Western blot showing AMPK phosphorylation in MCF‐7 cells exposed to different concentrations of CoCl2 for 24 h and densitometric quantification of the ratio (phospho‐AMPK/total‐AMPK) from Western blot signals of three independent experiments. (b) Representative Western blot showing ACC phosphorylation in MCF‐7 cells exposed to 0.89 mM of CoCl2 for 24 h and densitometric quantification of the ratios (p‐ACC and t‐ACC to calnexin) from Western blot signals of three independent experiments. (c) qPCR analysis showing LIPG, PLIN2 and TXNRD1 mRNA levels in MCF‐7 cells treated for 24 h with the indicated concentrations of CoCl2. (d) Quantification of triacylglycerides (TAG) in MCF‐7 cells exposed for 24 h to the indicated concentrations of CoCl2 and visualization of lipid droplets by BODIPY 493/503 staining (green) in 0.89 mM CoCl2‐treated and untreated (FM) MCF‐7 cells; red: Rhodamine phalloidin staining of the actin cytoskeleton; blue: DAPI. Scale bars: 20 μm. (e) Visualization of lipid droplets in MCF‐7 cells exposed to 0.89 mM CoCl2 for 24 h in the presence or absence of 16 nM or 32 nM of the LIPG inhibitor GSK264220A. red: Rhodamine phalloidin staining of the actin cytoskeleton; blue: DAPI. Scale bars: 40 μm. (f) Quantification of TAGs in CoCl2‐treated MCF‐7 cells in the presence or absence of 16 nM or 32 nM GSK264220A (duplicates are shown). (g) qPCR analysis showing LIPG mRNA levels in MCF‐7 cells after transfection with scrambled si‐RNA as a negative control (si‐neg) and two different si‐RNA oligos targeting LIPG (si‐LIPG‐A and si‐LIPG‐B), compared to FM (full media, non‐transfected control) and Lipo (Lipofectamine only, mock‐transfected) and subsequent 24 h‐exposure to CoCl2. (h) Cell Titer Blue viability assay showing cell survival after three more days under the same conditions as in (g). Bar diagrams represent the mean ± SEM of three independent experiments; *p < 0.05; **p < 0.01; ****p < 0.0001 for comparison of each of the siRNAs with the negative control (scramble, si‐neg). #### p < 0.0001; ### p < 0.001 for comparisons to untreated cells (FM). p‐Values were calculated by unpaired two‐tailed Student's t‐test. (i) Representative Western blot showing AMPK phosphorylation in MCF‐7 cells exposed to 0.5 mM or 0.89 mM CoCl2 alone or in the presence of 20 mM NAC for 24 h and densitometric quantification of the ratio (phospho‐AMPK/total‐AMPK) from Western blot signals of three independent experiments. (j) qPCR analysis showing mRNA levels of LIPG, PLIN2 and TXNRD1 in MCF‐7 cells exposed to CoCl2 in the presence or absence of 20 mM NAC. (k) Quantification of cellular TAGs in MCF‐7 cells exposed to CoCl2 in the presence or absence of NAC. (l) Visualization of lipid droplets by BODIPY 493/503 (green) in CoCl2‐treated in MCF‐7 cells in the presence or absence of 20 mM NAC; red: Rhodamine phalloidin staining of the actin cytoskeleton; blue: DAPI Scale bars: 40 μm. All bar diagrams represent the mean ± SEM of three independent experiments. *p < 0.05; **p < 0.01; ***p < 0.001 (CoCl2‐treated vs. untreated cells); # p < 0.05; ## p < 0.01; ### p < 0.001 (NAC‐treated or GSK264220A‐treated vs. untreated cells). p‐Values were calculated by unpaired two‐tailed Student's t‐test. [Color figure can be viewed at wileyonlinelibrary.com]
Figure 5
Figure 5
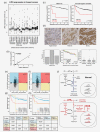
Expression of LIPG in human breast cancer and association with metastasis‐free survival. (a) Box plots showing the distribution of LIPG mRNA expression in 18 breast cancer datasets, including node‐negative, untreated cohorts as well as cohorts of patients who had received adjuvant (tamoxifen (TAM) only), hormonal and/or chemotherapy and/or both and/or unknown treatment (adjuvant*) and neoadjuvant therapy. (b) Correlation of Affymetrix and qPCR results with Pearson correlation r = 0.9623, p < 0.001. (c) Kaplan–Meier plots showing association of high LIPG expressing tumours (4 out of 200 tumours using the cut‐off log2 ≥ 98th percentile) with shorter metastasis free survival (MFS) in the Mainz cohort (GSE11121) (left) and in the combined cohort of untreated patients (16 out of 824 tumours, consisting of GSE11121, GSE2034, GSE5327, GSE6532 and GSE7390) (right). p*: p‐Value of the permutation test; p: p‐Value from the log‐rank test. (d) top: Representative images of LIPG IHC of 259 node‐negative breast carcinomas of the tissue microarray (TMA); scale bars: 100 μm; (d) bottom, left: barplot showing LIPG protein expression distribution in the TMA; (d) bottom, middle: Kaplan–Meier plot of the association of LIPG protein expression (as determined by IHC in the tissue array) with metastasis free survival (MFS). p: p‐Value of the log‐rank test; (d) bottom right: Association between LIPG mRNA (Affymetrix data) and LIPG protein expression (IHC data) in the Mainz cohort. (e) Scatter plots displaying the relationship between expression of LIPG and PLIN2, and (f) between expression of LIPG and TXNRD1 in the combined cohort of node‐negative untreated breast cancer patients. The dashed lines represent the cut‐off for LIPG (log2 ≥ 98th percentile) and the median for PLIN2 and TXNRD1. The number of samples in each quadrant is shown. P: p‐Value from Fisher's exact test. (g) Kaplan–Meier plots showing association of LIPG and PLIN2 and (h) LIPG and TXNRD1 with MFS in each of the patient subgroups stratified according to the aforementioned cutpoints. p‐Values of the log‐rank test for the pairwise comparisons are shown in the corresponding tables. (i) Proposed model: Adaptation of tumour cells to oxidative stress by LIPG: Under normal conditions cells synthesise fatty acids (FA) de novo via FAS, which consumes NADPH. Basal levels of LIPG may supply FA as well. Upon oxidative stress, activation of AMPK triggers a metabolic reprogramming that turns down ATP/NADPH consuming pathways such as the de novo FAS, enabling NADPH‐dependent protein repair via TXNRD1/TXN. Upregulation of LIPG along with PLIN2 and TXNRD1 occurs. Secreted LIPG provides FA that become stored as triglycerides in PLIN2‐coated lipid droplets. These support mitochondrial integrity, possibly via lipid remodeling, and thus protect against ROS.

Similar articles

Cited by

References

    1. Santos CR, Schulze A. Lipid metabolism in cancer. FEBS J 2012;279:2610–23. - PubMed
    1. Zaidi N, Lupien L, Kuemmerle NB, et al. Lipogenesis and lipolysis: the pathways exploited by the cancer cells to acquire fatty acids. Prog Lipid Res 2013;52:585–9. - PMC - PubMed
    1. Kuhajda FP. Fatty acid synthase and cancer: new application of an old pathway. Cancer Res 2006;66:5977–80. - PubMed
    1. Kuemmerle NB, Rysman E, Lombardo PS, et al. Lipoprotein lipase links dietary fat to solid tumor cell proliferation. Mol Cancer Therap 2011;10:427–36. - PMC - PubMed
    1. Jaye M, Lynch KJ, Krawiec J, et al. A novel endothelial‐derived lipase that modulates HDL metabolism. Nat Genet 1999;21:424–8. - PubMed

Publication types