. 2019 Jan 17;14(1):e0210000.
doi: 10.1371/journal.pone.0210000. eCollection 2019.

Ground reaction force metrics are not strongly correlated with tibial bone load when running across speeds and slopes: Implications for science, sport and wearable tech

Affiliations

Ground reaction force metrics are not strongly correlated with tibial bone load when running across speeds and slopes: Implications for science, sport and wearable tech

Emily S Matijevich et al. PLoS One. .

Abstract

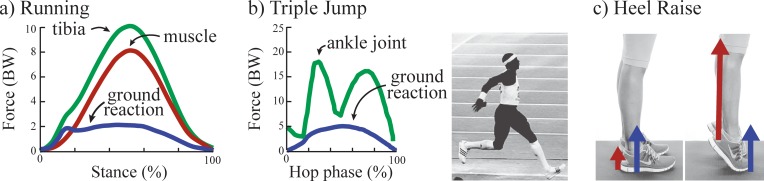
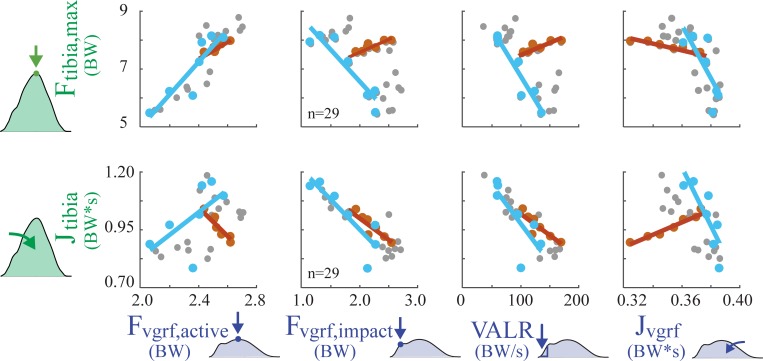
Introduction: Tibial stress fractures are a common overuse injury resulting from the accumulation of bone microdamage due to repeated loading. Researchers and wearable device developers have sought to understand or predict stress fracture risks, and other injury risks, by monitoring the ground reaction force (GRF, the force between the foot and ground), or GRF correlates (e.g., tibial shock) captured via wearable sensors. Increases in GRF metrics are typically assumed to reflect increases in loading on internal biological structures (e.g., bones). The purpose of this study was to evaluate this assumption for running by testing if increases in GRF metrics were strongly correlated with increases in tibial compression force over a range of speeds and slopes.

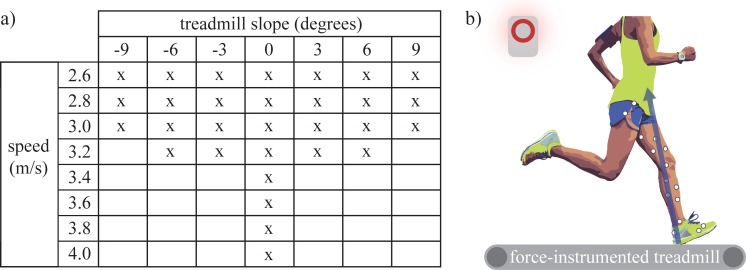
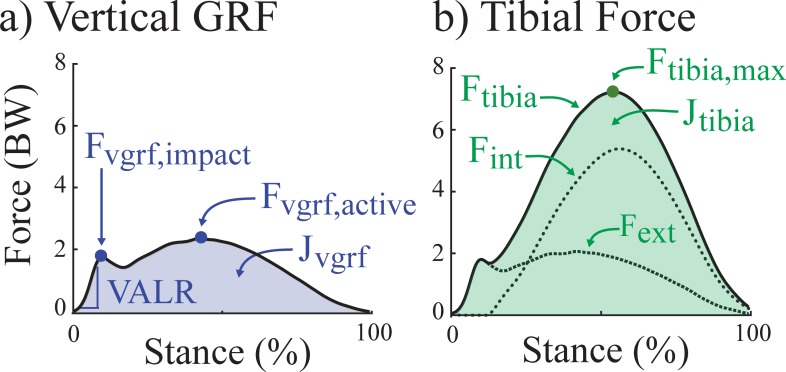
Methods: Ten healthy individuals performed running trials while we collected GRFs and kinematics. We assessed if commonly-used vertical GRF metrics (impact peak, loading rate, active peak, impulse) were strongly correlated with tibial load metrics (peak force, impulse).

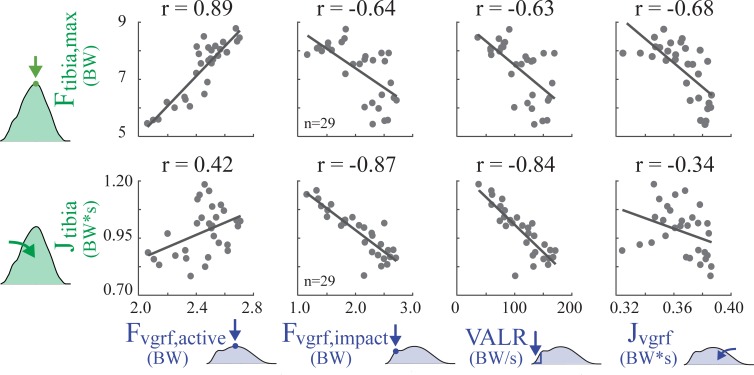
Results: On average, increases in GRF metrics were not strongly correlated with increases in tibial load metrics. For instance, correlating GRF impact peak and loading rate with peak tibial load resulted in r = -0.29±0.37 and r = -0.20±0.35 (inter-subject mean and standard deviation), respectively. We observed high inter-subject variability in correlations, though most coefficients were negligible, weak or moderate. Seventy-six of the 80 subject-specific correlation coefficients computed indicated that higher GRF metrics were not strongly correlated with higher tibial forces.

Conclusions: These results demonstrate that commonly-used GRF metrics can mislead our understanding of loading on internal structures, such as the tibia. Increases in GRF metrics should not be assumed to be an indicator of increases in tibial bone load or overuse injury risk during running. This has important implications for sports, wearable devices, and research on running-related injuries, affecting >50 scientific publications per year from 2015-2017.


Conflict of interest statement

The authors have declared that no competing interests exist.

Figures

Fig 1
Fig 1. Examples of GRFs vs. tibial bone loading.
(A) Tibial bone compression force (green) is much larger than GRF (blue) during running due to forces from muscle contractions (red); adapted from [21]. Forces are reported in body weights (BWs). (B) Peaks in tibial force (at the ankle joint, green) do not temporally coincide with peaks in GRF (blue) during the triple jump; adapted from [25]. Note, the GRF impact peak is not depicted here because it was not reported in this prior study, but it would have occurred at 0% of the cycle. (C) Standing flat footed vs. standing on one's toes results in the same GRF (blue), but different tibial forces, due to calf muscle contraction force (red) [26].
Fig 2
Fig 2. Summary of methods.
(A) Each subject performed 30 running trials at a combination of speeds and slopes. (B) Experimental protocol involved subjects running on a force-instrumented treadmill while GRFs (blue vector) and lower-limb kinematics were recorded (white circles represent motion capture markers).
Fig 3
Fig 3. Outcome metrics.
(A) Four commonly-used vertical GRF metrics: Fvgrf,impact: impact peak; VALR: vertical average loading rate; Fvgrf,active: active peak; Jvgrf: total vertical impulse. (B) Two tibial bone force metrics: Ftibia,max: maximum tibial compression force; Jtibia: tibial compression force impulse. Two additional force estimates are shown for reference: Fext: the contribution of the external GRF to tibial compression; Fint: the contribution of internal muscle force to tibial compression.
Fig 4
Fig 4. Regression results for GRF metrics vs. tibial bone load metrics across 30 running trials, for a single subject (Subject 1).
Each gray dot represents a single condition (i.e., a given speed and slope from Fig 2), and n indicates number of running conditions that exhibited a measurable GRF impact peak for Subject 1. The correlation coefficient (r) was computed for Subject 1 across all running speeds and slopes. Note that no single subject should be considered representative given the large inter-subject variability observed. For instance, the one strong correlation shown for this subject (r = 0.89) was as low as r = 0.16 for another subject. The correlation coefficients for each individual subject are reported in Table 1.
Fig 5
Fig 5. Force trends due to changing speed vs. changing slope for a single subject (Subject 1).
Lines represent regression results for GRF metrics vs. tibial bone load metrics when only speed or slope was varied. Dark orange dots represent conditions when speed was varied while running on a fixed slope (level ground). Light blue dots represent conditions when ground slope was varied while speed is held constant (at 2.6 m/s). Small gray dots are all remaining parameter sweep conditions.

Similar articles

Cited by

References

    1. Currey JD. Bones: Structure and Mechanics. Princeton University Press; 2013.
    1. Gallagher S, Schall MC. Musculoskeletal disorders as a fatigue failure process: evidence, implications and research needs. Ergonomics. 2017;60: 255–269. 10.1080/00140139.2016.1208848 - DOI - PubMed
    1. Cosman F, Ruffing J, Zion M, Uhorchak J, Ralston S, Tendy S, et al. Determinants of stress fracture risk in United States Military Academy cadets. Bone. 2013;55: 359–366. 10.1016/j.bone.2013.04.011 - DOI - PubMed
    1. Brukner PD, Bradshaw C, Khan K, White S, Crossley KM. Stress Fractures: A Review of 180 Case. Clin J Sport Med. 1996; - PubMed
    1. Yagi S, Muneta T, Sekiya I. Incidence and risk factors for medial tibial stress syndrome and tibial stress fracture in high school runners. Knee Surg Sports Traumatol Arthrosc. 2013;21: 556–563. 10.1007/s00167-012-2160-x - DOI - PubMed

Publication types