. 2019 Jan 17;15(1):e1007510.
doi: 10.1371/journal.ppat.1007510. eCollection 2019 Jan.

Fibrillar structures induced by a plant reovirus target mitochondria to activate typical apoptotic response and promote viral infection in insect vectors

Affiliations

Fibrillar structures induced by a plant reovirus target mitochondria to activate typical apoptotic response and promote viral infection in insect vectors

Qian Chen et al. PLoS Pathog. .

Abstract

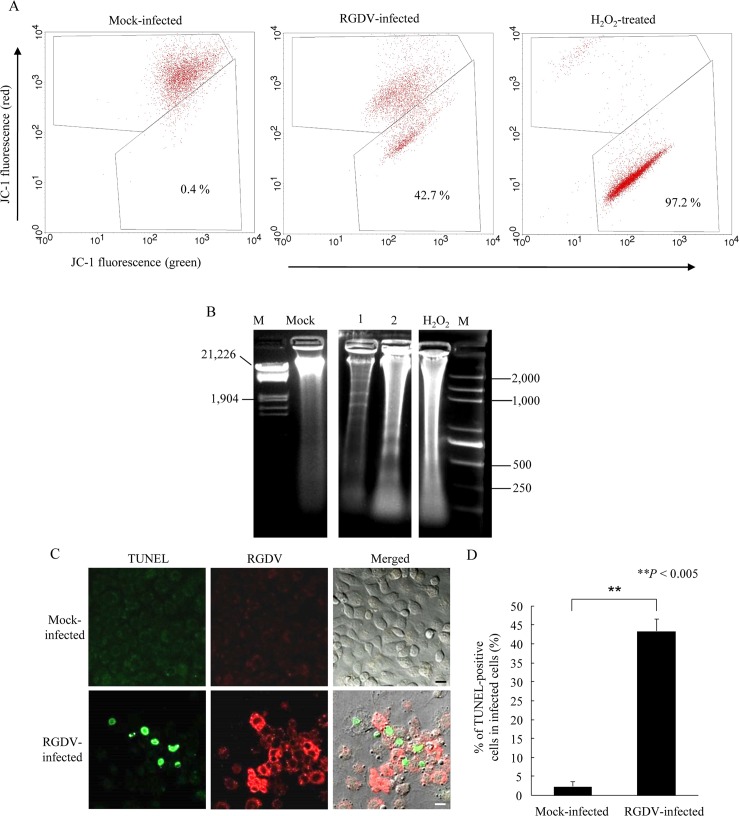
Numerous plant viruses that cause significant agricultural problems are persistently transmitted by insect vectors. We wanted to see if apoptosis was involved in viral infection process in the vector. We found that a plant reovirus (rice gall dwarf virus, RGDV) induced typical apoptotic response during viral replication in the leafhopper vector and cultured vector cells, as demonstrated by mitochondrial degeneration and membrane potential decrease. Fibrillar structures formed by nonstructural protein Pns11 of RGDV targeted the outer membrane of mitochondria, likely by interaction with an apoptosis-related mitochondrial protein in virus-infected leafhopper cells or nonvector insect cells. Such association of virus-induced fibrillar structures with mitochondria clearly led to mitochondrial degeneration and membrane potential decrease, suggesting that RGDV Pns11 was the inducer of apoptotic response in insect vectors. A caspase inhibitor treatment and knockdown of caspase gene expression using RNA interference each reduced apoptosis and viral accumulation, while the knockdown of gene expression for the inhibitor of apoptosis protein improved apoptosis and viral accumulation. Thus, RGDV exploited caspase-dependent apoptotic response to promote viral infection in insect vectors. For the first time, we directly confirmed that a nonstructural protein encoded by a persistent plant virus can induce the typical apoptotic response to benefit viral transmission by insect vectors.


Conflict of interest statement

The authors have declared that no competing interests exist.

Figures

Fig 1
Fig 1. RGDV infection induced morphological hallmarks of apoptosis in continuous cultured cells of R. dorsalis.
Cell cultures derived from R. dorsalis were originally established from the embryonic fragments dissected from eggs and subcultured for more than 100 generations. Cultured cells were inoculated with purified RGDV (MOI of 1) and processed at 48 hpi for TEM. The infection rate at this time was approximately 70%. (A) Mock-infected cultured cells of R. dorsalis with normal cellular morphology. (B) Condensed chromatin in cells infected by RGDV particles (red arrows) was marginalized along the nuclear inner envelope and appeared as cup-shaped masses (yellow arrow). (C) The nucleus (green dotted line) in cells infected by RGDV particles (red arrows) was crescent-shaped. (D) Large cell engulfing an apoptotic body containing RGDV particles (red arrows). (E) Intact mitochondria with distinct, tightly involute cristae in mock-infected cells. (F) Degenerated mitochondria with indistinct, diffuse cristae surrounded by fibrillar structures (red arrows) in virus-infected cultured cells of R. dorsalis. Yellow arrows indicate RGDV particles along the edges of fibrillar structures. Inserts in panels B, C and D-I are enlargements of the respective boxed areas. Panel D-I is an enlargement of the boxed area in panel D. Nu, nucleus; Mit, mitochondria. Bars, 2 μm (A-C), 500 nm (D, E), 100 nm (F). (G) Number of apoptotic cells in RGDV-infected cells (RGDV) was significantly higher than in mock-infected cells. His-Mg buffer-treated cells served as mock controls. Mean (±standard deviation [SD]) from three biological replicates are shown. *P < 0.05. Data were analyzed with a two-tailed t-test in GraphPad Prism 7.
Fig 2
Fig 2. RGDV infection triggered the apoptotic response in continuous cultured cells of R. dorsalis.
(A) Mitochondrial membrane potential decreased in RGDV-infected cells at 48 hpi as determined by flow cytometric analysis. Loss of mitochondrial membrane potential is displayed as the change in JC-1 fluorescence from red (JC-1 aggregates) to green (JC-1 monomers). Mock-infected, RGDV-infected and H2O2-treated cells were loaded with JC-1. Each panel and blot are representative of three separate experiments. (B) Chromosomal DNA of cultured cells was fragmented into nucleosomal oligomers as shown by gel electrophoresis. Lane M, DNA marker; lanes 1 and 2, DNA extracts from virus-infected cultured cells at 72 hpi. (C) Chromosomal fragmentation in RGDV-infected cells was TUNEL-positive. At 72 hpi, R. dorsalis cells growing in a monolayer were in situ labeled with TUNEL (green) and immunolabeled with virus-rhodamine (red), then examined by confocal microscopy. Mock-infected cells served as a control. Bars, 10 μm. (D) Percentage of TUNEL-positive cells in RGDV- or mock-infected cells at 72 hpi. His-Mg buffer-treated cells served as the mock controls. Means (±SD) from three biological replicates are shown. **P < 0.005. Data were analyzed with a two-tailed t-test in GraphPad Prism 7.
Fig 3
Fig 3. Fibrillar structures composed of RGDV Pns11 were associated with mitochondria by interacting with VDAC.
(A) Immunogold labeling of Pns11 on fibrillar structures (red arrows) at the periphery of degenerated mitochondria. Yellow arrows mark gold particles. Black arrows mark viral particles. Bar, 100 nm. (B) Immunofluorescence assay showing colocalization of Pns11-specific fibrillar structures with mitochondria (arrows) in virus-infected R. dorsalis cells at 48 hpi. Mock- or virus-infected cells were immunostained with Pns11-FITC (green) and MitoTracker (red). Panel Merged-II is an enlargement of boxed area in panel Merged-I. His-Mg buffer-treated cells served as mock controls. Bars, 10 μm. (C) Immunofluorescence assay showing colocalization of RGDV Pns11 with mitochondria (arrows) in Pns11-expressing Sf9 cells at 48 hpi. Mock or Pns11-expressing Sf9 cells were immunostained with Pns11-FITC (green) and MitoTracker (red). Bars, 10 μm. (D) Immunogold labeling of Pns11 in fibrillar structures (red arrows) surrounding mitochondria with diffuse cristae in Sf9 cells at 48 hpi. Yellow arrows mark gold particles. Bars, 100 nm. (E) Mitochondrial membrane potential was reduced in Pns11-expressing Sf9 cells at 72 hpi as determined by flow cytometric analysis. Mock or Pns11-expressing Sf9 cells were stained with rhodamine 123. Sf9 cells inoculated with empty baculovirus vector served as a negative control. Mit, mitochondria. Each panel is representative of three independent biological experiments.
Fig 4
Fig 4. Pns11 of RGDV specifically interacted with VDAC on the outer membrane of mitochondria.
(A) RGDV Pns11 specifically interacted with VDAC in Y2H assays. For the Gal-4 based Y2H assay, transformants on plate of SD/Trp-Leu-His-Ade medium are labeled as follows: +, Positive control, i.e., pGBKT7-53/ pGADT7-T;–, negative control, i.e., pGBKT7-Lam/pGADT7-T; Pns11+VDAC, pGBKT7-Pns11/pGADT7-VDAC. Serially diluted yeast cultures appeared blue in the β-galactosidase assay. For the DUALmembrane Y2H assay, transformants on plate of SD/Trp-Leu-His-Ade medium are labeled as follows: +, positive control (pTSU2-APP/pNubG-Fe65);–, negative control (pTSU2-APP/pPR3-N); Pns11+VDAC, pBT-STE-Pns11/ pBT3-N-VDAC. Serially diluted yeast cultures appeared blue in the β-galactosidase assay. (B) GST pull-down assay demonstrated the interaction of Pns11 with VDAC. Protein GST and recombinant protein GST-Pns11 were respectively incubated with cell lysate expressing protein His-VDAC. Pull-down products were detected using Western blotting. An antibody against GST was used to detect GST and GST-Pns11; an antibody against His was used to detect bound proteins. (C) RT-qPCR assay of relative expression of VDAC and RGDV Pns11 genes in R. dorsalis cells after dsRNA treatment. The dsRNA-treated cells were inoculated with purified RGDV (MOI of 0.1), then harvested at 48 hpi. Means (±SD) from three biological replicates are shown. *P < 0.05, **P < 0.005. Data were analyzed with a two-tailed t-test in GraphPad Prism 7. (D) Immunofluorescence assay showing that knockdown of VDAC expression decreased the number of Pns11 fibrillar structures at 48 hpi. Mock- or RGDV-infected cells after treatment with dsGFP or dsVDAC were immunostained with Pns11-FITC (green) and MitoTracker (red). His-Mg buffer-treated cells served as mock controls. Bars, 10 μm. (E) Immunogold labeling of Pns11 on fibrillar structures (red arrows) in dsGFP- or dsVDAC-treated infected cultured cells of R. dorsalis at 48 hpi. Yellow arrows mark gold particles. Mit, mitochondria. Bar, 200 nm.
Fig 5
Fig 5. The apoptotic response induced by RGDV infection occurred via a caspase-dependent pathway in continuous cultured cells of R. dorsalis.
(A) RT-qPCR assay showing the relative gene expression for CASP2L, CASP8L or IAP was up-regulated by RGDV infection. Cultured cells were inoculated with purified RGDV (MOI of 1), then harvested at 48 hpi. Relative gene expression of CASP2L, CASP8L or IAP at 48 hpi was normalized to the mock-infected cells. His-Mg buffer-treated cells served as mock controls. (B) RT-qPCR assay showing the relative gene expression for RGDV P8 after treatment with the pancaspase inhibitor Z-VAD-FMK. Cultured cells were incubated for 4 h with 25 μM pancaspase inhibitor Z-VAD-FMK dissolved in DMSO. DMSO treatment served as the control. Cells were inoculated with purified virus (MOI of 0.1), achieving an early infection rate of about 20–30%, then assayed by RT-qPCR assay at 48 hpi. (C) The apoptotic response induced by RGDV infection facilitated viral accumulation in insect vector cells. Cultured cells in a monolayer were treated with dsCASP2L, dsCASP8L, dsIAP or dsGFP, then inoculated with RGDV (MOI of 0.1). At 72 hpi, cells were in situ labeled with TUNEL (green) and immunolabeled with virus-rhodamine (red), then examined by confocal microscopy. The TUNEL assay for dsRNAs-treated and His-Mg buffer-treated cells served as mock controls. Images are representative of three independent experiments. Bars, 40 μm. (D, E) The percentage of viral infection (D) or TUNEL-positive cells (E) in RGDV- or mock-infected cells treated with dsRNAs at 72 hpi. His-Mg buffer-treated cells served as mock controls. (F) RT-qPCR assay showing the relative gene expression for RGDV P8, CASP2L, CASP8L, and IAP after respective dsRNA treatment. The dsRNA-treated cells were inoculated with purified RGDV (MOI of 0.1), then assayed or harvested at 48 hpi. Means (±SD) from three independent biological replicates are shown. *P < 0.05, **P < 0.005. Data were analyzed with a two-tailed t-test in GraphPad Prism 7.
Fig 6
Fig 6. The apoptotic response induced by RGDV infection facilitated viral infection in continuous cultured cells of R. dorsalis.
Effects of synthesized dsRNAs on the synthesis of viral mRNAs (A), the synthesis of viral genome dsRNAs (B), and the accumulation of viral proteins (C) in virus-infected cells. The dsRNA-treated cells were inoculated with purified RGDV (MOI of 0.1), then harvested at 72 hpi for northern blots, dsRNA isolation or western blots. (A) Approximately 5 μg of total RNAs extracted from cultured cells at 72 hpi were detected with DIG-labeled probes for viral genes of major outer capsid protein P8 or viral replication protein Pns12. Lower panel: methylene blue detection of 5.8S rRNA as a control to confirm loading of equal amounts of RNA in each lane. Image is representative of multiple experiments with multiple preparations. (B) Viral genome dsRNAs from infected cultured cells was analyzed in 1.0% agarose gel electrophoresis and ethidium bromide staining. The size classes of viral dsRNA segments are indicated. (C) Viral proteins prepared from cells lysates were analyzed at 72 hpi using polyclonal antibodies against P8 or Pns12. An actin-specific antibody was used for the control.
Fig 7
Fig 7. RGDV infection triggered the apoptotic response in R. dorsalis.
(A) RGDV infection induced the apoptotic response in the intestines of viruliferous leafhoppers. Leafhopper intestines at 6 days padp were stained with TUNEL (green), virus-rhodamine (red) and actin dye phalloidin-Alexa Fluor 647 carboxylic acid (blue), and then examined by confocal microscopy. Panel A-I is an enlargement of the boxed area in panel A. Bright field images of the intestines are shown below the fluorescent ones. Images are representative of three independent experiments with a total 30 leafhoppers analyzed. (B) Percentage of TUNEL-positive intestines from viruliferous or nonviruliferous insects at 10 days padp. Means (±SD) from three independent biological replicates are shown. **P < 0.005. Data were analyzed with a two-tailed t-test in GraphPad Prism 7. (C) Intestinal epithelium in nonviruliferous leafhoppers showing normal nucleus, intact mitochondria and orderly microvilli. (D) RGDV-infected intestinal epithelium with cytopathological morphology, including nucleus shrinkage (brown dotted line), cytoplasmic vacuolation (blue arrows), and microvilli loss (red dotted line). (E) Nucleus of virus-infected cells was crescent-shaped. (F) Intact mitochondria with tightly involute cristae in nonviruliferous intestinal epithelium. (G) Degenerated mitochondria with diffuse, indistinct cristae were surrounded by bundles of fibrillar structures (red arrows) in viruliferous midgut epithelium. Yellow arrows indicate vial particles. Panels I, II and III in C and D are enlarged images of the boxed areas in respective panels. Insert VI in panel E is enlargement of the boxed area VI. FC, filter chamber; Amg, anterior midgut; Mmg, middle midgut; Pmg, posterior midgut; Nu, nucleus; Mit, mitochondrion; V, vacuolation; Mv, microvilli; Vi, virions. Bars, 100 μm (A), 2 μm (C, E), 5 μm (D), 500 nm (C-I, D-II) and 200 nm (F, G).
Fig 8
Fig 8. The apoptotic response regulated the persistent RGDV infection of R. dorsalis.
(A) Mean number copies for RGDV P8, CASP2L or IAP genes in viruliferous leafhoppers from 6 to 14 days padp as determined by RT-qPCR assay. Means (±SD) from three independent biological replicates are shown. (B) Mean number of viral genome copies in dsCASP2L-treated, dsIAP-treated or dsGFP-treated viruliferous leafhopper from 6 to 14 days padp. Means (±SD) from three independent biological replicates are shown. Statistical significance is related to the dsGFP control. *P < 0.05.

Similar articles

Cited by

References

    1. Yan N, Shi Y. Mechanisms of apoptosis through structural biology. Annu Rev Cell Dev Biol. 2005;21: 35–56. 10.1146/annurev.cellbio.21.012704.131040 - DOI - PubMed
    1. Elmore S. Apoptosis: a review of programmed cell death. Toxicol Pathol. 2007;35(4): 495–516. 10.1080/01926230701320337 - DOI - PMC - PubMed
    1. Denton D, Kumar S. Studying apoptosis in Drosophila. Cold Spring Harb Protoc. 2015;(7): 609–13. 10.1101/pdb.top070433 - DOI - PubMed
    1. Beug ST, Beauregard CE, Healy C, Sanda T, St-Jean M, Chabot J, et al. Smac mimetics synergize with immune checkpoint inhibitors to promote tumour immunity against glioblastoma. Nat Commun. 2017;8 10.1038/ncomms14278 - DOI - PMC - PubMed
    1. Barber GN. Host defense, viruses and apoptosis. Cell Death Differ. 2001;8(2): 113–26. 10.1038/sj.cdd.4400823 - DOI - PubMed

Publication types

MeSH terms

Substances

Supplementary concepts