. 2019 May;28(9):2290-2304.
doi: 10.1111/mec.15021. Epub 2019 May 29.

Footprints of adaptive evolution revealed by whole Z chromosomes haplotypes in flycatchers

Affiliations

Footprints of adaptive evolution revealed by whole Z chromosomes haplotypes in flycatchers

Krystyna Nadachowska-Brzyska et al. Mol Ecol. 2019 May.

Abstract

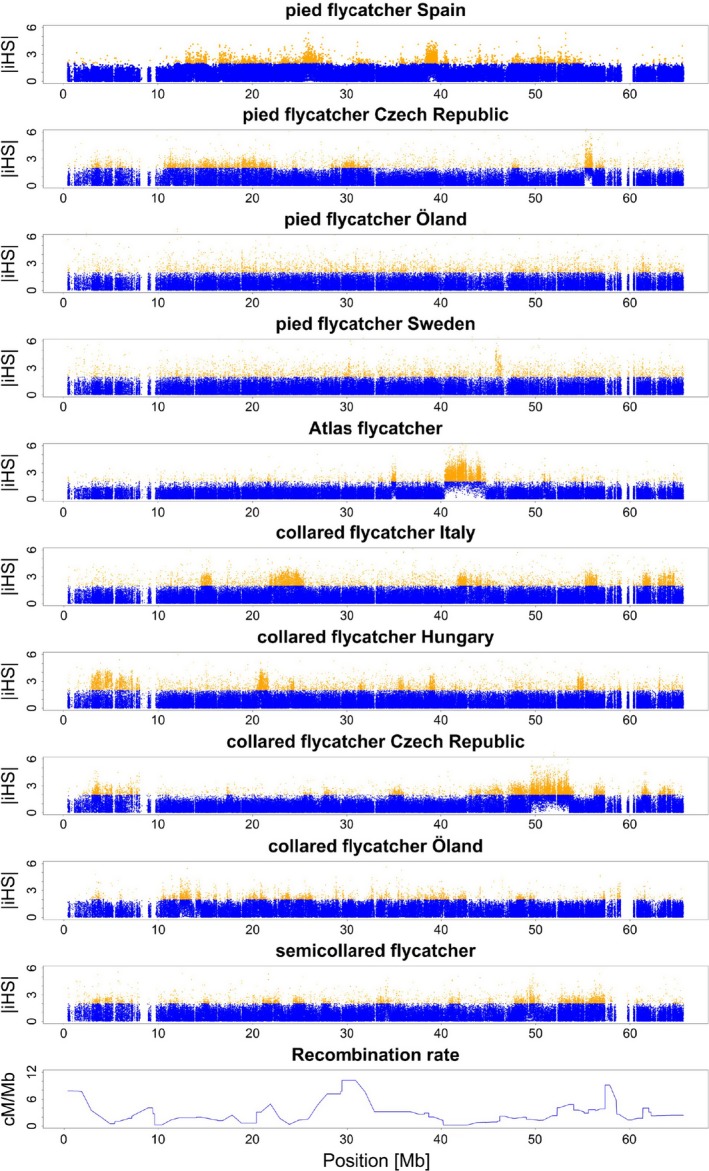
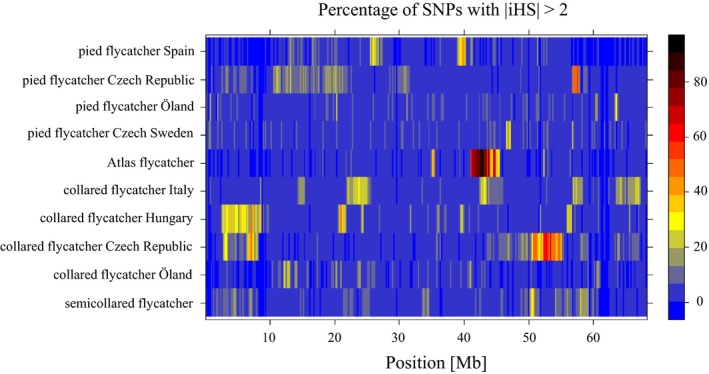
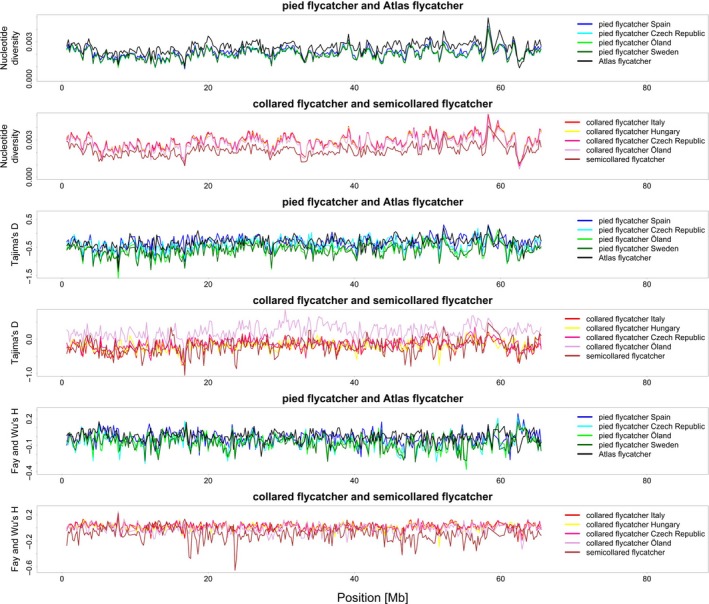
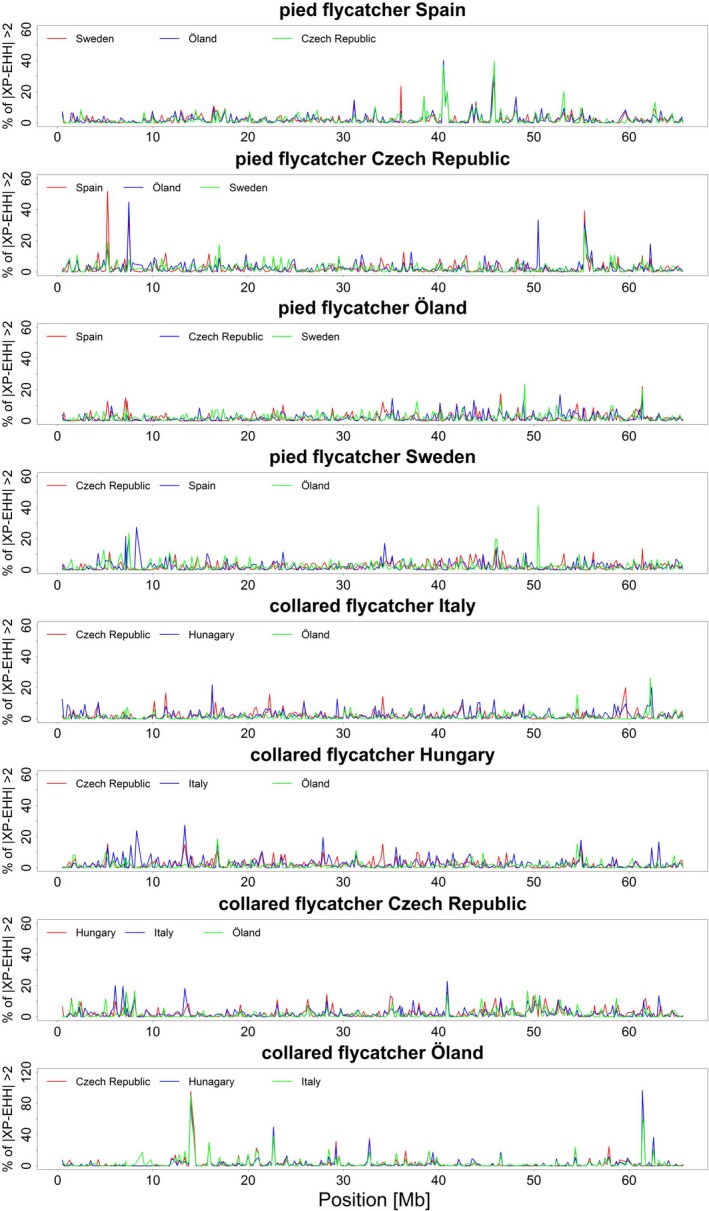
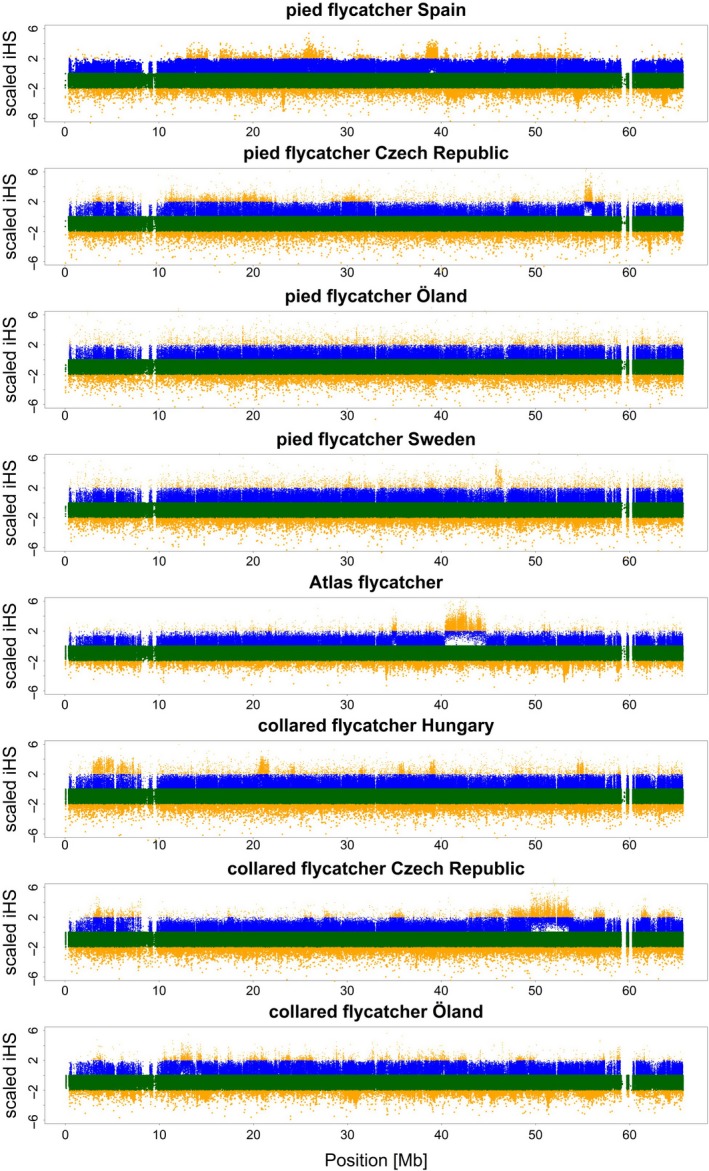
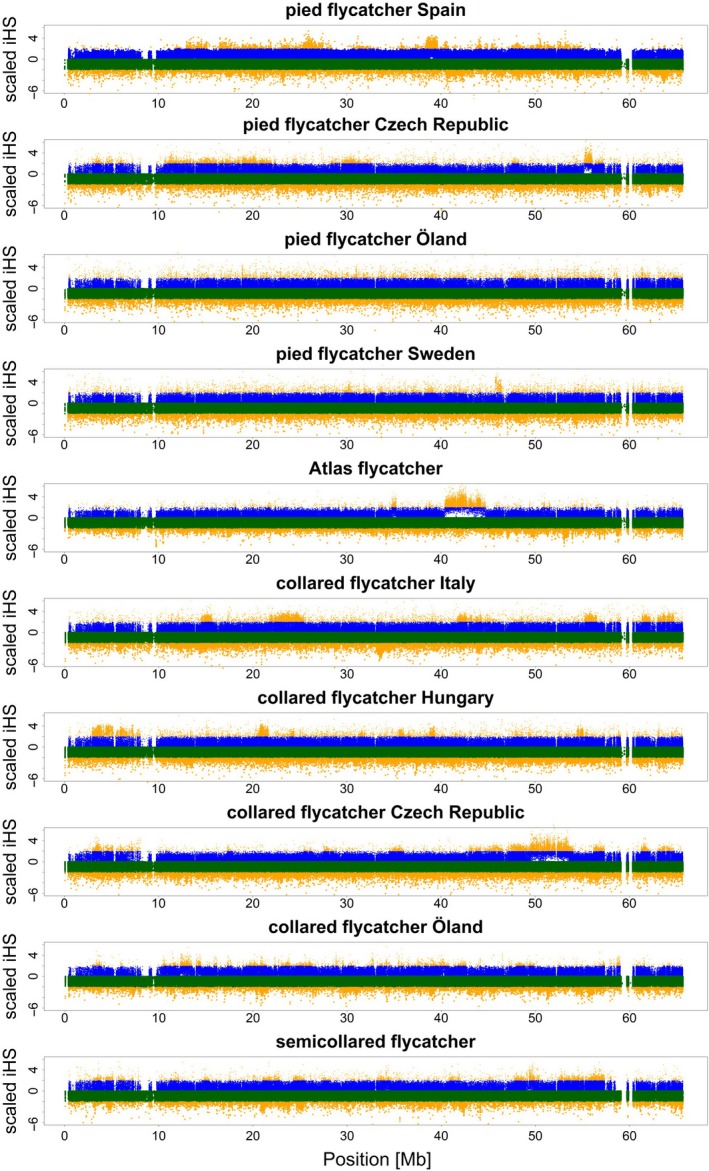
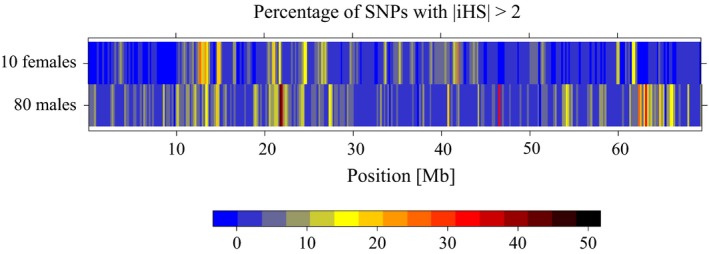
Detecting positive selection using genomic data is critical to understanding the role of adaptive evolution. Of particular interest in this context is sex chromosomes since they are thought to play a special role in local adaptation and speciation. We sought to circumvent the challenges associated with statistical phasing when using haplotype-based statistics in sweep scans by benefitting from that whole chromosome haplotypes of the sex chromosomes can be obtained by resequencing of individuals of the hemizygous sex. We analyzed whole Z chromosome haplotypes from 100 females from several populations of four black and white flycatcher species (in birds, females are ZW and males ZZ). Based on integrated haplotype score (iHS) and number of segregating sites by length (nSL) statistics, we found strong and frequent haplotype structure in several regions of the Z chromosome in each species. Most of these sweep signals were population-specific, with essentially no evidence for regions under selection shared among species. Some completed sweeps were revealed by the cross-population extended haplotype homozygosity (XP-EHH) statistic. Importantly, by using statistically phased Z chromosome data from resequencing of males, we failed to recover the signals of selection detected in analyses based on whole chromosome haplotypes from females; instead, what likely represent false signals of selection were frequently seen. This highlights the power issues in statistical phasing and cautions against conclusions from selection scans using such data. The detection of frequent selective sweeps on the avian Z chromosome supports a large role of sex chromosomes in adaptive evolution.

Keywords: Ficedula flycatchers; haplotype-based statistics; ongoing selection; sex chromosomes.


Figures

Figure 1
Figure 1
Absolute iHS values plotted along the Z chromosome for 10 flycatcher populations. Each dot corresponds to a single SNP. SNPs with |iHS| >2 are shown in yellow [Colour figure can be viewed at http://wileyonlinelibrary.com]
Figure 2
Figure 2
Heat map representing patterns of haplotype structure on Z chromosome among flycatcher populations. Windows are coloured according to the colour bar scale showing the percentage of SNPs with |iHS| >2 [Colour figure can be viewed at http://wileyonlinelibrary.com]
Figure 3
Figure 3
Nucleotide diversity, Tajima's D and Fay and Wu's H statistics plotted along Z chromosome for 10 flycatcher populations [Colour figure can be viewed at http://wileyonlinelibrary.com]
Figure 4
Figure 4
XP‐EHH scan results summarized as percentage of SNPs with |XP‐EHH| >2 in 200 kb windows. XP‐EHH statistic was calculated for each population in pairwise comparison to other conspecific populations. Different comparisons are presented with different colours. Note that the Y‐axis for the Öland population has a different scale [Colour figure can be viewed at http://wileyonlinelibrary.com]
Figure 5
Figure 5
Scaled iHS values plotted along the Z chromosome for females (upper part of each panel) and males (phased using 10 males; lower part of each panel) in 10 flycatcher populations. Each dot corresponds to a single SNP. SNPs with iHS >0 representing female‐based |iHS| and iHS <0 representing male‐based |iHS| x (−1). SNPs with |iHS| >2 are shown in yellow [Colour figure can be viewed at http://wileyonlinelibrary.com]
Figure 6
Figure 6
Scaled iHS values plotted along the Z chromosome for females and males (phased using 92 males). Each dot corresponds to a single SNP. SNPs with iHS > 0 representing female‐based |iHS| and iHS < 0 representing male‐based |iHS| x (−1). SNPs with |iHS| >2 are shown in yellow [Colour figure can be viewed at http://wileyonlinelibrary.com]
Figure 7
Figure 7
Heat map representing patterns of haplotype structure on Z chromosome in the Öland population of collared flycatchers using female and male data sets. Windows are coloured according to a colour bar scale showing the percentage of SNPs with |iHS| >2 [Colour figure can be viewed at http://wileyonlinelibrary.com]

Similar articles

Cited by

References

    1. Akagi, T. , Hanada, T. , Yaegaki, H. , Gradziel, T. M. , & Tao, R. (2016). Genome‐wide view of genetic diversity reveals paths of selection and cultivar differentiation in peach domestication. DNA Reserach, 23, 271–282. 10.1093/dnares/dsw014 - DOI - PMC - PubMed
    1. Amorim, C. , Nunes, K. , Meyer, D. , Comas, D. , Cátira, M. , Mauro, F. , & Hünemeier, T. (2017). Genetic signature of natural selection in first Americans. Proceedings of the National Academy of Sciences of the United States of America, 114, 2195–2199. 10.1073/pnas.1620541114 - DOI - PMC - PubMed
    1. Borge, T. , Lindroos, K. , Nádvorník, P. , Syvänen, A. , & Saetre, G. (2005). Amount of introgression in flycatcher hybrid zones reflects regional differences in pre and post‐zygotic barriers to gene exchange. Journal of Evolutionary Biology, 18, 1416–1424. 10.1111/j.1420-9101.2005.00964.x - DOI - PubMed
    1. Browning, S. R. , & Browning, B. L. (2011). Haplotype phasing: Existing methods and new developments. Nature Reviews Genetics, 12, 703–714. 10.1038/nrg3054 - DOI - PMC - PubMed
    1. Burri, R. , Nater, A. , Kawakami, T. , Mugal, C. F. , Olason, P. I. , Smeds, L. , … Ellegren, H. (2015). Linked selection and recombination rate variation drive the evolution of the genomic landscape of differentiation across the speciation continuum of Ficedula flycatchers. Genome Research, 25, 1656–1665. 10.1101/gr.196485.115 - DOI - PMC - PubMed

Publication types