. 2019 Jan 16;11(1):102.
doi: 10.3390/cancers11010102.

Inhibition of Pannexin 1 Reduces the Tumorigenic Properties of Human Melanoma Cells

Affiliations

Inhibition of Pannexin 1 Reduces the Tumorigenic Properties of Human Melanoma Cells

Taylor J Freeman et al. Cancers (Basel). .

Abstract

Pannexin 1 (PANX1) is a channel-forming glycoprotein expressed in many tissues including the skin. PANX1 channels allow the passage of ions and molecules up to 1 kDa, including ATP and other metabolites. In this study, we show that PANX1 is highly expressed in human melanoma tumors at all stages of disease progression, as well as in patient-derived cells and established melanoma cell lines. Reducing PANX1 protein levels using shRNA or inhibiting channel function with the channel blockers, carbenoxolone (CBX) and probenecid (PBN), significantly decreased cell growth and migration, and increased melanin production in A375-P and A375-MA2 cell lines. Further, treatment of A375-MA2 tumors in chicken embryo xenografts with CBX or PBN significantly reduced melanoma tumor weight and invasiveness. Blocking PANX1 channels with PBN reduced ATP release in A375-P cells, suggesting a potential role for PANX1 in purinergic signaling of melanoma cells. In addition, cell-surface biotinylation assays indicate that there is an intracellular pool of PANX1 in melanoma cells. PANX1 likely modulates signaling through the Wnt/β-catenin pathway, because β-catenin levels were significantly decreased upon PANX1 silencing. Collectively, our findings identify a role for PANX1 in controlling growth and tumorigenic properties of melanoma cells contributing to signaling pathways that modulate melanoma progression.

Keywords: ATP; Chick-CAM; PANX1; Wnt; carbenoxolone; melanoma; pannexin; patient-derived cells; probenecid; tumor growth; xenografts; β-catenin.


Conflict of interest statement

The authors declare no conflict of interest. The funders had no role in the design of the study; in the collection, analyses, or interpretation of data; in the writing of the manuscript, or in the decision to publish the results.

Figures
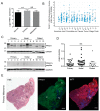
Figure 1
Figure 1
Pannexin 1 is expressed in patient-derived primary melanoma tumors, as well nodal and distant melanoma metastases. (A) Gene expression analyses from microarray study GSE15605 revealed significantly higher PANX1 expression in primary human melanoma tumors relative to normal skin biopsies. (B) Analysis of PANX1 mRNA expression in melanoma tumors of the Cancer Genome Atlas (TCGA) database revealed that PANX1 expression is not significantly different across melanoma stages (denoted according to the Cancer Tumor Stage Code). (C) Representative PANX1 protein levels in patient-derived melanoma tumors. Numbers represent different patient donors. A peptide pre-absorption assay confirms antibody specificity. Protein sizes in kDa. (D) Densitometry was used to quantify PANX1 levels (bands in bracket) in all primary, nodal and distant melanoma samples provided by the Ontario Institute for Cancer Research (OICR), normalized to GADPH (Sample 9 was degraded and not used for analysis). There is no significant difference in PANX1 levels among stages of melanoma progression. Primary tumors (N = 6 patients, n = 27 technical reps), Nodal mets (N = 7, n = 29), Distant mets (N = 3, n = 13); One-way ANOVA followed by Tukey’s post-hoc test was used to analyze data. line = mean; NS = not significant. (E) Patient-derived primary melanoma tumor labeled with PANX1 (green). Sequential sections of the tumor stained using H&E (provided by OICR) and a marker for a melanocytic-lineage, MITF (red). Melanoma core (C), Necrotic regions of the tumor (N), Stromal area of the tumor (S). Bar: 1000 μm.
Figure 2
Figure 2
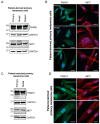
PANX1 is highly expressed in patient-derived primary melanoma cells. (A) Representative PANX1 levels in primary cells derived from melanoma biopsies of patient tumors with primary (N = 5), nodal (N = 4) and distant (N = 4) metastases. Cultures of primary melanoma cells were distinguished through MITF expression. (B) Patient-derived primary melanoma cells extracted from three stages of melanoma progression express PANX1 intracellularly and at the cell membrane. MITF is a transcription factor involved in melanocytic lineages and is found in the nucleus and in the cytoplasm of the cell. (C) Patient-matched primary cells were extracted from a primary tumor and a nodal metastasis within a single patient and show high PANX1 levels. Melanoma identity was confirmed with MITF expression. (D) Patient-matched primary cells immunolabeled for PANX1 show intracellular and cell membrane localization. PANX1: green, MITF: red, Hoechst: blue; Bar: 20 μm.
Figure 3
Figure 3
Pannexin 1 is expressed in established human melanoma cell lines. (A) A375-P and A375-MA2 human melanoma cells were fixed and stained with anti-PANX1 polyclonal antibodies (green). DNA was stained with Hoechst (blue). Bar: 20 μm. Representative fields are shown from three separate experiments. (B) A375-P, A375-MA2, Normal Rat Kidney cells (NRK), and NRK overexpressing PANX1 (NRK-PANX1) cells were lysed and equal amounts of protein were resolved by SDS-PAGE. The blots were probed with the anti-PANX1 antibodies. Black line denotes that both images are from the same blot but scanned with different intensity. Right panel shows the quantification of PANX1 bands in A375-P and A375-MA2 samples using ImageStudio 3.0. The data are expressed as means ±SEM (N = 4) Statistical analyses using student’s t-tests; * p < 0.05. (C) A375-P and A375-MA2 melanoma cells were cultured at 20,000 cells per well in medium containing 10% FBS. Cells were counted daily up to 4 days after initial seeding of the cells onto the 24-well culture dish. The data are expressed as mean ± SEM (N = 5, n = 25). Two-way ANOVA was used to statistically analyze data. * p < 0.05, ** p < 0.01. (D) Scratch assays were performed on a confluent monolayer of A375-P and A375-MA2 cells to assess migration. Quantifications represents cell migration three days following the initial scratch and treatment application. Statistical analysis was performed using student’s t-tests; *** p < 0.001. (E) Melanin was extracted from one million A375-P and A375-MA2 cells. There was significantly decreased melanin content detected in A375-MA2 compared to A375-P cells at the same passage number. Statistical analyses for melanin extraction data includes student’s t-tests; * p < 0.05.
Figure 4
Figure 4
Knocking down PANX1 reduces growth and migration in human melanoma cells. (A) A375-P and A375-MA2 cells were transfected with either scrambled shRNA (SCRsh) as a control or shRNA constructs against PANX1 (PANX1sh). Western blot analysis confirmed PANX1 knockdown in both cell lines. GAPDH was used as loading control. Dotted line indicates extra lanes removed from the same blot scanned at the same intensity. Graphs depict the quantification of Western blots from three separate experiments conducted on different cell lysates, N = 3, student’s t-tests; **** p < 0.0001, ** p < 0.001 (B) PANX1 mRNA levels were measured by qPCR in control and PANX1 knockdown A375-P cells. Values in control samples were set to 1. Data are expressed as mean ± SEM, (N = 3, n = 9). Student’s t-test was used to analyse data; **** p < 0.0001. (C) A375-P cells transfected with scrambled shRNA (SCRshRNA, depicting PANX1 at the cell surface) or shRNA against PANX1 (PANX1shRNA, significantly reduced PANX1 signal) were fixed and stained with anti-PANX1 polyclonal antibodies (green). DNA was stained with Hoescht (blue). Staining with secondary antibody alone (2° only) was used as a control. Bar: 20 μm. (D) A375-P cells transfected with either scrambled shRNA (SCR shRNA) or shRNA against PANX1 (PANX1shRNA) were cultured at 20,000 cells per well in medium containing 10% FBS. Cells were counted daily up to 4 days after initial seeding of the cells onto the culture. There was a significant reduction in cell growth after three days in cells with reduced levels of PANX1. The data are expressed as mean ± SEM from four separate experiments conducted with three technical replicates. (N = 4, n = 12). Two-way ANOVA was used to statistically analyze the data. ** p < 0.01, **** p < 0.0001. E. Scratch assays were performed on a confluent monolayer of Scrambled (SCRshRNA) and PANX1 knockdown (PANX1shRNA) A375-P and A375-MA2 cells to assess migration in growth media with chFBS. The distance travelled by the cells represents cell migration three days following the initial scratch and treatment application. Data are expressed as mean ± SEM (N = 3, n = 9).
Figure 5
Figure 5
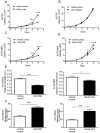
PANX1 blockers reduce the tumorigenic properties of human melanoma cells in vitro. A375-P melanoma cells were cultured at 20,000 cells per well in medium containing 10% FBS in the presence of PBN (1 mM) in (A) and CBX (100 µM) in (B). Similarly, A375-MA2 melanoma cells were cultured in the presence of PBN (C) or CBX (D) added to the culture medium. Cells were counted daily up to 4 days after initial seeding of the cells onto the culture. The data are expressed as mean ± SEM from three separate experiments conducted with three technical replicates. (N = 3, n = 9). (E) Scratch assays were performed on a confluent monolayer of A375-MA2 cells in the presence of PBN (1 mM, N = 3, n = 22) or CBX (100 µM, N = 3, n = 20) to assess migration. Data are expressed as mean ± SEM. Vehicle treated cells were used as control in the experiment. A significant decrease in A375-MA2 cell migration was noted in the presence of PBN and CBX. (F) Significantly more melanin was extracted from A375-MA2 cells treated with either 100 μM CBX (N = 3, n = 15) or 1 mM PBN (N = 3, n = 13) compared to vehicle controls. Statistical analyses for growth curves were performed using a two-way ANOVA followed by a Sidak test. Statistical analyses for migration assays and melanin extraction data includes student’s t-tests; * p < 0.05, *** p < 0.001, **** p < 0.0001; Bars indicate SEM.
Figure 6
Figure 6
PANX1 blockers significantly reduced A375-MA2 melanoma tumor weight and invasion in chicken embryo xenografts. (A) One million A375-MA2 human melanoma cells were incubated with a DiO’lipophilic cell tracer, combined with Matrigel (1:1) and seeded onto the chorioallantoic membrane (CAM) of a ten-day-old chick embryo ex vivo. A375-MA2 tumors treated for one week with 100 μM CBX (N = 16) or 1 mM PBN (N = 11). (B) Tumors treated with CBX or PBN weighed significantly less than tumors treated with the vehicle control (N = 15). Statistical analyses were performed using one-way ANOVA followed by a Tukey’s post-hoc test. Lines represent the mean, ** p < 0.01. (C) A375-MA2 melanoma tumors were extracted from the CAM on day 18 of the experiment, sectioned and stained using H&E to analyze tumor structure. Tumors treated with the vehicle control (N = 4) showed an undefined border between the tumor and the CAM, possibly due to A375-MA2 cell invasion into the CAM. In contrast, tumors treated daily with 100 μM CBX (N = 4) were more easily removed from the CAM and displayed a defined tumor edge. Arrows indicate the edge of the tumors. To quantify CAM integrity, H&E images were converted to binary and inverted. A standard frame area was used in each image to measure the mean grey intensity in pixels as a measure of the area of intact CAM-tumor interface. The area of the intact tumor border was significantly increased in A375-MA2 tumors treated daily with 100 μM CBX for one week compared to those treated with the vehicle control (N = 4, n = 12). Scale bar: 50 μm and is the same for all images in (C). Bars indicate mean ± SEM. ** p < 0.01.
Figure 7
Figure 7
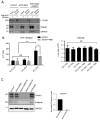
Inhibition of PANX1 alters the signaling profile of melanoma cells. (A) Protein lysates from A375-P, A375-MA2 cells with endogenous expression of PANX1 as well as A375-MA2 cells overexpressing PANX1 were used for cell-surface biotinylation assays. Negative controls were prepared in parallel in absence of biotin labeling reagent. Western blotting for L1-CAM and GAPDH were used as positive control of cell surface protein and control for non-specific biotinylation of intracellular/cytoplasmic proteins, respectively. Only a fraction of PANX1 is localized to the cell surface of cells examined in this experiment. (B) A375-P cells were washed in PBS and incubated with appropriate isotonic solution for 5 min (100% PBS (control), 70% PBS or 30% PBS) in the presence of 1 mM PBN. There was a significant decrease in ATP released into the culture medium in the presence of 1 mM PBN. Plotted values are means ±S.D. * p < 0.05, *** p < 0.0005 as determined by a two-way ANOVA with a Tukey’s multiple comparisons test. Viable cells were counted after each treatment and plotted in the right panel. There was no significant difference in the number of live cells in each treatment condition. (C) A375-P cells were transfected with either scrambled shRNA (SCRshRNA) as a control or two different shRNA construct against PANX1 (PANX1shRNA -B and -D). Cells were lysed, and equal amounts of protein were resolved by 12% SDS-PAGE. Western blot analysis using polyclonal antibodies confirmed PANX1 knockdown. GAPDH was used as loading control. There was a significant reduction in the abundance of β-catenin in PANX1 knockdown cells. Cell lysates of non-transfected A375-P and A375-MA2 cells were used as additional controls in the experiments. Graph depicts the quantification of western blots from three separate experiments, N = 3, student’s t-tests; *** p < 0.0001.

Similar articles

Cited by

References

    1. Panchin Y., Kelmanson I., Matz M., Lukyanov K., Usman N., Lukyanov S. A ubiquitous family of putative gap junction molecules. Curr. Biol. 2000;10:R473–R474. doi: 10.1016/S0960-9822(00)00576-5. - DOI - PubMed
    1. Boassa D., Ambrosi C., Qiu F., Dahl G., Gaietta G., Sosinsky G. Pannexin1 channels contain a glycosylation site that targets the hexamer to the plasma membrane. J. Biol. Chem. 2007;282:31733–31743. doi: 10.1074/jbc.M702422200. - DOI - PubMed
    1. Penuela S., Bhalla R., Gong X.Q., Cowan K.N., Celetti S.J., Cowan B.J., Bai D., Shao Q., Laird D.W. Pannexin 1 and pannexin 3 are glycoproteins that exhibit many distinct characteristics from the connexin family of gap junction proteins. J. Cell Sci. 2007;120:3772–3783. doi: 10.1242/jcs.009514. - DOI - PubMed
    1. Bao L., Locovei S., Dahl G. Pannexin membrane channels are mechanosensitive conduits for ATP. FEBS Lett. 2004;572:65–68. doi: 10.1016/j.febslet.2004.07.009. - DOI - PubMed
    1. Bruzzone R., Hormuzdi S.G., Barbe M.T., Herb A., Monyer H. Pannexins, a family of gap junction proteins expressed in brain. Proc. Natil. Acad. Sci. USA. 2003;100:13644–13649. doi: 10.1073/pnas.2233464100. - DOI - PMC - PubMed

LinkOut - more resources