. 2019 Jun;15(6):1082-1099.
doi: 10.1080/15548627.2019.1569933. Epub 2019 Jan 29.

VCP maintains lysosomal homeostasis and TFEB activity in differentiated skeletal muscle

Affiliations

VCP maintains lysosomal homeostasis and TFEB activity in differentiated skeletal muscle

Khalid Arhzaouy et al. Autophagy. 2019 Jun.

Abstract

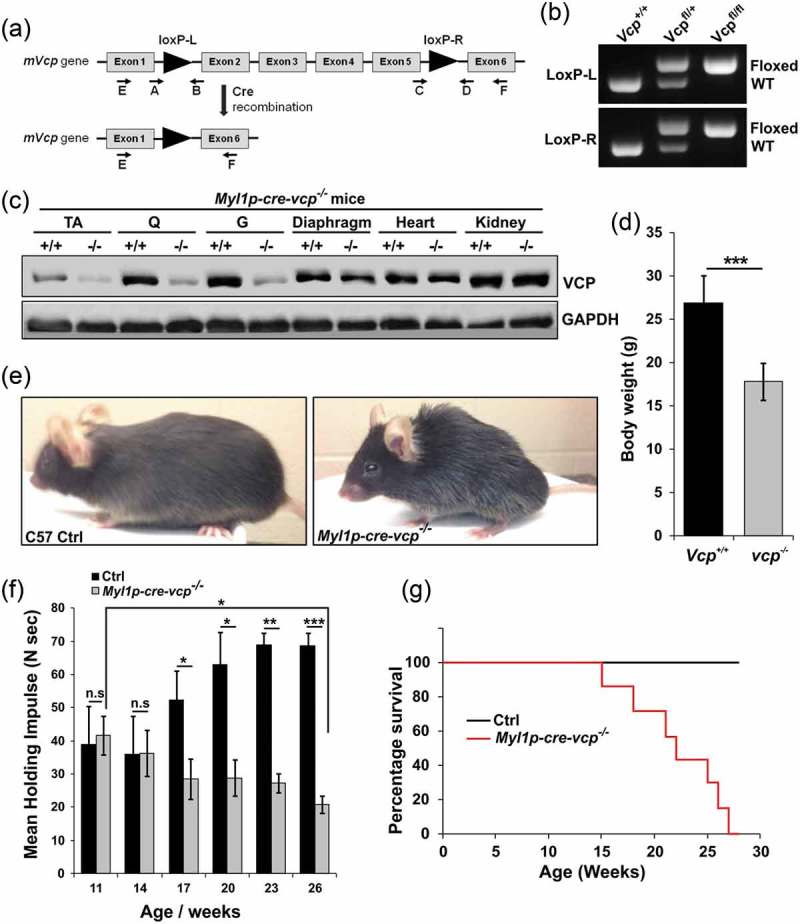
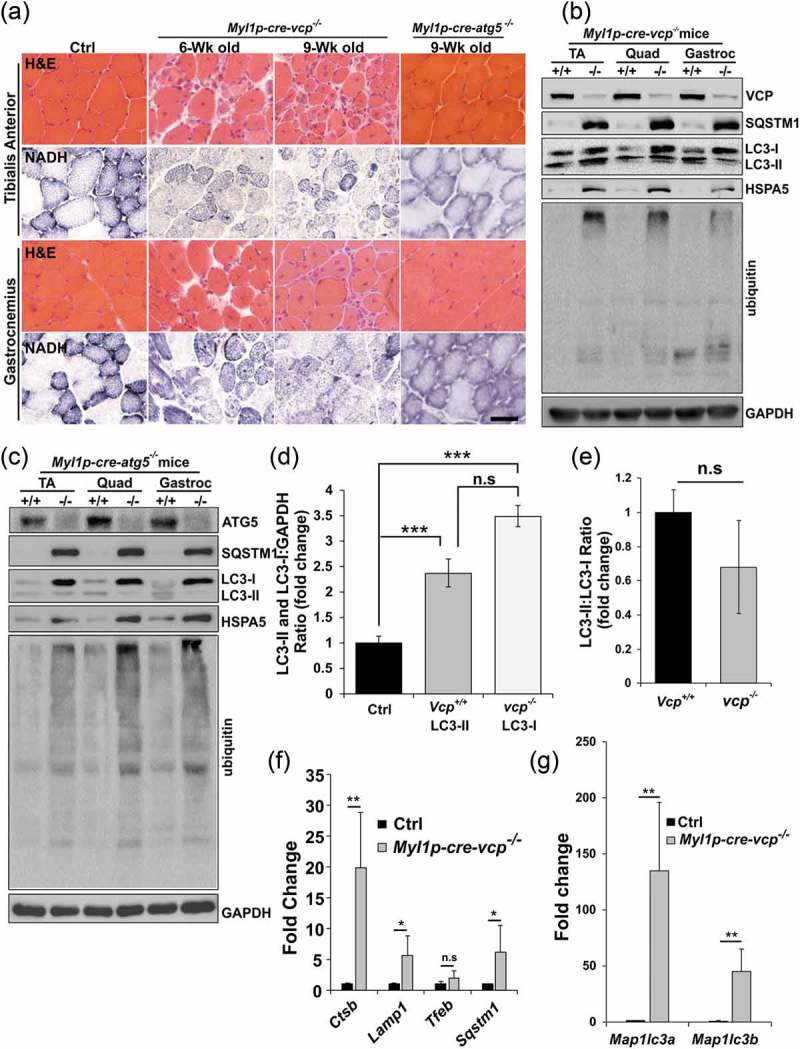
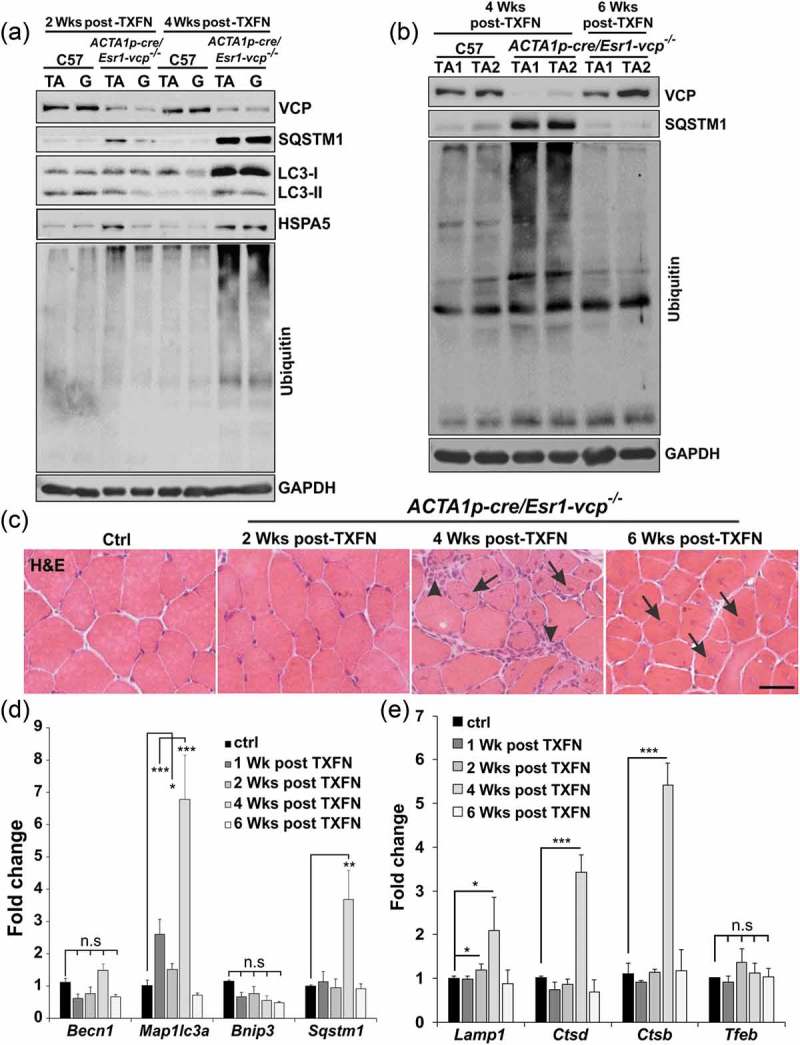
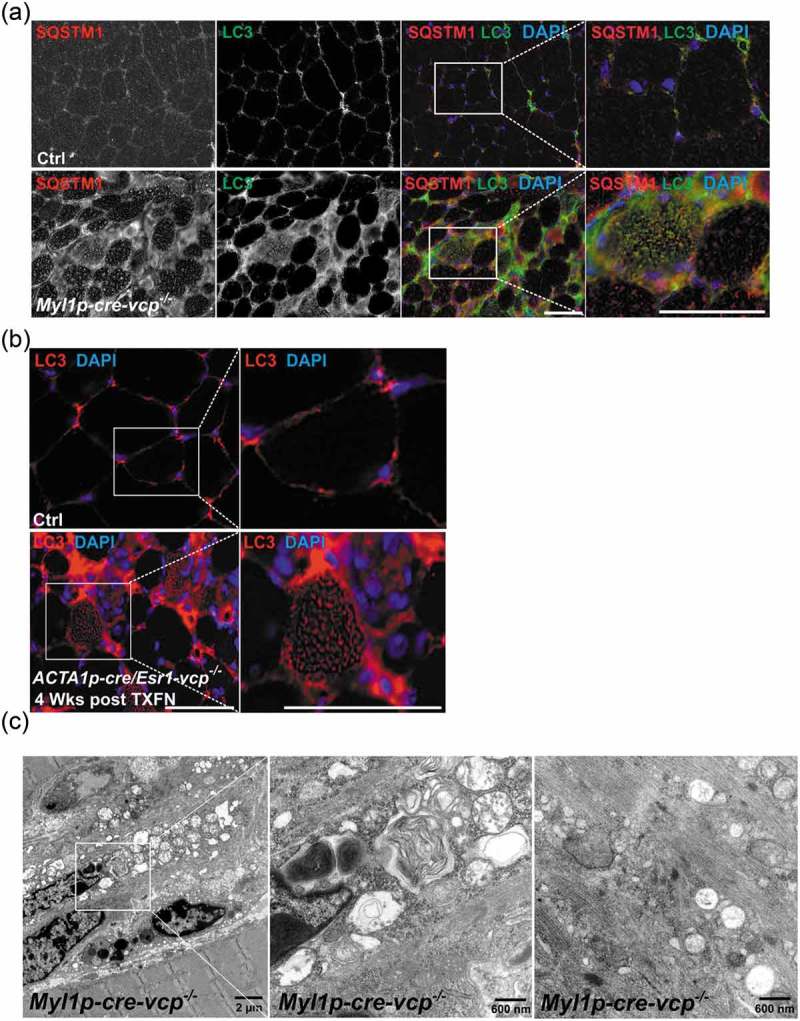
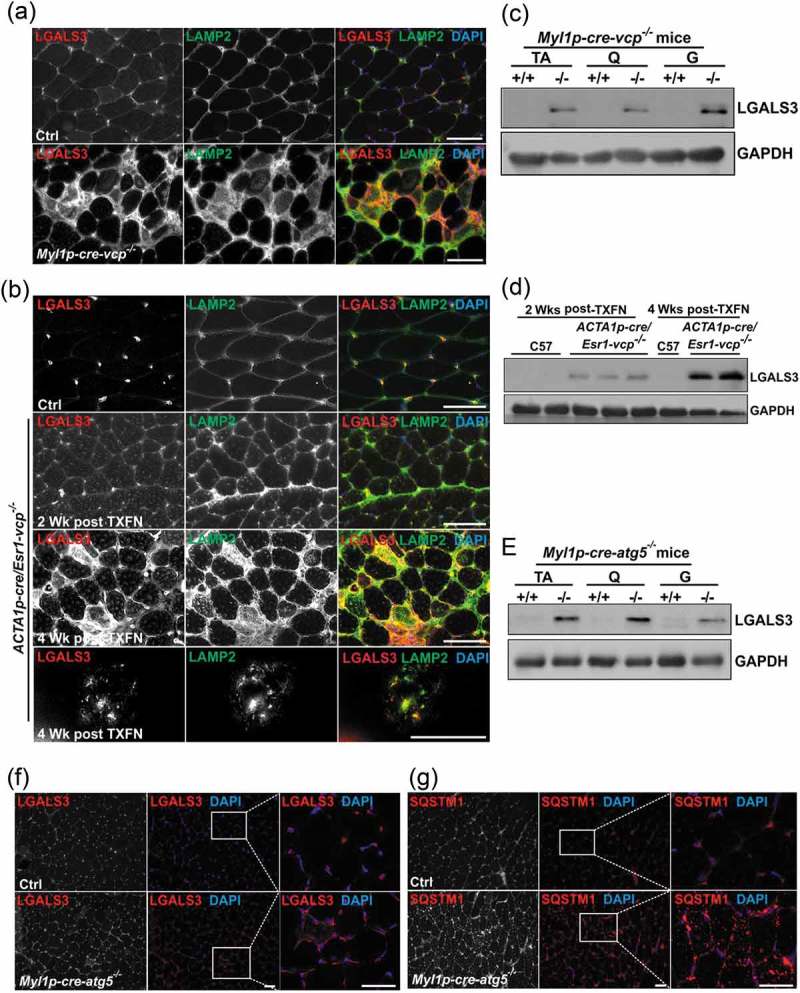
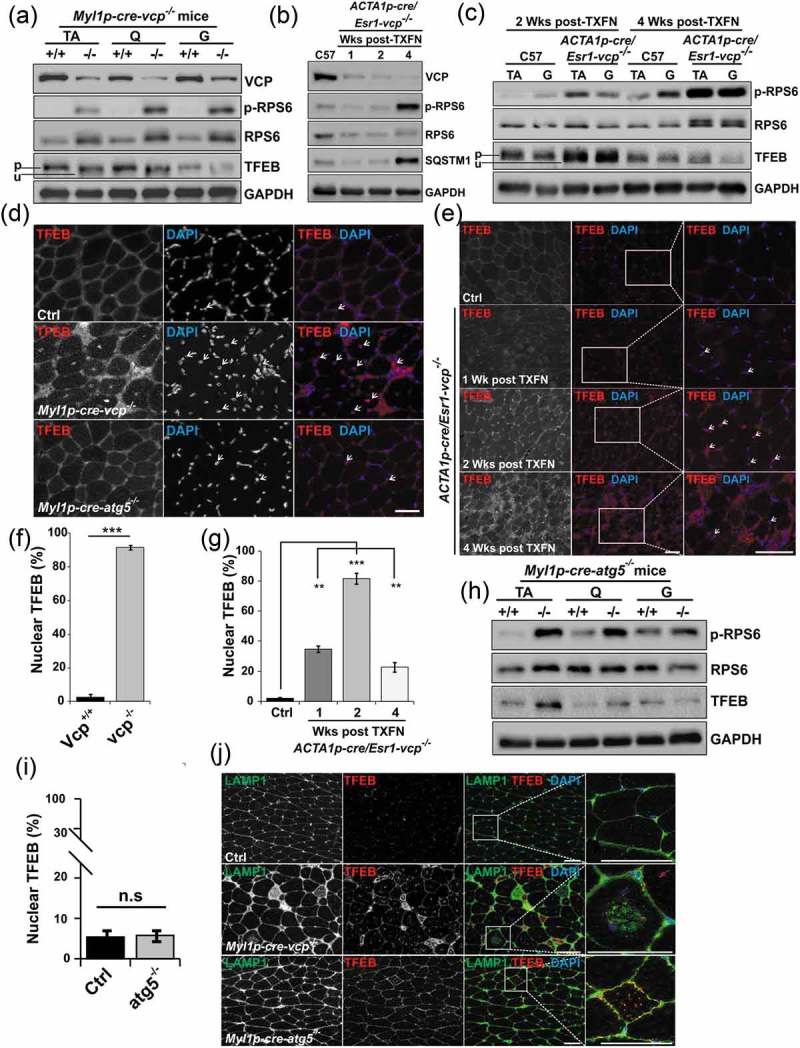
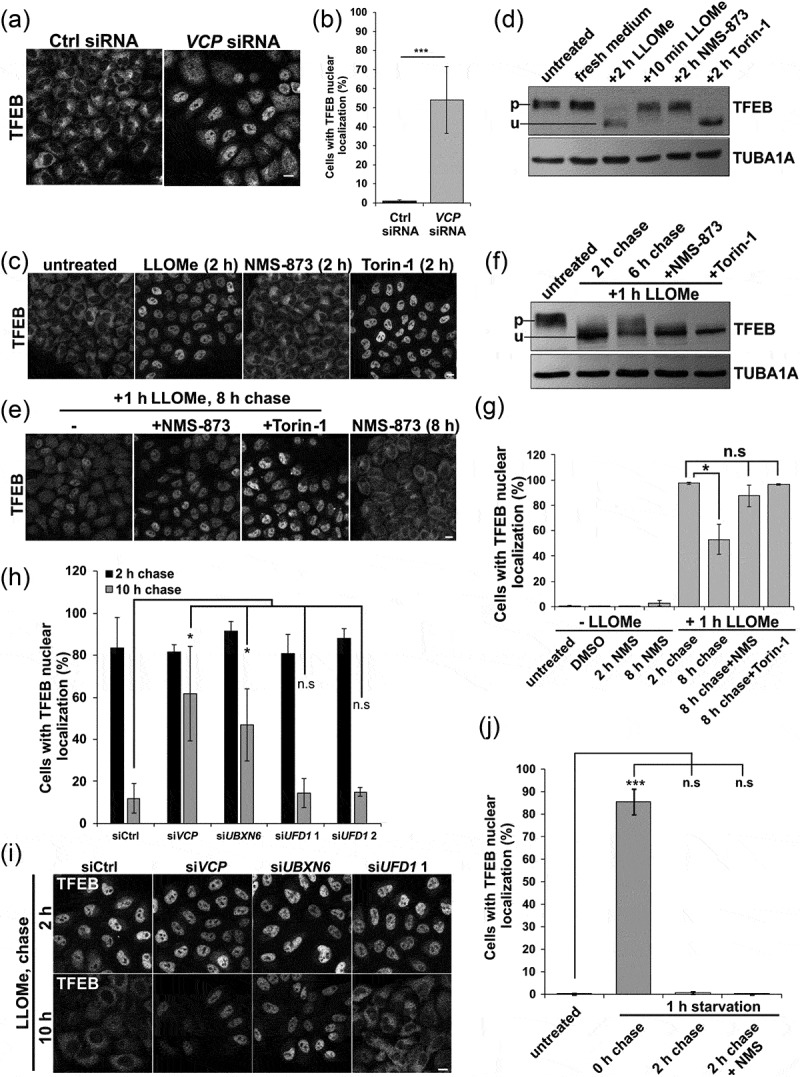
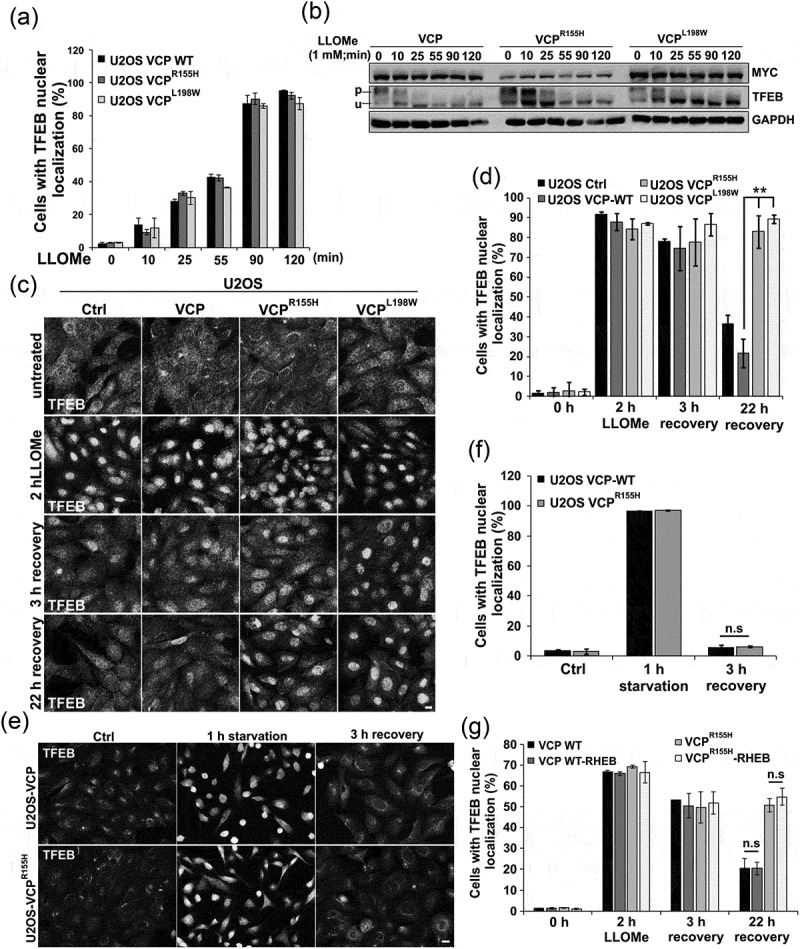
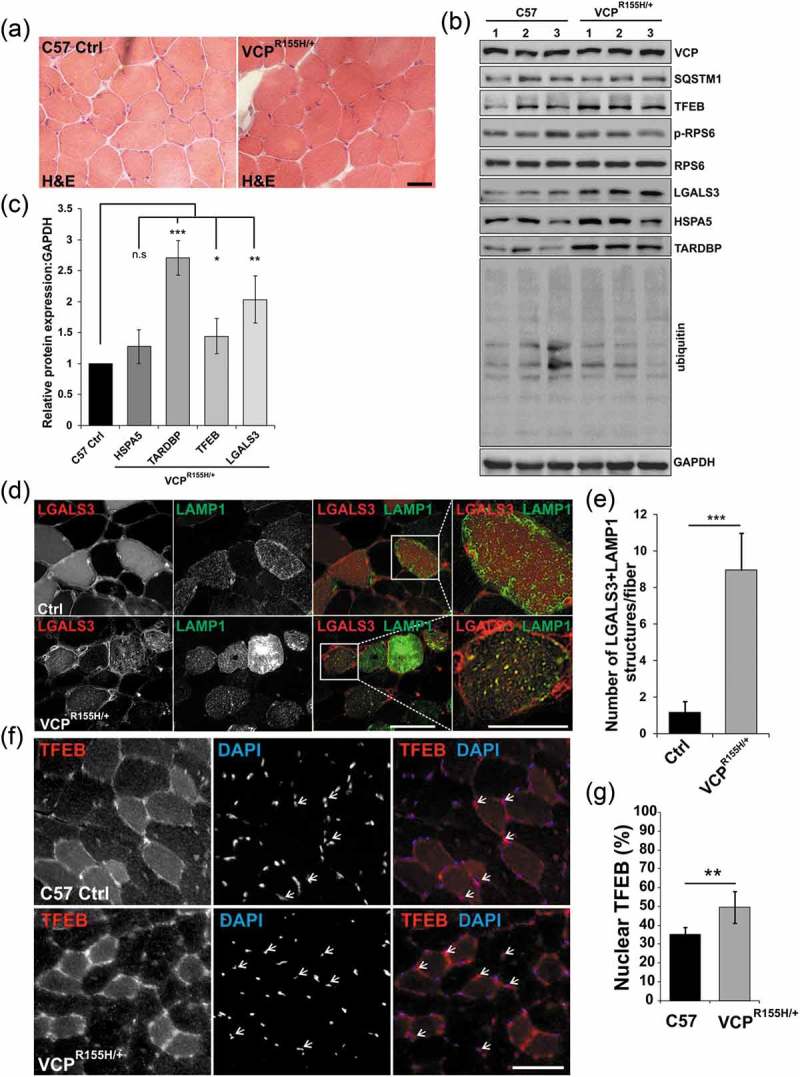
Differentiated tissue is particularly vulnerable to alterations in protein and organelle homeostasis. The essential protein VCP, mutated in hereditary inclusion body myopathy, amyotrophic lateral sclerosis and frontotemporal dementia, is critical for efficient clearance of misfolded proteins and damaged organelles in dividing cells, but its role in terminally differentiated tissue affected by disease mutations is less clear. To understand the relevance of VCP in differentiated tissue, we inactivated it in skeletal muscle of adult mice. Surprisingly, knockout muscle demonstrated a necrotic myopathy with increased macroautophagic/autophagic proteins and damaged lysosomes. This was not solely due to a defect in autophagic degradation because age-matched mice with muscle inactivation of the autophagy essential protein, ATG5, did not demonstrate a myopathy. Notably, myofiber necrosis was preceded by upregulation of LGALS3/Galectin-3, a marker of damaged lysosomes, and TFEB activation, suggesting early defects in the lysosomal system. Consistent with that, myofiber necrosis was recapitulated by chemical induction of lysosomal membrane permeabilization (LMP) in skeletal muscle. Moreover, TFEB was activated after LMP in cells, but activation and nuclear localization of TFEB persisted upon VCP inactivation or disease mutant expression. Our data identifies VCP as central mediator of both lysosomal clearance and biogenesis in skeletal muscle. Abbreviations: AAA: ATPases Associated with diverse cellular Activities; TUBA1A/α-tubulin: tubulin alpha 1a; ATG5: autophagy related 5; ATG7: autophagy related 7; ACTA1: actin alpha 1, skeletal muscle; CLEAR: coordinated lysosomal expression and regulation; CTSB/D: cathepsin B/D; Ctrl: control; DAPI: diamidino-2-phenylindole; EBSS: Earle's balanced salt solution; ELDR: endolysosomal damage response; ESCRT: endosomal sorting complexes required for transport; Gastroc/G: gastrocnemius; H&E: hematoxylin and eosin; HSPA5/GRP78: heat shock protein family A (Hsp70) member 5; IBMPFD/ALS: inclusion body myopathy associated with Paget disease of the bone, frontotemporal dementia and amyotrophic lateral sclerosis; i.p.: intraperitoneal; LAMP1/2: lysosomal-associated membrane protein 1/2; LLOMe: Leu-Leu methyl ester hydrobromide; LGALS3/Gal3: galectin 3; LMP: lysosomal membrane permeabilization; MTOR: mechanistic target of rapamycin kinase; MYL1: myosin light chain 1; MAP1LC3/LC3: microtubule associated protein 1 light chain 3; MSP: multisystem proteinopathy; PBS: phosphate-buffered saline; PCR: polymerase chain reaction; Quad/Q: quadriceps; RHEB: Ras homolog, mTORC1 binding; SQSTM1: sequestosome 1; TFEB: transcription factor EB; TA: tibialis anterior; siRNA: small interfering RNA; SQSTM1/p62, sequestosome 1; TARDBP/TDP-43: TAR DNA binding protein; TBS: Tris-buffered saline; TXFN, tamoxifen; UBXN6/UBXD1: UBX domain protein 6; VCP: valosin containing protein; WT: wild-type.

Keywords: Autophagy; TFEB; VCP; lysosome; myopathy; skeletal muscle.


Figures

Figure 1.
Figure 1.
Muscle-specific inactivation of VCP leads to weakness. (a) VCP inactivation strategy. (b) PCR genotyping confirms germline transmission and homozygosity of double floxed allele. (c) Immunoblot of lysates from tibialis anterior (TA), quadriceps (Q), gastrocnemius (G), diaphragm muscle, heart and kidney of 6 wk old control (+/+) or Myl1p-cre-vcp-/- (-/-) mice using antibodies to VCP or GAPDH. (d) Average body weight of 23-week-old control (+/+) or Myl1p-cre-vcp-/- mice. N = 6 mice per group. (e) Image of C57 control and Myl1p-cre-vcp-/- mice at 24 wk of age. (f) Quantification of mean holding impulse for control or Myl1p-cre-vcp-/- mice from age 11–26 wk. N = 6 mice per group. (g) Kaplan-Meier survival curve of control and Myl1p-cre-vcp-/- mice. N = 7 per group. *p < 0.05; **p < 0.01; ***p < 0.001; n.s., not significant.
Figure 2.
Figure 2.
Muscle-specific inactivation of VCP leads to a myopathy. (a) Hematoxylin and eosin (H & E) or NADH staining of tibialis anterior and gastrocnemius from 6-week-old control, 6- and 9-week-old Myl1p-cre-vcp-/- or 9-week-old Myl1p-cre-atg5-/- mice. (b) Immunoblot of lysates from TA, quadriceps, or gastrocnemius of 6-week-old control (+/+) or Myl1p-cre-vcp-/- (-/-) mice using antibodies to VCP, SQSTM1, LC3, HSPA5, ubiquitin or GAPDH. (c) Immunoblot of lysates from TA, quadriceps or gastrocnemius muscle of 9-week-old control or Myl1p-cre-atg5-/- mice using antibodies to ATG5, SQSTM1, LC3, HSPA5, ubiquitin or GAPDH. (d) Densitometric analysis of LC3-I and LC3-II levels in control and Myl1p-cre-vcp-/- mouse muscle. N = 3 mice per group. Quantification was performed using western blots of TA’s, quadriceps, and gastrocnemius from each mouse. Comparison between groups was performed using a paired Student t-test. (e) Densitometric ratios of LC3-II:LC3-I levels in control and Myl1p-cre-vcp-/- mouse muscle. N = 3 mice per group. Quantification was performed using western blots of TA’s, quadriceps, and gastrocnemius from each mouse. Comparison between groups was performed using a paired Student t-test. (f) Graph of fold expression change of mRNA of lysosomal proteins from the TA muscle from 9-week-old control or Myl1p-cre-vcp-/- mice. (g) Graph of fold expression change of mRNA of Map1lc3a/b from the TA muscle from 9-week-old control or Myl1p-cre-vcp-/- mice. *p < 0.05; **p < 0.01; ***p < 0.001; n.s., not significant. Scale: 100 μm.
Figure 3.
Figure 3.
VCP is necessary for differentiated skeletal muscle survival. (a) Immunoblot of lysates from tibialis anterior (TA) or gastrocnemius (G) muscle of age-matched control (C57) or ACTA1p-cre/Esr1-vcp-/- mice after 2 and 4 wk post tamoxifen (TXFN) injection for 5 d using antibodies to VCP, SQSTM1, LC3, HSPA5, ubiquitin or GAPDH. (b) Immunoblot of lysates from TA of 2 age-matched control or 2 ACTA1p-cre/Esr1-vcp-/- mice after 4 and 6 wk post tamoxifen injection for 5 d using antibodies to VCP, SQSTM1, ubiquitin or GAPDH. (c) H & E of TA muscle from age-matched control or ACTA1p-cre/Esr1-vcp-/- mice after 2, 4 and 6 wk post tamoxifen injection for 5 d. Arrows point to regenerating fibers and arrowheads point to necrotic fibers. (d) Graph of fold expression change of mRNA of autophagic proteins from the TA muscle from control or ACTA1p-cre/Esr1-vcp-/- mice after 1, 2, 4 and 6 wk post tamoxifen injection for 5 d. (e) Graph of fold expression change of mRNA of lysosomal proteins from the TA muscle from control or ACTA1p-cre/Esr1-vcp-/- mice after 1, 2, 4 and 6 wk post tamoxifen injection for 5 d. *p < 0.05; **p < 0.01; ***p < 0.001; Scale: 100 μm.
Figure 4.
Figure 4.
Muscle-specific inactivation of VCP leads to the accumulation of autophagic debris. (a) Co-immunofluorescence for LC3 (green) and SQSTM1 (red), in 6-week-old control or Myl1p-cre-vcp-/- mice. Merged images also contain DAPI nuclei staining (blue). Scale: 100 μm. (b) Immunofluorescence for LC3 (red) and DAPI-stained nuclei (blue) in ACTA1p-cre/Esr1-vcp-/- mice after 4 wk post tamoxifen injection for 5 d. Scale: 100 μm. (c) Electron micrograph images of the TA from Myl1p-cre-vcp-/- mice. Scale bars: 2 μm and 600 nm.
Figure 5.
Figure 5.
Damaged lysosomes are an early feature of VCP inactivation in muscle degeneration. (a) Co-immunofluorescence for LAMP2 (green) and LGALS3 (red), in 6-week-old control or Myl1p-cre-vcp-/- mice. (b) Co-immunofluorescence for LAMP2 (green) and LGALS3 (red) in control or ACTA1p-cre/Esr1-vcp-/- mice after 2 and 4 wk post tamoxifen injection for 5 d. (c) Immunoblot of lysates from TA, quadriceps or gastrocnemius muscle of 6-week-old control (+/+) or Myl1p-cre-vcp-/- (-/-) mice using antibodies to LGALS3 or GAPDH. (d) Immunoblot of lysates from TA of age-matched control or ACTA1p-cre/Esr1-vcp-/- mice after 2 and 4 wk post tamoxifen injection for 5 d using antibodies to LGALS3, or GAPDH. (e) Immunoblot of lysates from tibialis anterior, quadriceps or gastrocnemius muscle of 9-week-old control or Myl1p-cre-atg5-/- mice using antibodies to LGALS3 or GAPDH. f-g) Immunofluorescence for LGALS3 or SQSTM1 in control or 9-week-old Myl1p-cre-atg5-/- mouse muscle. DAPI (blue) stains nuclei. Scale: 100 μm.
Figure 6.
Figure 6.
TFEB activation is an early feature of VCP inactivation in muscle degeneration. (a) Immunoblot of lysates from TA, quadriceps or gastrocnemius muscle of 6-week-old control (+/+) or Myl1p-cre-vcp-/- (-/-) mice using antibodies to VCP, p-RPS6, RPS6, TFEB or GAPDH. Lines adjacent to TFEB denote the higher migrating phosphorylated form (p) and the faster migrating unphosphorylated form (u). (b) Immunoblot of lysates from TA of age matched control or ACTA1p-cre/Esr1-vcp-/- mice after 1, 2 and 4 wk post tamoxifen injection for 5 d using antibodies to VCP, p-RPS6, RPS6, SQSTM1 or GAPDH. (c) Immunoblot of lysates from tibialis anterior or gastrocnemius muscle of age matched control or ACTA1p-cre/Esr1-vcp-/- mice after 2 and 4 wk post tamoxifen injection for 5 d using antibodies to p-RPS6, RPS6, TFEB or GAPDH. Lines adjacent to TFEB denote the higher migrating phosphorylated form (p) and the faster migrating unphosphorylated form (u). (d) Immunofluorescence with an antibody to TFEB on TA muscle from 6-week-old control, Myl1p-cre-vcp-/-, and 9-week-old Myl1p-cre-atg5-/-mice. Arrows point to nuclear-localized TFEB. (e) Immunofluorescence with an antibody to TFEB on TA muscle from age-matched control or ACTA1p-cre/Esr1-vcp-/- mice after 1, 2 and 4 wk post tamoxifen injection for 5 d. Arrows point to nuclear localized TFEB. (f) Bar graph of the percentage of TFEB-positive nuclei in muscle from 6-week-old control (+/+) and Myl1p-cre-vcp-/- (-/-) mice. Quantification was performed by counting the number of nuclei stained with TFEB in control (+/+) and Myl1p-cre-vcp-/- (-/-) mice using ImageJ software. At least 198 nuclei were counted per condition using 3 different mice. Comparison between groups was performed by paired Student t-test. (g) Bar graph of the percentage of TFEB-positive nuclei in muscle from control or ACTA1p-cre/Esr1-vcp-/- mice after 1, 2 and 4 wk post tamoxifen injection for 5 d. Quantification was performed by counting the number of nuclei stained with TFEB using ImageJ software. At least 236 nuclei were counted per condition from 3 different mice. Comparison between groups was performed using a paired Student t-test. (h) Immunoblot of lysates from tibialis anterior, quadriceps or gastrocnemius muscle of 9-week-old control or Myl1p-cre-atg5-/- mice using antibodies to p-RPS6, RPS6, TFEB or GAPDH. (i) Bar graph of the percentage of TFEB-positive nuclei in muscle from 9-week-old control and Myl1p-cre-atg5-/- mice. Quantification was performed by counting the number of nuclei stained with TFEB using ImageJ software. At least 1293 nuclei were counted per condition from 3 different mice. Comparison between groups was performed by paired Student t-test. (j) Co-immunofluorescence of LAMP1 and TFEB in control, Myl1p-cre-atg5-/-, or Myl1p-cre-vcp-/- mouse muscle. *p < 0.05; **p < 0.01; ***p < 0.001; n.s., not significant. DAPI (blue) stains nuclei. Scale: 100 μm.
Figure 7.
Figure 7.
Inhibition of VCP and ELDR components lead to TFEB nuclear persistence following LMP. (a) TFEB immunolocalization in HeLa cells following control or VCP siRNA treatment for 48 h. (b) Bar graph of the percentage of TFEB-positive nuclei in HeLa cells following control or Vcp siRNA treatment. At least 249 cells were counted per condition and experiment. (c) TFEB immunolocalization from cells treated with LLOMe, NMS-873 or Torin-1 for 2 h. (d) Immunoblot for TFEB or TUBA1A/alpha-tubulin from HeLa cells treated with LLOMe, NMS-873 or Torin-1 for the indicated times. Lines adjacent to TFEB denote the higher migrating phosphorylated form (p) and the faster migrating unphosphorylated form (u). (e) TFEB immunolocalization from HeLa cells treated with LLOMe for one hour and allowed to recovery in the absence of LLOMe for 8 h. In some cases, cells were also incubated with NMS-873 or Torin-1 during recovery. (f) Immunoblot for TFEB or TUBA1A/α-tubulin from HeLa cells treated with LLOMe for 2 h or 1 h and then allowed to recover in the absence of LLOMe for 6 h. In some cases, cells were also incubated with NMS-873 or Torin-1 during recovery. Lines adjacent to TFEB denote the higher migrating phosphorylated form (p) and the faster migrating unphosphorylated form (u). (g) Bar graph of the percentage of cells with TFEB-positive nuclei from conditions in C and E. At least 644 cells were counted per condition and experiment. (h) Bar graph of the percentage of cells with TFEB-positive nuclei following control or VCP, YOD1, UBXN6, PLAA or UFD1 siRNA knockdown following 1 h of treatment with LLOMe and subsequent chase with media lacking LLOMe for 2 or 10 h. At least 251 cells were counted per condition and experiment. (i) TFEB immunolocalization in HeLa cells with control or VCP, UBXN6 or UFD1 siRNA knockdown following 1 h of treatment with LLOMe and subsequent chase with media lacking LLOMe for the 2 or 10 h. (j) Bar graph of TFEB-positive nuclei following 1 h of nutrient starvation and 2 h recovery nutrient-rich media with and without NMS-873. At least 631 cells were counted per condition and experiment. *p < 0.05; ***p < 0.001; n.s., not significant. Automated quantification with N = 3. Scale: 1 μm.
Figure 8.
Figure 8.
VCP mutant expression leads to TFEB nuclear persistence following LMP. (a) Bar graph of TFEB-positive nuclei following LLOMe treatment in VCP WT and 2 VCP disease mutant (VCPR155H or VCPL198W)-expressing cells. Quantification was performed by counting the number of cells with nuclear TFEB localization using ImageJ software. At least 304 cells were counted per group and condition. Comparison between groups was performed by paired Student t-test. (b) Immunoblot of lysates from U2OS cells stably expressing VCP WT, VCPR155H or VCPL198W following LLOMe treatment for the indicated times. Lines adjacent to TFEB denote the higher migrating phosphorylated form (p) and the faster migrating unphosphorylated form (u). (c) TFEB immunolocalization in U2OS cells expressing control, VCP WT or 1 of 2 VCP mutations following 2 h of treatment with LLOMe and subsequent chase with media lacking LLOMe for the 3 or 22 h. (d) Bar graph of TFEB-positive nuclei following LLOMe treatment and recovery in VCP WT- and mutant-expressing cells. Quantification was performed by counting the number of cells with nuclear TFEB localization using ImageJ software. At least 100 cells were counted per group and condition. Comparison between groups was performed by paired Student t-test. (e) TFEB immunolocalization in U2OS cells expressing control, VCP WT or VCPR155H following 1 h of nutrient starvation and subsequent chase with media containing serum and amino acids for 3 h. (f) Bar graph of TFEB-positive nuclei following starvation and recovery in VCP WT- and VCPR155H mutant-expressing U2OS cells. Quantification was performed by counting the number of cells with nuclear TFEB localization using ImageJ software. At least 568 cells were counted per group and condition. Comparison between groups was performed by paired Student t-test. (g) Bar graph of TFEB-positive nuclei following LLOMe treatment and recovery in VCP WT- and mutant-expressing U2OS cells with or without constitutively active RHEB. Quantification was performed by counting the number of cells with nuclear TFEB localization using ImageJ software. At least 248 cells were counted per group and condition. Comparison between groups was performed by paired Student t-test.**p < 0.01; n.s., not significant. N = 3. Scale: 10 μm.
Figure 9.
Figure 9.
Lysosomal homeostasis is dysregulated in VCP diseased skeletal muscle. (a) H & E of TA from 13-month-old control (C57) or VCPR155H/+ heterozygous knockin mice. (b) Immunoblot of lysates from the TA from 13-month-old control or VCPR155H/+ knockin mice with antibodies to VCP, SQSTM1, TFEB, p-RPS6, RPS6, LGALS3, HSPA5, TARDBP, ubiquitin and GAPDH. N = 3 per group. (c) Densitometric analysis of TFEB, LGALS3, HSPA5, and TARDBP protein levels in VCPR155H/+ mice as compared to controls. N = 3 per group. (d) Fluorescence microscopy of control or VCPR155H/+ mouse TA muscle electroporated with plasmids expressing LAMP1-GFP (green) or mCherry-LGALS3 (red). (e) Quantification of the average number of LGALS3+ LAMP1 puncta in control or VCPR155H/+ mouse TA muscle electroporated with plasmids expressing LAMP1-GFP or mCherry-LGALS3. N = 30 co-electroporated fibers were counted per condition. (f) Immunofluorescence for TFEB (red) in TA from 13-month-old control or VCPR155H/+ knockin mice. Arrows point to nuclear-localized TFEB. (g) Quantification of the percent of TFEB-positive nuclei in tibialis anterior muscle from 13-month-old control or VCPR155H knockin mice. Quantification was performed by counting the number of nuclei stained with TFEB using ImageJ software. At least 1028 nuclei were counted per group from 3 different mice. Comparison between groups was performed by paired Student t-test. DAPI (blue) stains nuclei. *p < 0.05; **p < 0.01; ***p < 0.001; n.s., not significant. Scale: 100 μm.

References

    1. Meyer H, Weihl CC.. The VCP/p97 system at a glance: connecting cellular function to disease pathogenesis. J Cell Sci. 2014. September 15;127(Pt 18):3877–3883. PubMed PMID: 25146396; PubMed Central PMCID: PMCPMC4163641. - PMC - PubMed
    1. Lan B, Chai S, Wang P, et al. VCP/p97/Cdc48, a linking of protein homeostasis and cancer therapy. Curr Mol Med. 2018. March 7;17:608–618. PubMed PMID: 29521227. - PubMed
    1. Muller JM, Deinhardt K, Rosewell I, et al. Targeted deletion of p97 (VCP/CDC48) in mouse results in early embryonic lethality. Biochem Biophys Res Commun. 2007. March 9;354(2):459–465. PubMed PMID: 17239345. - PubMed
    1. Watts GD, Wymer J, Kovach MJ, et al. Inclusion body myopathy associated with Paget disease of bone and frontotemporal dementia is caused by mutant valosin-containing protein. Nat Genet. 2004. April;36(4):377–381. PubMed PMID: 15034582. - PubMed
    1. Taylor JP. Multisystem proteinopathy: intersecting genetics in muscle, bone, and brain degeneration. Neurology. 2015. August 25;85(8):658–660. PubMed PMID: 26208960. - PubMed

Publication types

MeSH terms

Substances