. 2019 Jan 17;19(1):85.
doi: 10.1186/s12885-018-5239-z.

Podoplanin (PDPN) affects the invasiveness of thyroid carcinoma cells by inducing ezrin, radixin and moesin (E/R/M) phosphorylation in association with matrix metalloproteinases

Affiliations

Podoplanin (PDPN) affects the invasiveness of thyroid carcinoma cells by inducing ezrin, radixin and moesin (E/R/M) phosphorylation in association with matrix metalloproteinases

Justyna Sikorska et al. BMC Cancer. .

Abstract

Background: Podoplanin (PDPN) is a mucin-type transmembrane glycoprotein specific to the lymphatic system. PDPN expression has been found in various human tumors and is considered to be a marker of cancer. We had previously shown that PDPN expression contributes to carcinogenesis in the TPC1 papillary thyroid cancer-derived cell line by enhancing cell migration and invasiveness. The aim of this study was to determine the effect of PDPN down-regulation in another thyroid cancer-derived cell line: BcPAP.

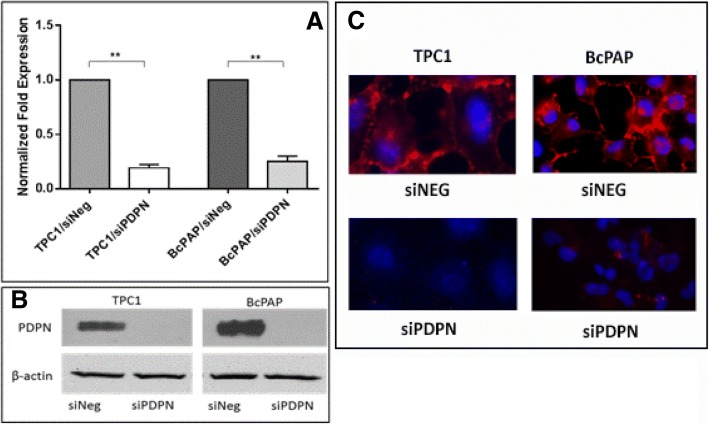
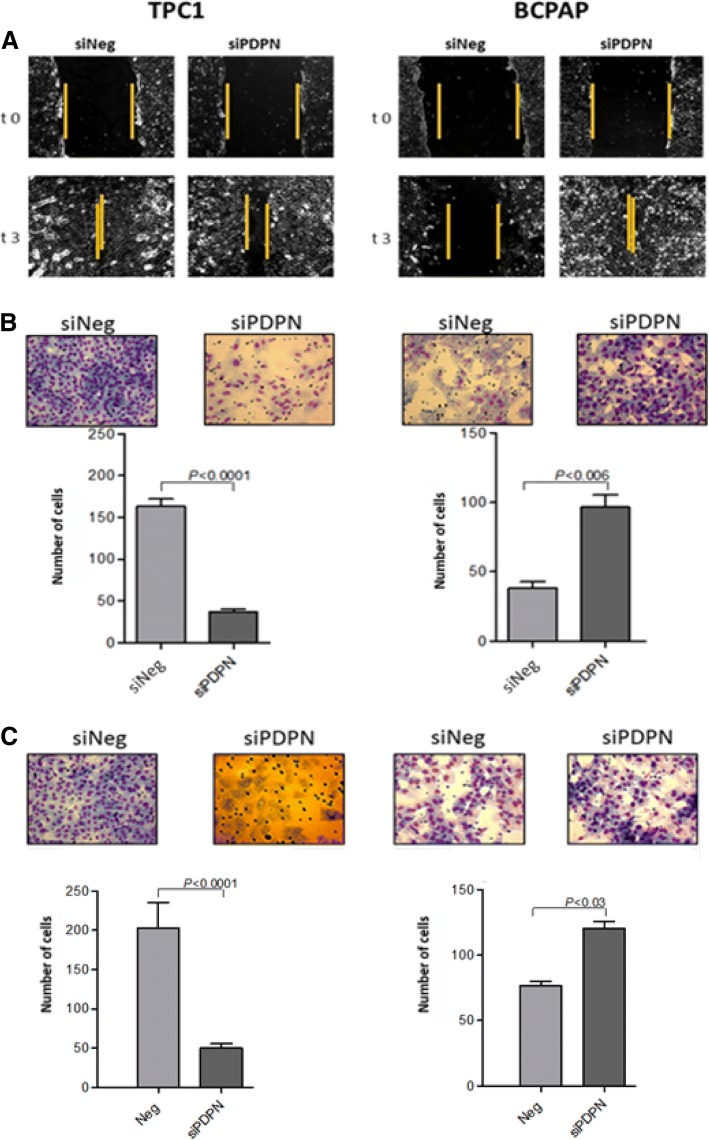
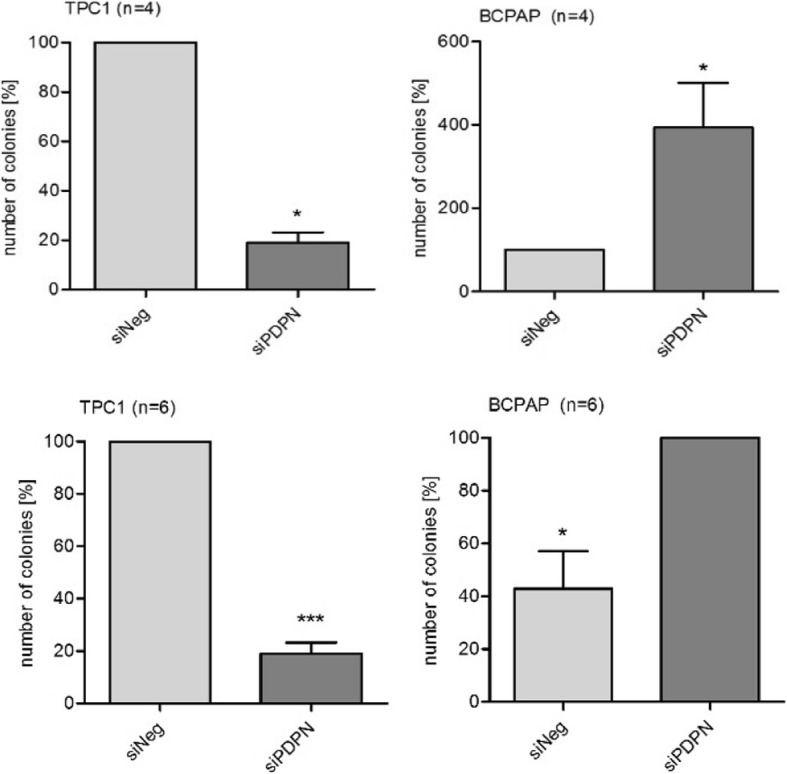
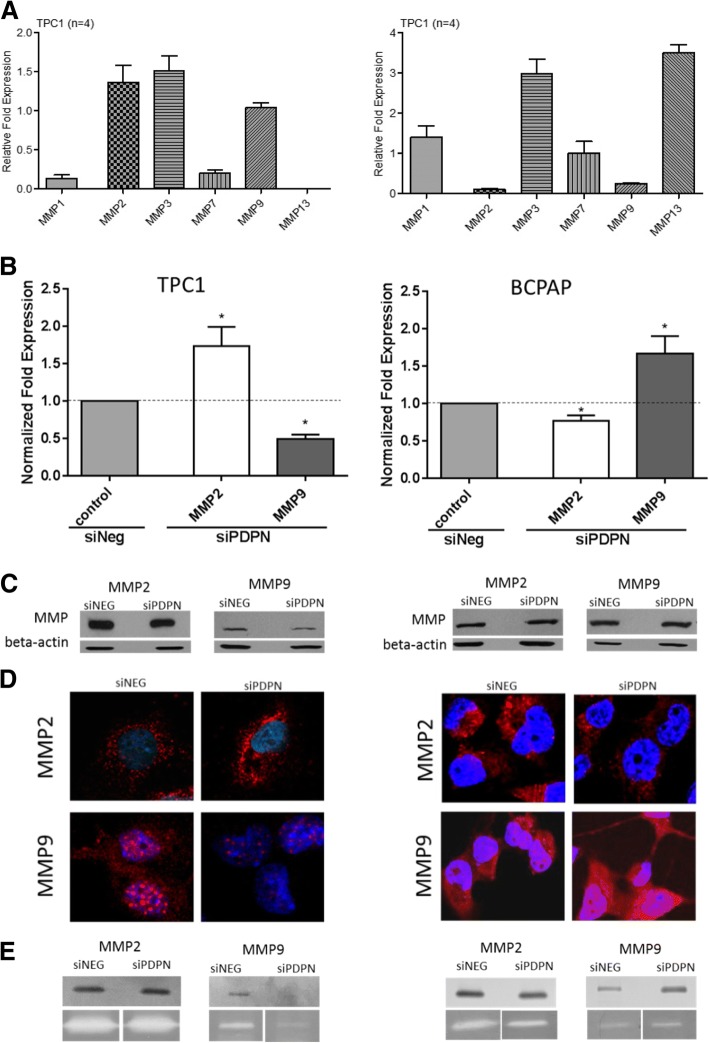
Methods: In order to determine the effects of PDPN on malignant features of BcPAP cells (harboring the BRAFV600E mutated allele) and TPC1 cells (carrying the RET/PTC1 rearrangement), we silenced PDPN in these cells using small interfering RNA (siRNA). The efficacy of PDPN silencing was confirmed by qRT-PCR and Western blotting. Then, we tested the motility and invasiveness of these cells (using scratch test and Transwell assay), their growth capacities F(cell cycle analysis, viability, clonogenic activity) and apoptosis assays), adhesion-independent colony-formation capacities, as well as the effect of PDPN silencing on MMPs expression and activity (zymography).

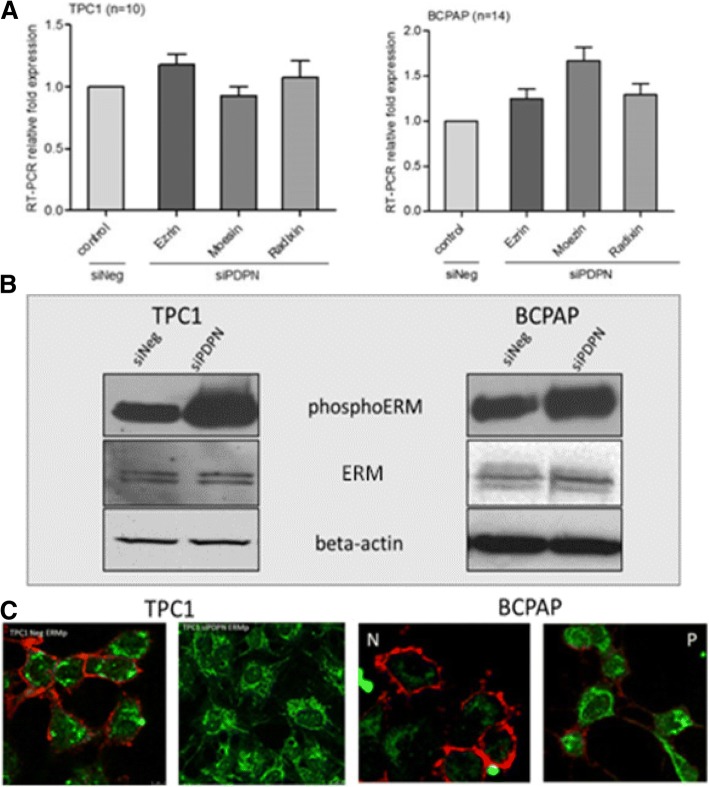
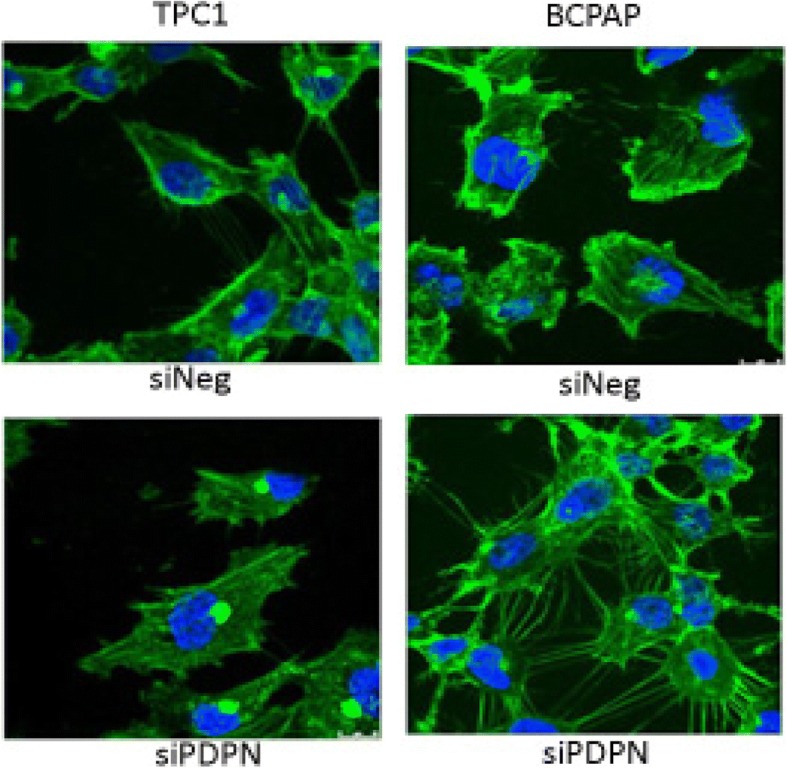
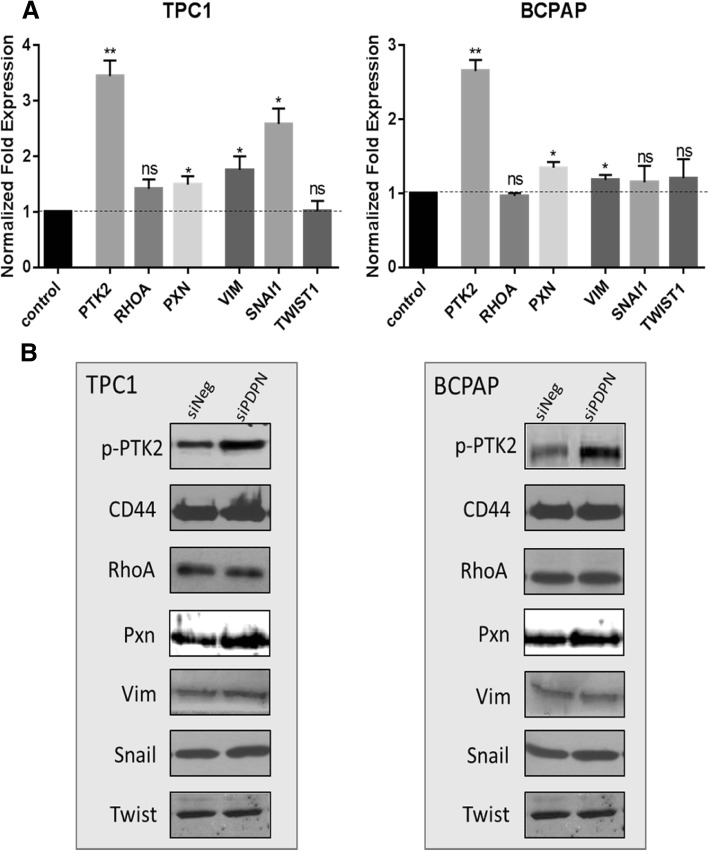
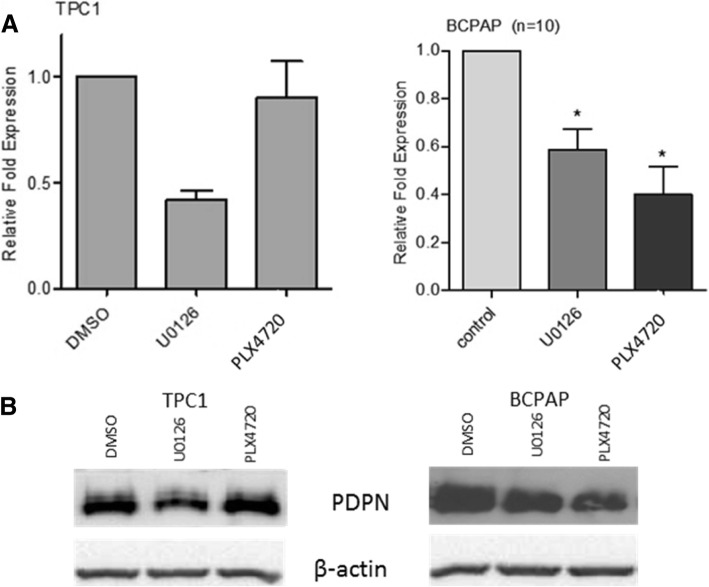
Results: We found that PDPN-induced cell phenotype depended on the genetic background of thyroid tumor cells. PDPN down-regulation in BcPAP cells was negatively correlated with the migration and invasion, in contrast to TPC1 cells in which PDPN depletion resulted in enhanced migration and invasiveness. Moreover, our results suggest that in BcPAP cells, PDPN may be involved in the epithelial-mesenchymal transition (EMT) through regulating the expression of the ezrin, radixin and moesin (E/R/M) proteins, MMPs 9 and MMP2, remodeling of actin cytoskeleton and cellular protrusions. We also demonstrated that PDPN expression is associated with the MAPK signaling pathway. The inhibition of the MAPK pathway resulted in a decreased PDPN expression, increased E/R/M phosphorylation and reduced cell migration. Additionally, PDPN depleted BcPAP cells treated with inhibitors of MEK1/2 kinases (U0126) or of the BRAF V600E protein (PLX4720) had reduced motility, similar to that previously observed in TPC1 cells after PDPN knock-down.

Conclusions: Altogether, our data suggest that PDPN may play an important role in the control of invasion and migration of papillary thyroid carcinoma cells in association with the E/R/M, MMPs and MAPK kinases.

Keywords: BcPAP; Ezrin/radixin/moesin; Invasiveness; Metalloproteinases; Motility; Podoplanin; TPC1.


Conflict of interest statement

Consent for publication

Not applicable.

Competing interests

The authors declare that they have no competing interests.

Publisher’s Note

Springer Nature remains neutral with regard to jurisdictional claims in published maps and institutional affiliations.

Figures

Fig. 1
Fig. 1
Downregulation of podoplanin expression in BcPAP thyroid cancer cells following transfection with PDPN-specific siRNA. a. RT-qPCR analysis of PDPN mRNA levels in BcPAP cells 48 h after transfection with 30 nM siRNA specific for PDPN (siPDPN) or negative control siRNA (siNeg). The results were normalized to the 18S rRNA levels. The bars represent the average fold-change in PDPN transcript levels in cells transfected with siPDPN compared to control cells. The results are representative of four independent experiments. Data are presented as means ± standard errors of the mean (SEM), **: P < 0.01. b. Podoplanin protein levels in BcPAP cells 48 h after transfection with siPDPN or control siNeg by Western blot. β-actin was used as loading control c. Immunofluorescent staining of podoplanin in BcPAP cells transfected with siPDPN or control siNeg. Cells were stained with the anti-PDPN monoclonal antibody D2–40 followed by the DyLight549-conjugated secondary antibody (red), and counterstained with DAPI (blue). Magnification: 630x
Fig. 2
Fig. 2
Podoplanin silencing reduces motility, migratory capacities and invasiveness of BcPAP and TPC1 cells. a. Wound healing motility assay. Representative light microscope images showing healing of wounds in monolayers of TPC1 and BcPAP cells transfected with siPDPN or control siNeg Magnification: 200x. b. Chamber migration assay. siPDPN or siNeg-transfected TPC1 and BcPAP cells were seeded in 8-μm Boyden insert chambers, with the lower reservoir filled with medium supplemented with 10% FBS as a chemoattractant. After 24 h, cells that had passed through the 8-μm membrane pores were fixed, stained with Diff-Quik and photographed at a 40x magnification.. Data are presented as means ± standard errors of the mean (SEM) of at least three independet experiments. c. Matrigel invasion assay. siPDPN- or control siNeg-transfected TPC1 and BcPAP cells were seeded in 8-μm Matrigel Invasion Chambers, with the lower reservoir filled with the culture medium supplemented with 10% FBS as a chemoattractant. After 24 h, cells that had passed through the 8-μm pores in the membrane were fixed with, stained with Diff-Quik Kit, and photographed at 40x magnification. The relative invasiveness of transfected cells is presented in graph form. Data are presented as the mean ± SEM of at least three separate experiments
Fig. 3
Fig. 3
Soft agar (upper panel) and colony formation assay (lower panel). To analyze colony formation and anchorage-independent growth of TPC1 and BcPAP cells after PDPN silencing, the cells were seeded into 100 mm Petri dishes or 6-well culture plates containing soft agar. Colonies were stained with crystal violet and counted under a white light microscope at a 10x and 40x magnification. Data are presented as means ± standard errors of the mean (SEM) of results from at least three independent experiments, * < P, 0.05, .*** < P,0.001
Fig. 4
Fig. 4
Podoplanin silencing enhances phosphorylation of Ezrin, Radixin and Moesin (E/R/M) proteins in TPC1 and BcPAP thyroid cancer cells. a. RT-qPCR analysis of E/R/M mRNA levels 48 h after transfection with siPDPN or control siNeg. The results were normalized to the 18S rRNA levels. The bars represent the average fold change in transcript levels in cells transfected with siPDPN compared to siNeg-transfected control cells. Data are presented as means ± standard errors of the mean (SEM) of results from at least three independent experiments. b. Western blot analysis of phospho-E/R/M protein levels 48 h after transfection. Total protein extracts were separated by SDS-PAGE, transferred onto a nitrocellulose membrane, and probed with specific antibodies. Beta-actin was used as a loading control. The results are representatives of three independent experiments. c. Immunofluorescent staining of podoplanin (red) and phospho-E/R/M (green) proteins in BcPAP (right panels) and TPC1 cells (left panels) transfected with siPDPN or control siNeg. Cells were co-stained with the anti-PDPN mouse antibody D2–40 and anti-phospho-E/R/M rabbit antibody followed by the DyLight549-conjugated anti-mouse secondary antibody (red) and FITC-conjugated anti-rabbit secondary antibody (green), and counterstained with DAPI (blue). Magnification: 630x
Fig. 5
Fig. 5
Silencing of PDPN changes cytoskeleton organization in TPC1 and BcPAP cells. Immunofluorescent staining of cytoskeleton in TPC1 and BcPAP cells transfected with siPDPN or control siNeg. To visualize filamentous actin (F-actin), cells were fixed with with 4% PFA/PBS, permeabilized with 0.1% Triton X-100, and stained with Phalloidin-FITC (green), and counterstained with DAPI (blue). Magnification: 630x
Fig. 6
Fig. 6
Podoplanin silencing does not alter the expression of proteins involved in the epithelial-mesenchymal transition (EMT) in thyroid cancer cells. a. RT-qPCR analysis of mRNA levels in TPC1 and BcPAP thyroid cancer cells 48 h after transfection. The results were normalized to the 18S rRNA levels. The bars represent the average fold change in transcripts levels in cells transfected with siPDPN compared to cells transfected with siNeg. Values are means from at least three independent experiments. Data are presented as means ± standard errors of the mean (SEM) *P < 0.05; **P < 0.01. b. Western blot analysis of CD44, RhoA, Twist, Snail, Vimentin, PTK2 expression levels 48 h after transfection with siPDPN or control siNeg in TPC1 and BcPAP cells. Total protein were separated by SDS-PAGE, transferred onto a nitrocellulose membrane, and probed with specific antibodies. The results are representatives of three independent experiments
Fig. 7
Fig. 7
PDPN silencing alters the expression and activity of matrix metalloproteinases (MMPs) in TPC1 and BcPAP cells. a. The pattern of expression of MMPs mRNA levels in TPC1 and BcPAP cells. b. RT-qPCR analysis of MMP mRNA levels in 48 h after siPDPN transfection compared to those in non-transfected cells. The results were normalized to 18S RNA levels. The bars represent the average fold expression. Data are presented as means ± standard errors of the mean (SEM) of results from at least three independent experiments *P < 0.05. c. Western blot analysis of MMP expression levels 48 h after PDPN silencing. Total protein extracts were separated by SDS-PAGE, transferred onto a nitrocellulose membrane, and probed with specific antibodies. The results are representative of three independent experiments. d. Immunofluorescent staining for MMP-2 and MMP-9 in thyroid cancer cell lines transfected with siPDPN or control siNeg. Cells were fixed with 4% PFA/PBS, permeabilized with 0.1% Triton X-100, and stained with an anti-MMP-2 or anti-MMP-9 monoclonal antibody followed by the DyLight549-conjugated secondary antibody (red), and counterstained with DAPI (blue). Confocal microscopy magnification: 630x. e. Gelatin and collagen zymography for TPC1 and BcPAP cell lines after PDPN silencing
Fig. 8
Fig. 8
Effect of MAPK pathway inhibition on PDPN expression in BcPAP and TPC1 cell lines. a. RT-qPCR analysis of PDPN mRNA levels in BcPAP and TPC1 cells 24 h after treatment with 10 μM PLX4720 (BRAF V600E inhibitor), 50 μM U0126 (MEK1/2 inhibitor), or DMSO as a negative control. The results were normalized to 18S rRNA levels. The bars represent the average fold change in transcript quantity in cells treated with the inhibitors compared to cells treated with DMSO. The results are representative of three independent experiments. Data are presented as the means ± standard errors of the mean (SEM) * < P,0.05; ** < P,0.01. b. Western blot analysis of PDPN, phosphorylated ERK and β-actin protein levels in TPC1 and BcPAP cells 24 h after treatment with 10 μM PLX4720, 50 μM U0126, or DMSO as negative control

Similar articles

Cited by

References

    1. Zimmer G, Oeffner F, von Messling V, Tschernig T, Grone HJ, Klenk HD, Herrler G. Cloning and characterization of gp36, a human mucin-type glycoprotein preferentially expressed in vascular endothelium. Biochem J. 1999;341:277–284. doi: 10.1042/bj3410277. - DOI - PMC - PubMed
    1. Boucherot A, Schreiber R, Pavenstadt H, Kunzelmann K. Cloning and expression of the mouse glomerular podoplanin homologue gp38P. Nephrol Dial Transplant. 2002;17:978–984. doi: 10.1093/ndt/17.6.978. - DOI - PubMed
    1. Suzuki-Inoue K, Kato Y, Inoue O, Kaneko MK, Mishima K, Yatomi Y, Yamazaki Y, Narimatsu H, Ozaki Y. Involvement of the snake toxin receptor CLEC-2, in podoplanin-mediated platelet activation, by cancer cells. J Biol Chem. 2007;282:25993–26001. doi: 10.1074/jbc.M702327200. - DOI - PubMed
    1. BreitenederGeleff S, Matsui K, Soleiman A, Meraner P, Poczewski H, Kalt R, Schaffner G, Kerjaschki D. Podoplanin, novel 43-kd membrane protein of glomerular epithelial cells, is down-regulated in puromycin nephrosis. Am J Pathol. 1997;151:1141–1152. - PMC - PubMed
    1. Martin-Villar E, Scholl FG, Gamallo C, Yurrita MM, Munoz-Guerra M, Cruces J, Quintanilla M. Characterization of human PA2.26 antigen (T1 alpha-2, podoplanin), a small membrane mucin induced in oral squamous cell carcinomas. Int J Cancer. 2005;113:899–910. doi: 10.1002/ijc.20656. - DOI - PubMed

MeSH terms