

Histone deacetylase inhibitors exert anti-tumor effects on human adherent and stem-like glioma cells
- PMID: 30654849
- PMCID: PMC6337817
- DOI: 10.1186/s13148-018-0598-5
Histone deacetylase inhibitors exert anti-tumor effects on human adherent and stem-like glioma cells
Abstract
Background: The diagnosis of glioblastoma (GBM), a most aggressive primary brain tumor with a median survival of 14.6 months, carries a dismal prognosis. GBMs are characterized by numerous genetic and epigenetic alterations, affecting patient survival and treatment response. Epigenetic mechanisms are deregulated in GBM as a result of aberrant expression/activity of epigenetic enzymes, including histone deacetylases (HDAC) which remove acetyl groups from histones regulating chromatin accessibility. Nevertheless, the impact of class/isoform-selective HDAC inhibitors (HDACi) on glioma cells, including glioma stem cells, had not been systematically determined.
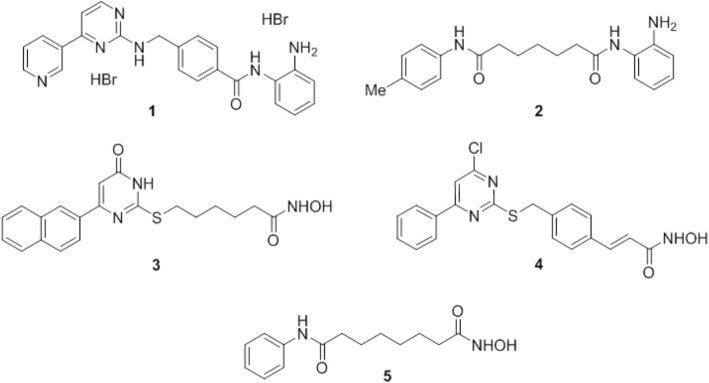
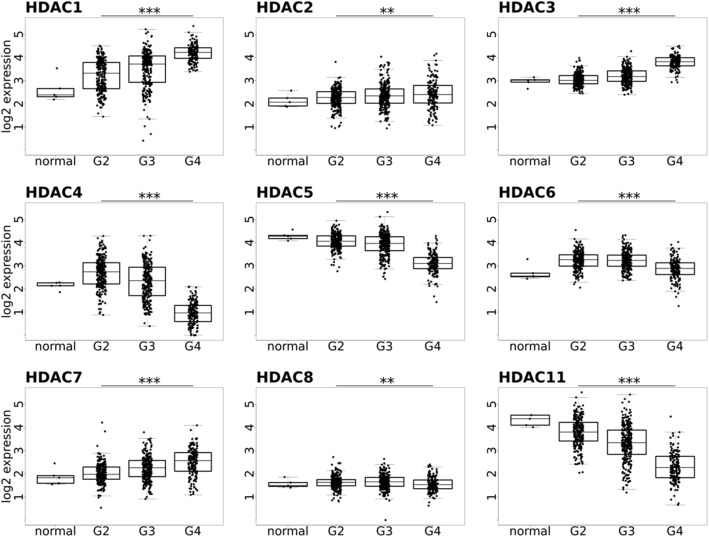
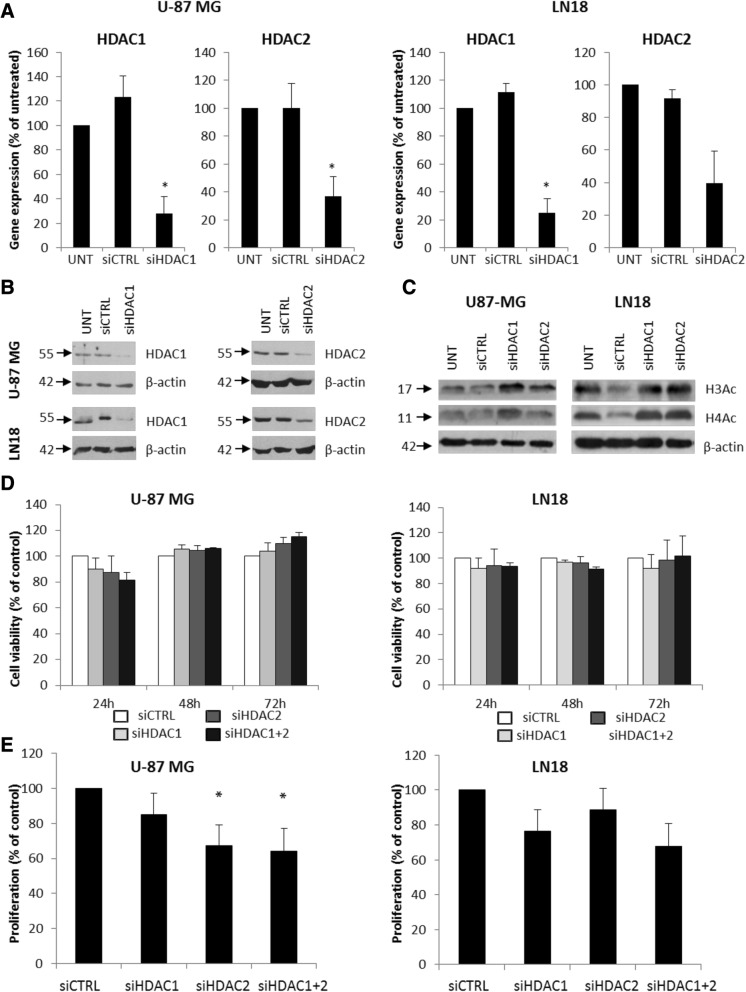
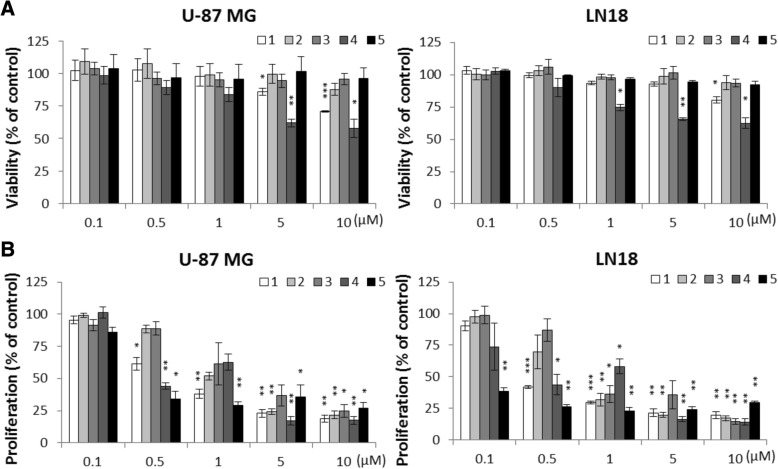
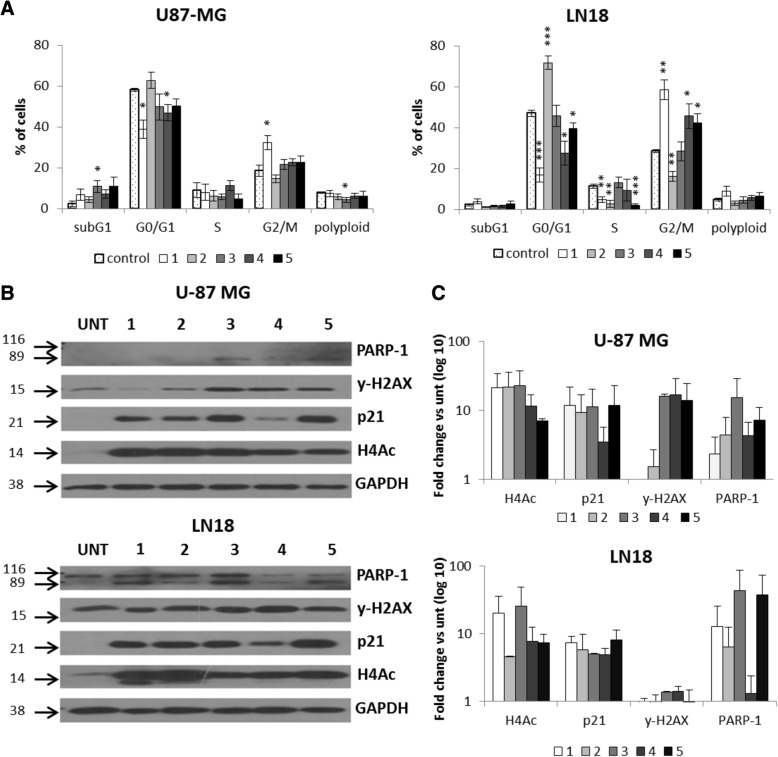
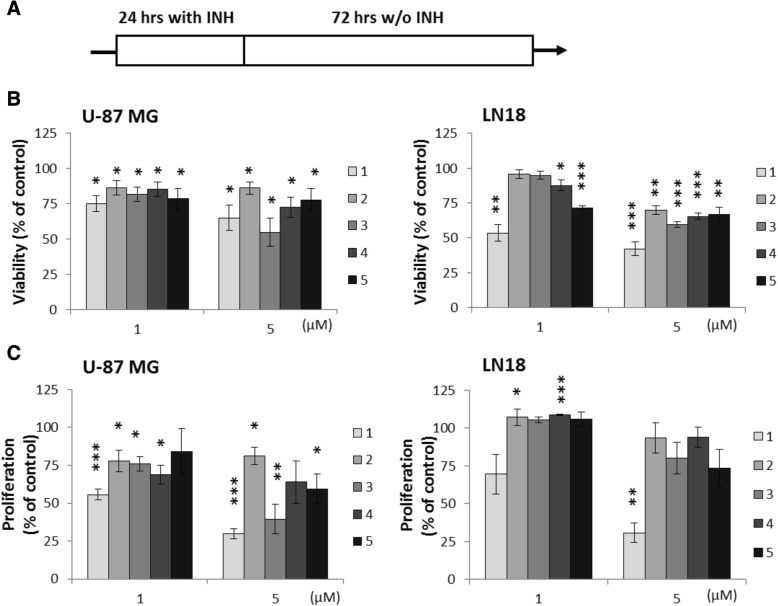
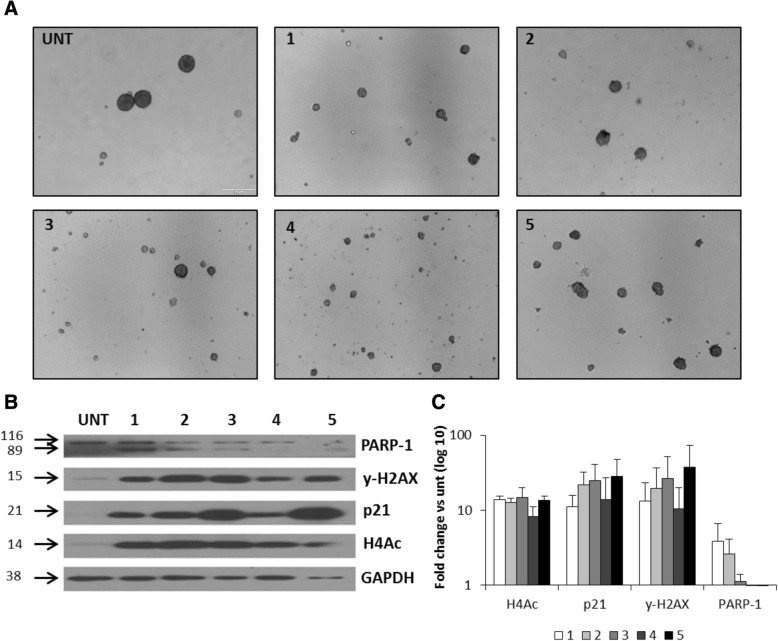
Results: Comprehensive analysis of the public TCGA dataset revealed the increased expression of HDAC 1, 2, 3, and 7 in malignant gliomas. Knockdown of HDAC 1 and 2 in human GBM cells significantly decreased cell proliferation. We tested the activity of 2 new and 3 previously described HDACi with different class/isoform selectivity on human GBM cells. All tested compounds exerted antiproliferative properties on glioma cells. However, the HDACi 1 and 4 blocked proliferation of glioblastoma cells leading to G2/M growth arrest without affecting astrocyte survival. Moreover, 1 and 4 at low micromolar concentrations displayed cytotoxic and antiproliferative effects on sphere cultures enriched in glioma stem cells.
Conclusions: We identified two selective HDAC inhibitors that blocked proliferation of glioblastoma cells, but did not affect astrocyte survival. These new and highly effective inhibitors should be considered as promising candidates for further investigation in preclinical GBM models.
Keywords: Cell proliferation; Epigenetic drugs; Glioblastoma; Glioma stem cells; HDAC inhibitors; Histone deacetylase.
Conflict of interest statement
Ethics approval and consent to participate
Not applicable
Consent for publication
Not applicable
Competing interests
The authors declare that they have no competing interests.
Publisher’s Note
Springer Nature remains neutral with regard to jurisdictional claims in published maps and institutional affiliations.
Figures
Similar articles
-
Krüppel-like factor 9 and histone deacetylase inhibitors synergistically induce cell death in glioblastoma stem-like cells.BMC Cancer. 2018 Oct 22;18(1):1025. doi: 10.1186/s12885-018-4874-8. BMC Cancer. 2018. PMID: 30348136 Free PMC article.
-
Effects of novel HDAC inhibitors on urothelial carcinoma cells.Clin Epigenetics. 2018 Jul 31;10(1):100. doi: 10.1186/s13148-018-0531-y. Clin Epigenetics. 2018. PMID: 30064501 Free PMC article.
-
Suberoylanilide hydroxamic acid represses glioma stem-like cells.J Biomed Sci. 2016 Nov 18;23(1):81. doi: 10.1186/s12929-016-0296-6. J Biomed Sci. 2016. PMID: 27863490 Free PMC article.
-
Advances in histone deacetylase inhibitors in targeting glioblastoma stem cells.Cancer Chemother Pharmacol. 2020 Aug;86(2):165-179. doi: 10.1007/s00280-020-04109-w. Epub 2020 Jul 7. Cancer Chemother Pharmacol. 2020. PMID: 32638092 Review.
-
Epigenetic therapy of cancer with histone deacetylase inhibitors.J Cancer Res Ther. 2014 Jul-Sep;10(3):469-78. doi: 10.4103/0973-1482.137937. J Cancer Res Ther. 2014. PMID: 25313724 Review.
Cited by
-
Suppression of histone deacetylase 1 by JSL-1 attenuates the progression and metastasis of cholangiocarcinoma via the TPX2/Snail axis.Cell Death Dis. 2022 Apr 9;13(4):324. doi: 10.1038/s41419-022-04571-9. Cell Death Dis. 2022. PMID: 35395834 Free PMC article.
-
Final Report on Clinical Outcomes and Tumor Recurrence Patterns of a Pilot Study Assessing Efficacy of Belinostat (PXD-101) with Chemoradiation for Newly Diagnosed Glioblastoma.Tomography. 2022 Mar 3;8(2):688-700. doi: 10.3390/tomography8020057. Tomography. 2022. PMID: 35314634 Free PMC article. Clinical Trial.
-
Chromatin insulation dynamics in glioblastoma: challenges and future perspectives of precision oncology.Clin Epigenetics. 2021 Jul 31;13(1):150. doi: 10.1186/s13148-021-01139-w. Clin Epigenetics. 2021. PMID: 34332627 Free PMC article.
-
DMRTA2 supports glioma stem-cell mediated neovascularization in glioblastoma.Cell Death Dis. 2024 Mar 20;15(3):228. doi: 10.1038/s41419-024-06603-y. Cell Death Dis. 2024. PMID: 38509074 Free PMC article.
-
Aberrantly Expressed RECQL4 Helicase Supports Proliferation and Drug Resistance of Human Glioma Cells and Glioma Stem Cells.Cancers (Basel). 2020 Oct 11;12(10):2919. doi: 10.3390/cancers12102919. Cancers (Basel). 2020. PMID: 33050631 Free PMC article.
References
-
- Ostrom QT, Gittleman H, Liao P, Vecchione-Koval T, Wolinsky Y, Kruchko C, Barnholtz-Sloan JS. CBTRUS statistical report: primary brain and other central nervous system tumors diagnosed in the United States in 2010–2014. Neuro-Oncology. 2017;19:v1–v88. doi: 10.1093/neuonc/nox158. - DOI - PMC - PubMed
Publication types
MeSH terms
Substances
LinkOut - more resources
Full Text Sources
Medical
Miscellaneous
