. 2019 Jan 22;26(4):996-1009.e4.
doi: 10.1016/j.celrep.2019.01.010. Epub 2019 Jan 15.

Quantitative 3D Mapping of the Human Skeletal Muscle Mitochondrial Network

Affiliations

Quantitative 3D Mapping of the Human Skeletal Muscle Mitochondrial Network

Amy E Vincent et al. Cell Rep. .

Erratum in

  • Quantitative 3D Mapping of the Human Skeletal Muscle Mitochondrial Network.
    Vincent AE, White K, Davey T, Philips J, Ogden RT, Lawless C, Warren C, Hall MG, Ng YS, Falkous G, Holden T, Deehan D, Taylor RW, Turnbull DM, Picard M. Vincent AE, et al. Cell Rep. 2019 Apr 2;27(1):321. doi: 10.1016/j.celrep.2019.03.051. Cell Rep. 2019. PMID: 30943412 Free PMC article. No abstract available.

Abstract

Genetic and biochemical defects of mitochondrial function are a major cause of human disease, but their link to mitochondrial morphology in situ has not been defined. Here, we develop a quantitative three-dimensional approach to map mitochondrial network organization in human muscle at electron microscopy resolution. We establish morphological differences between human and mouse and among patients with mitochondrial DNA (mtDNA) diseases compared to healthy controls. We also define the ultrastructure and prevalence of mitochondrial nanotunnels, which exist as either free-ended or connecting membrane protrusions across non-adjacent mitochondria. A multivariate model integrating mitochondrial volume, morphological complexity, and branching anisotropy computed across individual mitochondria and mitochondrial populations identifies increased proportion of simple mitochondria and nanotunnels as a discriminant signature of mitochondrial stress. Overall, these data define the nature of the mitochondrial network in human muscle, quantify human-mouse differences, and suggest potential morphological markers of mitochondrial dysfunction in human tissues.

Keywords: 3D morphometry; imaging; machine learning; mitochondrial disease; mitochondrion; nanotunnel; reconstruction; reticulum; serial block-face SEM; skeletal muscle.


Figures

Figure 1.
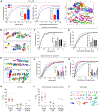
Figure 1.. Imaging and Quantitative Analysis of Mitochondrial Morphology and Volume in IMF and SS Mitochondrial Subpopulations in Human Skeletal Muscle
(A) Electron micrograph of human skeletal muscle in transverse (i.e., cross section) orientation. A single cell is highlighted (yellow), with corresponding higher magnification images of intermyofibrillar (IMF) and subsarcolemmal (SS) mitochondria. Note the difference in morphology between IMF and SS mitochondrial sub-populations. (B) Z stack at EM resolution from serial block face scanning electron microscopy (SBF-SEM) used for 3D reconstructions. See Video S1 for animation. Total imaging depth is 12 μm. (C) The human mitochondrial network was reconstructed and shown here in transverse (top view) and longitudinal (side view) orientations. Each mitochondrion is a different color. (D) The spectrum of human IMF and SS mitochondrial shapes and volumes, ranked left to right from smallest to largest. (E) Schematic of a skeletal muscle fiber and the different sarcomeric planes. The mitochondrial branching index (MBI) is used to quantify the relative branching in the transverse and longitudinal orientations. Trans, transverse; Long, longitudinal. (F) Two reconstructed mitochondria from SBF-SEM seen in both transverse and longitudinal orientations. The orange mitochondrion (left) is longer and more branched in the longitudinal orientation of the muscle fiber (i.e., columnar), whereas the red mitochondrion (right) is more extensively branched in the transverse orientation (i.e., in cross section). This branching anisotropy is captured by each mitochondrion’s MBI value.
Figure 2.
Figure 2.. Mitochondrial Morphology Differs between Healthy Humans and Mice
(A) Electron micrograph and 3D reconstruction of mitochondria in mouse tibialis anterior muscle. Muscle was fixed in two ways: by immersion after a delay at room temperature (left) and via transcradial perfusion without delay (right). Scale bars, 1 μm. (B and C) IMF mitochondrial volume (B) and MCI (C) in mouse muscle fixed by transcardial perfusion (orange) and immersion (pink) fixation shown as cumulative frequency distributions. Each line represents data from 150 mitochondria sampled across 3 muscle fibers in each animal. n = 3 mice per group. (D) Mitochondrial volume and (E) MCI in healthy humans (blue) and mice (orange) shown as cumulative frequency distributions. n = 6 mice and 8 humans. (F) Average MCI for human and mouse IMF mitochondria. Data are means ± SEM; n = 875 in mouse and 1,180 in humans, linear mixed model. (G) Bivariate plot of volume and MCI for healthy human controls (blue) and mice (orange). Each point represents a single mitochondrion.
Figure 3.
Figure 3.. Natural Variation in Mitochondrial Volume and Complexity in Healthy Human Skeletal Muscle
(A) Population distribution of mitochondrial volume and MCI in control human muscle shown as cumulative frequency distributions for SS and IMF mitochondria. Insets: mean values ± SEM; n = 346 for SS and 1,180 for IMF, linear mixed model. (Right) Representative 3D reconstructions of mitochondrial subpopulations. (B) Example 3D reconstructions of two muscle cells from the same person (Control 1). (C and D) Cumulative population distributions of mitochondrial volume (C) and MCI (D) in three muscle fibers from Control 1, and (inset) with means ± SEM for each cell. Each line represents 50 IMF mitochondria from a single muscle cell. (E) Example 3D reconstructions from muscle fibers from two different individuals (Controls 1 and 2) illustrating between-person (i.e., inter-individual) differences. (F and G) Cumulative frequency distribution demonstrating between-person variation in volume (F) and MCI (G) in 8 healthy individuals. Each line represents 150 IMF mitochondria sampled across 3 muscle fibers for each person. (H and I) Coefficient of variation (C.V.) for volume (H) and MCI (I) in healthy controls(C) and patients (P). C.V. values are shown between mitochondria within single cells (n = 18–24 cells), between the mean values across fibers (n = 6–8 individuals), and between-person across healthy control and mito disease groups(n = total of 1,180 and 900 IMF mitochondria in controls and patients, respectively). Data shown are mean ± SEM. (J) Karyotype-like arrangement of 50 individual reconstructed IMF mitochondria from a single muscle fiber of patient 5 (asymptomatic sister with m.8344A>G), from the lowest to the highest MCI (left to right). See Figure S4 for larger version and Video S3 for an animation of the source muscle fiber.
Figure 4.
Figure 4.. IMF Mitochondrial Volume and MCI in Patients with mtDNA Disease
(A) Cumulative frequency distribution for MCI in combined healthy controls and patients. Each line in the patients represents 150 IMF mitochondria across 3 muscle fibers. Inset shows mean ± SEM for each person. Controls (n = 8) combined n = 1180 mitochondria. (B) Schematic illustrating “simple” and “complex” mitochondria defined as the 10th and 90th percentile of the control population distribution, respectively (shaded yellow regions). (C) Proportion of IMF mitochondria with MCI values that fall below the 10th (simple) or above the 90th (complex) percentiles of the control population for healthy controls (black) and patients 1–6 with mitochondrial disease. (D) Bivariate plot of MCI and volume for all healthy control IMF mitochondria (blue, n = 1,180) and mitochondrial disease (green, n = 900). Each data point represents a mitochondrion. Dotted lines denote the 10th and 90th percentiles of the control population. Simple mitochondria include 10% of mitochondria in the healthy controls and 46% in patients (blue shading). Large mitochondria include 10% of mitochondria in controls and 14% in patients (orange shading). (E) Mitochondrial volume density calculated as the proportion of muscle volume occupied by mitochondria. n = 8 controls and 6 patients, Mann-Whitney test, N.S. Data shown are mean ± SEM. (F) Mitochondrial branching index (MBI = Cross sectional ranching indicator/Longitudinal branching indicator) in combined controls (n = 973 IMF mitochondria), patients (n = 896) and mice (n = 839). Note that the number of mitochondria that are more branched cross sectionally (red) is greater than those more branched longitudinally (purple) in all three groups. Image stacks with imperfect orientation precluded reliable analyses of branching orientation for some mitochondria, which were excluded, explaining the lower total number of mitochondria quantified here.
Figure 5.
Figure 5.. Variability in Mitochondrial Morphology in Three Family Members with Variable Levels of the m.8344A>G Mutation
(A) Pedigree of three related female patients. Patient 3 (orange): the proband with 97% heteroplasmy, 97% COX-deficient muscle fibers, and severe myopathy and exercise intolerance; patient 4 (blue): the affected mother with 63% heteroplasmy, 22% COX-deficient muscle fibers, and mild myopathy; and patient 5 (green): the unaffected sister with 40% heteroplasmy and some intermediate COX-deficient fibers. The sisters are of comparable age but have inherited different levels of mtDNA mutation. (B-D) Single representative section from SBF-SEM and reconstruction of 50 IMF mitochondria in muscle fibers for of patients 4 (B), 3 (C), and 5 (D). Note the small fragmented morphology in the proband and mother (B and C) and a high number of branched mitochondria in the unaffected sister, who has intermediate mtDNA mutation load (D). Scale bars, 1 μm. (E) Proportion of simple and complex IMF mitochondria (based on the 10th and 90th percentiles of the MCI distributions in healthy controls) for patients 3, 4, and 5 compared to the healthy individuals. ND, no detectable complex mitochondria. (F) Bivariate plot of MCI and mitochondrial volume in the three individuals with the m.8344A>G mutation. Shaded areas illustrate the mitochondrial population distribution for each patient. Each data point is a mitochondrion (n = 150 per individual).
Figure 6.
Figure 6.. Prevalence and Anatomy of Mitochondrial Nanotunnels in Human Skeletal Muscle
(A) Transmission Electron Microscopy of skeletal muscle from patient 5, with mitochondria harboring nanotunnels (pseudocolored blue). Arrows indicate nanotunnel shafts. (B and C) Image stack from SBF-SEM (B) and three-dimensional reconstruction (C) of a mitochondrion with two nanotunnels (arrows). Slice thickness is 30 nm. (D) Frequency of nanotunnels per 100 mitochondria in healthy controls and individuals with mtDNA disease. All controls (n = 8) were compared to all patients (n = 6), n = 399 nanotunnels, Mann-Whitney. (E and F) A mitochondrion with two nanotunnels reconstructed in Microscopy Image Browser (E) and schematic illustrating the measurements of nanotunnel anatomy obtained from 3D reconstructions (F). The internal diameter is derived from the external diameter (see I). (G and H) Frequency distribution of nanotunnel length (G) and diameter (H) as assessed from reconstructions measured in Amira (n = 362). Distributions are positively skewed. (I) Frequency distribution of minimum estimated lumen diameter for each nanotunnel measured by subtracting distances for the combined thickness of the intermembrane space, OMM, and IMM from the measured external diameter. The red dotted line indicates the estimated dimension of mtDNA nucleoids (based on bovine heart high-resolution imaging; Kukat et al., 2011). Inset: proportion of mitochondrial nanotunnels whose lumens are >110 nm, indicating the theoretical proportion of nanotunnels that could potentially house or transport nucleoids (right of red dashed line). Estimates based on n = 362 nanotunnels.
Figure 7.
Figure 7.. Multivariate Analysis Mitochondrial Morphological Signatures among mtDNA Disease and Healthy Controls
(A) Partial least-squares discriminant analysis (PLS-DA) on mtDNA disease patients (n = 6) and healthy controls (n = 8) with 95% confidence intervals (shaded areas). The 2-component model illustrated explains 46% of the variance in the dataset and produces partial group separation. (B) Variable importance in projection (VIP) scores illustrating the contribution of different morphological features to the separation of healthy controls and patients in the PLS-DA model. Parameters with scores above 1 (red dotted line) are considered significant. Morphological features with higher values in mitochondrial disease are in green, those higher in healthy controls are in blue. Support vector machine (SVM) yielded similar results (not shown). (C) Bi-variate plot of the top two parameters, nanotunnels per 100 mitochondria and the proportion of simple mitochondria. Collectively, in this limited sample, this combination of measures represents a signature sufficient to accurately distinguish healthy controls (blue) and patients with mtDNA disease (green).

References

    1. Bakeeva LE, Chentsov YuS, and Skulachev VP (1978). Mitochondrial framework (reticulum mitochondriale) in rat diaphragm muscle. Biochim. Bio-phys. Acta 501, 349–369. - PubMed
    1. Belevich I, Joensuu M, Kumar D, Vihinen H, and Jokitalo E (2016). Microscopy image browser: A platform for segmentation and analysis of multidimensional datasets. PLoS Biol. 14, e1002340. - PMC - PubMed
    1. Ben-Hur A, Ong CS, Sonnenburg S, Scholkopf B, and Ratsch G (2008). Support vector machines and kernels for computational biology. PLoS Comput. Biol 4,e1000173. - PMC - PubMed
    1. Bleck CKE, Kim Y, Willingham TB, and Glancy B (2018). Subcellular connectomic analyses of energy networks in striated muscle. Nat. Commun 9, 5111. - PMC - PubMed
    1. Bua E, Johnson J, Herbst A, Delong B, McKenzie D, Salamat S, and Aiken JM (2006). Mitochondrial DNA-deletion mutations accumulate intracellularly to detrimental levels in aged human skeletal muscle fibers. Am. J. Hum. Genet 79, 469–80. - PMC - PubMed

Publication types

Substances