. 2019 Mar 4;218(3):895-908.
doi: 10.1083/jcb.201806058. Epub 2019 Jan 17.

Myosin IIB assembly state determines its mechanosensitive dynamics

Affiliations

Myosin IIB assembly state determines its mechanosensitive dynamics

Eric S Schiffhauer et al. J Cell Biol. .

Abstract

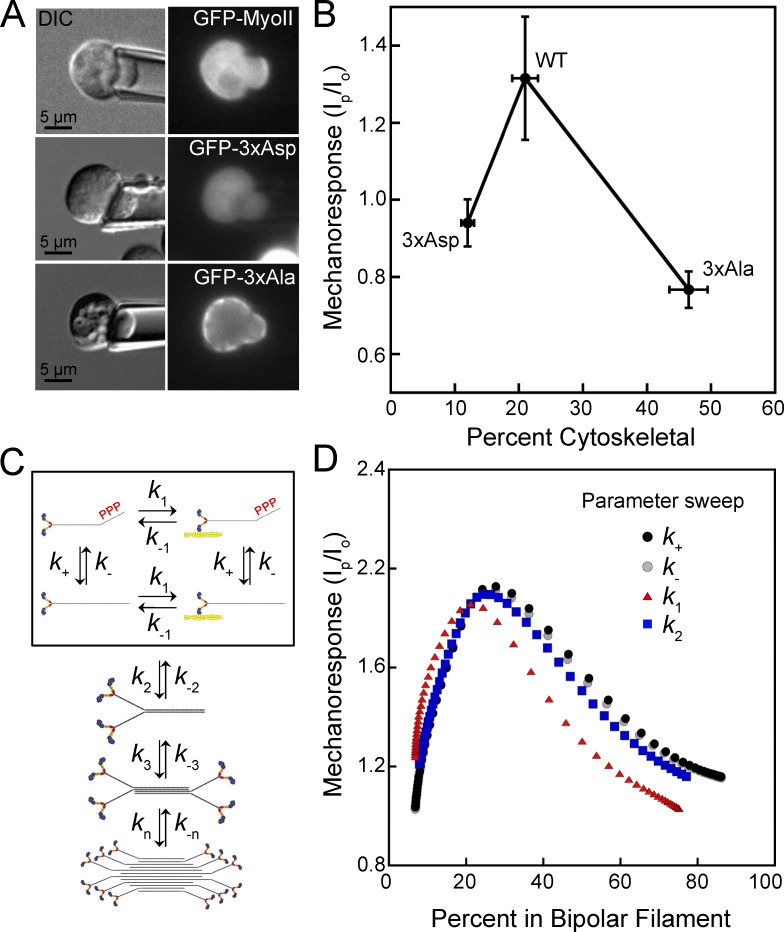
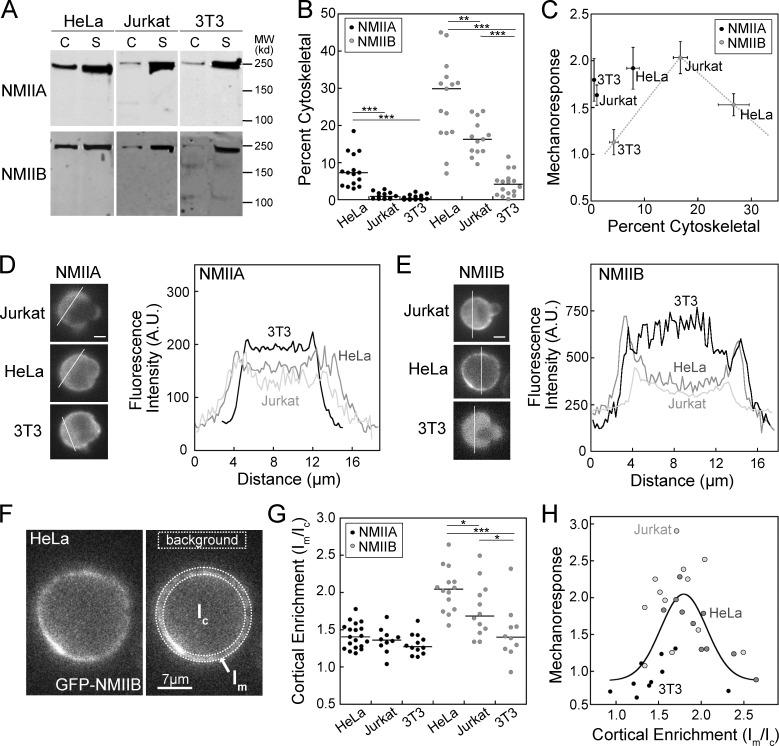
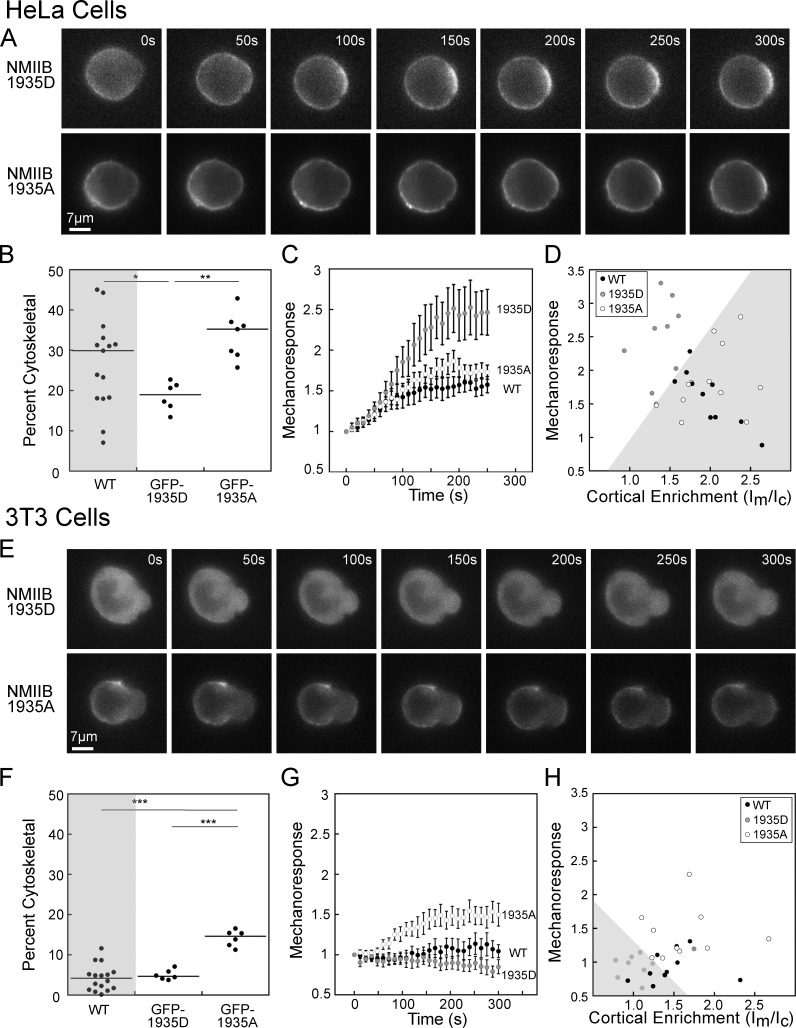
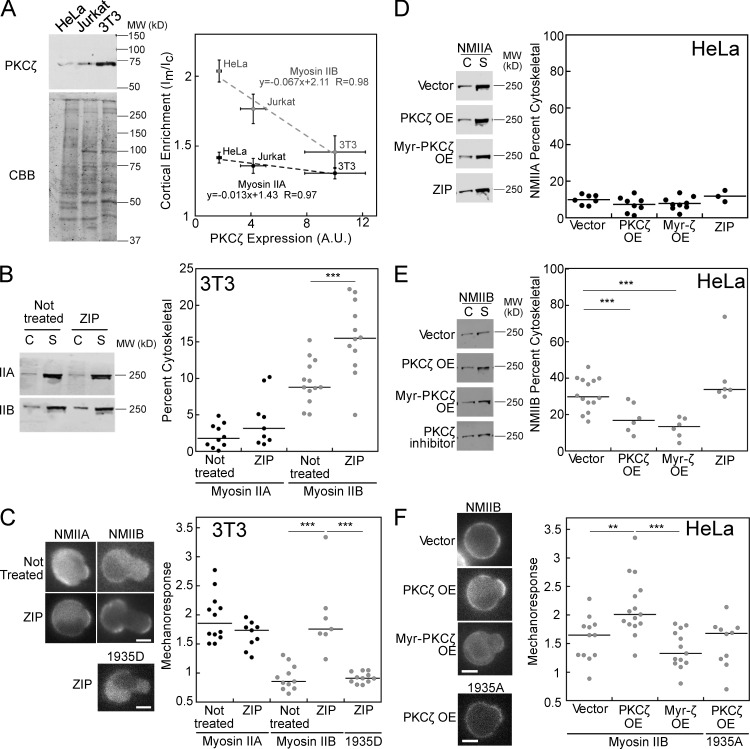
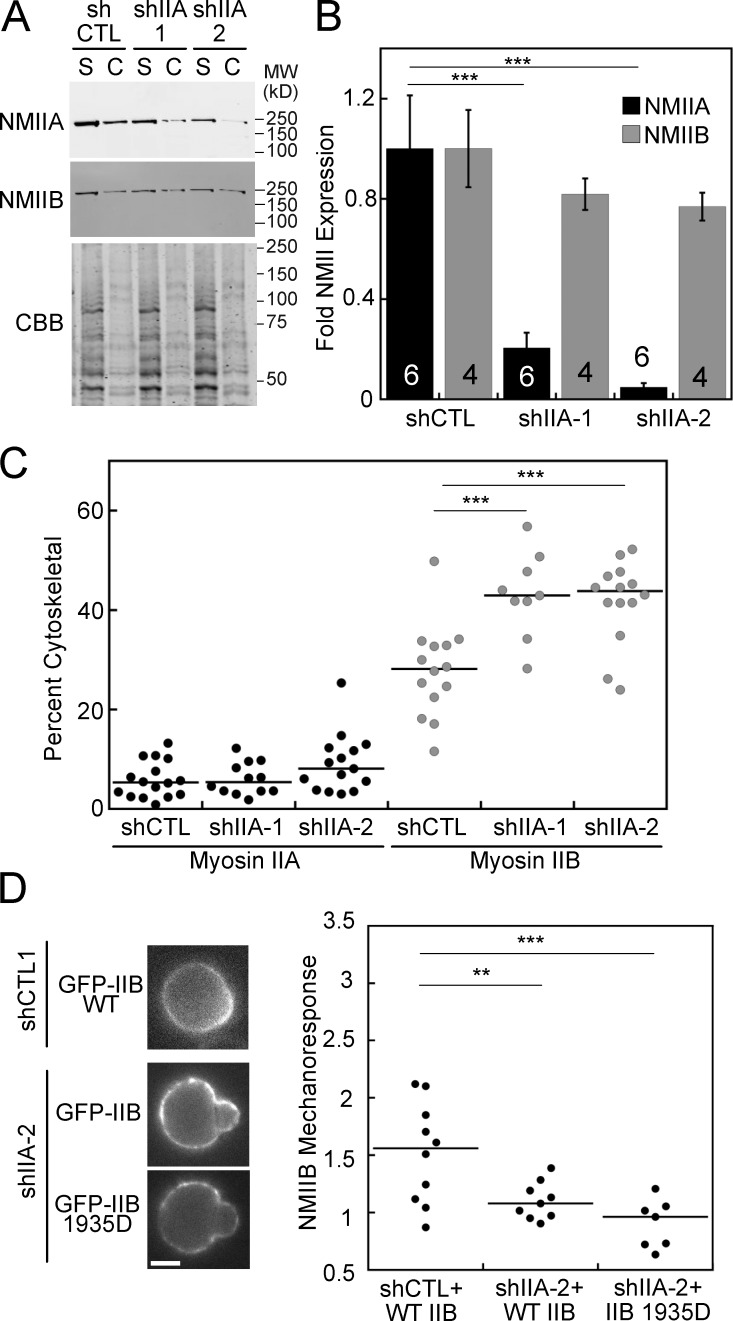
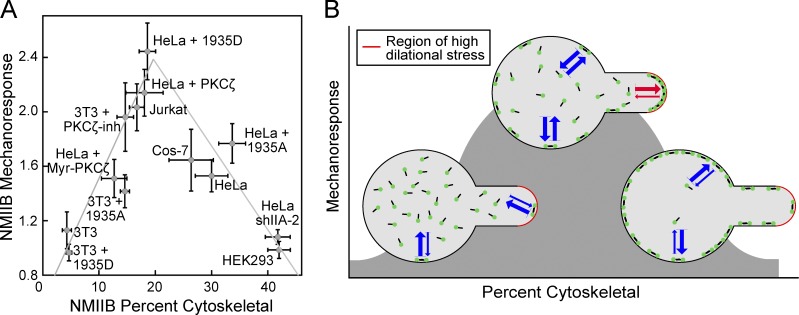
Dynamical cell shape changes require a highly sensitive cellular system that can respond to chemical and mechanical inputs. Myosin IIs are key players in the cell's ability to react to mechanical inputs, demonstrating an ability to accumulate in response to applied stress. Here, we show that inputs that influence the ability of myosin II to assemble into filaments impact the ability of myosin to respond to stress in a predictable manner. Using mathematical modeling for Dictyostelium myosin II, we predict that myosin II mechanoresponsiveness will be biphasic with an optimum established by the percentage of myosin II assembled into bipolar filaments. In HeLa and NIH 3T3 cells, heavy chain phosphorylation of NMIIB by PKCζ, as well as expression of NMIIA, can control the ability of NMIIB to mechanorespond by influencing its assembly state. These data demonstrate that multiple inputs to the myosin II assembly state integrate at the level of myosin II to govern the cellular response to mechanical inputs.


Figures

Figure 1.
Figure 1.
Myosin II cytoskeletal association and mechanoresponsiveness have a biphasic relationship in Dictyostelium. (A) GFP-MyoII accumulates to the region of the cell dilated by the pipette upon applied force. Mutant myosin II proteins mimicking heavy chain phosphorylation (GFP–3× Asp) or nonphosphorylatable mutants (GFP–3× Ala) do not respond to the applied force. (B) Mechanoresponsiveness suggests a biphasic dependency on the percentage of myosin that is cytoskeleton-associated. Peak myosin II mechanoresponse is calculated as the highest ratio of background-subtracted intensity in the pipette (Ip) to the background-subtracted intensity at the cortex at the opposite side of the cell (Io) in 5 min. Mechanoresponse values (y axis values) reproduced from Ren et al. (2009). Percent cytoskeletal is measured by cytoskeletal fraction and reproduced from Rai and Egelhoff (2011) with permission from the authors (x axis values). (C) Scheme to model the assembly of myosin II bipolar filaments, including exchange between assembly-incompetent, assembly-competent, actin-bound, and actin-unbound monomers (boxed). Monomers then assemble into dimers, tetramers, and bipolar filaments. (D) A computational model for myosin II mechanosensitive assembly predicts that when increased or decreased by an order of magnitude, rates affecting myosin II transition from assembly-incompetent to assembly-competent (k+ and k-), from actin unbound to actin bound (k1), or from monomer to dimer (k2) will reproduce a biphasic relationship between the percent of myosin II assembled and the mechanoresponse at 5 min.
Figure 2.
Figure 2.
Myosin IIB cytoskeletal association predicts mechanoresponsiveness in mammalian cells in a biphasic manner. (A and B) Representative cytoskeletal assembly assay Western blots (A) show cytoskeletal (C) versus soluble (S) fractions, quantified in B, which shows median cytoskeletal association <10% for NMIIA and highly divergent median cytoskeletal association for NMIIB in HeLa, Jurkat, and NIH 3T3 cells. Each dot represents one fractionation tube, each experiment was performed over at least three separate days. (C) Plotting peak mechanoresponse (Ip/Io) against percent cytoskeletal (from B) shows that NMIIB mechanoresponse is optimal in Jurkat cells, which have moderate cytoskeletal association among the three cell types. NMIIA shows no such relationship. Mechanoresponse values (y axis) were reproduced from Schiffhauer et al. (2016). (D and E) Representative intensity line scans of GFP-NMIIA (D) or GFP-NMIIB (E) at the initial frame of an MPA experiment demonstrate low initial cortical enrichment in three cell types for GFP-NMIIA, but divergent cortical enrichment for the three cell types for GFP-NMIIB. A.U., arbitrary units. (F) Representation of the quantification of cortical enrichment by comparing background-subtracted mean intensity in the membrane region (Im) to that of the cytosolic region (Ic). (G) Quantification of cortical enrichment (Im/Ic) in three cell types show no significant differences for GFP-NMIIA, but differences in GFP-NMIIB highly similar to the differences in B. Each dot represents one cell; each experiment was performed over at least two separate days. (H) Plotting each cell’s peak mechanoresponse (Ip/Io) as a function of its initial cortical enrichment value (Im/Ic) shows a biphasic distribution similar to a Gaussian function. Mechanoresponse values (y axis) were reproduced from Schiffhauer et al. (2016). *, P < 0.05; **, P < 0.005; ***, P < 0.0005. Bars, 7 µm.
Figure 3.
Figure 3.
Myosin IIB heavy chain phosphomimetic and nonphosphorylatable mutants change cytoskeletal association and mechanoresponsiveness. (A) Representative time series for MPA of HeLa cells expressing GFP-tagged phosphomimetic (NMIIB 1935D) or nonphosphorylatable (NMIIB 1935A) mutants of NMIIB. (B) Quantification of cytoskeletal assembly of NMIIB in HeLa cells reveals a significant reduction in percent cytoskeletal for the 1935D mutant, but not for the 1935A mutant, compared with endogenous NMIIB (WT data reproduced from Fig. 2). (C) Accumulation during MPA over 250 s shows much more robust response for the 1935D mutant (n = 9) compared with the 1935A mutant (n = 12) or WT NMIIB (n = 10). (D) Plotting peak mechanoresponse and initial cortical enrichment (Im/Ic) for each cell shows that all cells expressing the 1935A mutant are found in the lower right region of the graph (gray shaded region), while all cells expressing the 1935D mutant are found in the upper left region of the graph (unshaded region). (E) Representative time series for MPA of NIH 3T3 cells expressing GFP-tagged phosphomimetic (NMIIB 1935D) or nonphosphorylatable (NMIIB 1935A) mutants of NMIIB. (F) Quantification of cytoskeletal assembly of NMIIB in NIH 3T3 cells shows a highly significant enhancement in percent cytoskeletal for the 1935A mutant, but no significant change for the 1935D mutant compared with endogenous NMIIB (WT data reproduced from Fig. 2). (G) Accumulation during MPA over 250 s shows mechanoresponse for the 1935A mutant (n = 10), while no significant accumulation is seen for the 1935D mutant (n = 9) or WT NMIIB (n = 10). (H) Plotting peak mechanoresponse and initial cortical enrichment (Im/Ic) for each cell shows that all cells expressing the 1935D mutant are found in the lower right region of the graph (gray shaded region), while all cells expressing the 1935A mutant are found in the upper right region of the graph (unshaded region). Mechanoresponse kinetic data for WT NMIIB in HeLa (C) and NIH 3T3 (G) cells reproduced from Schiffhauer et al. (2016). For percent cytoskeletal measurements, each dot represents one fractionation tube, and each condition was assessed over at least three separate days. For mechanoresponse, each dot represents one cell, each condition was assessed over at least two separate days. Error bars are SEM. *, P < 0.05; **, P < 0.005; ***, P < 0.0005.
Figure 4.
Figure 4.
PKCζ expression and activity alters NMIIB cytoskeletal association and mechanoresponse. (A) PKCζ expression (n = 3) anti-correlates with NMII cortical enrichment, with fivefold steeper slope for NMIIB than NMIIA. A.U., arbitrary units. (B) PKCζ inhibition increases NMIIB cytoskeletal association and does not change NMIIA association in 3T3 cells, as measured by cytoskeletal (C) versus soluble (S) fractions. (C) Inhibition of PKCζ increases NMIIB mechanoresponse, but does not change NMIIA mechanoresponse and does not affect the NMIIB 1935D mutant in 3T3 cells. (D) Overexpression of PKCζ, constitutively active Myristoylated-PKCζ, or treatment with PKCζ inhibitor does not change NMIIA cytoskeletal association. (E) However, overexpression of PKCζ and Myr-PKCζ reduces the cytoskeletal association of NMIIB in HeLa cells, while PKCζ inhibitor has no effect. (F) PKCζ overexpression improves mechanoresponse in a manner dependent on the 1935S residue, while Myr-PKCζ overexpression shows no change in mechanoresponse in HeLa cells. For percent cytoskeletal measurements, each dot represents one fractionation tube, and each condition was assessed over at least three separate days. For mechanoresponse, each dot represents one cell and each condition was assessed over at least two separate days. Error bars are SEM; **, P < 0.005; ***, P < 0.0005. OE, overexpression. Bars, 7 µm.
Figure 5.
Figure 5.
NMIIA effects NMIIB cytoskeletal association and mechanoresponse. (A and B) NMIIA expression is significantly reduced in two HeLa shRNA NMIIA knockdown lines, while NMIIB expression does not significantly change. (A and C) In the two shRNA NMIIA knockdown lines, NMIIB cytoskeletal association is increased, while the association of the remaining NMIIA does not change, as measured by cytoskeletal (C) and soluble (S) fractions. (D) GFP-NMIIB mechanoresponse is lost in the shIIA-2 knockdown line and is not rescued by the NMIIB 1935D mutant. n values displayed on bars; error bars are SEM. **, P < 0.005; ***, P < 0.0005. Bar, 7 µm.
Figure 6.
Figure 6.
Relationship between NMIIB mechanoresponsiveness and cytoskeletal association is biphasic. (A) The fraction of NMIIB found in the cytoskeleton predicts NMIIB in a biphasic manner across many mammalian cell lines and conditions. (B) Graphical depiction of the relationship between cytoskeletal association and mechanoresponsiveness. If the NMIIB (green dots) balance is shifted to low fraction of assembly and a low level of cytoskeletal association, then the system is impaired in its ability to sense mechanical stress and then locally assemble new filaments, yielding a poor mechanoresponse. At the other extreme, if the NMIIB balance is shifted to have a high fraction of filament assembly and high level of cortical association, then similarly the NMIIB cannot mount a mechanoresponse. In between these extremes, when the appropriate free pool and level of cortical association of NMIIB is maintained, the system is poised to mount the maximal mechanoresponse. Error bars are SEM. Blue arrows represent on and off rates of NMIIB between the cytoplasm and the cortex. Red arrows represent these altered rates under localized mechanical stress.

Similar articles

Cited by

References

    1. Beach J.R., Shao L., Remmert K., Li D., Betzig E., and Hammer J.A. III. 2014. Nonmuscle myosin II isoforms coassemble in living cells. Curr. Biol. 24:1160–1166. 10.1016/j.cub.2014.03.071 - DOI - PMC - PubMed
    1. Billington N., Wang A., Mao J., Adelstein R.S., and Sellers J.R.. 2013. Characterization of three full-length human nonmuscle myosin II paralogs. J. Biol. Chem. 288:33398–33410. 10.1074/jbc.M113.499848 - DOI - PMC - PubMed
    1. De la Roche M.A., Smith J.L., Betapudi V., Egelhoff T.T., and Côté G.P.. 2002. Signaling pathways regulating Dictyostelium myosin II. J. Muscle Res. Cell Motil. 23:703–718. 10.1023/A:1024467426244 - DOI - PubMed
    1. Dulyaninova N.G., and Bresnick A.R.. 2013. The heavy chain has its day: regulation of myosin-II assembly. Bioarchitecture. 3:77–85. 10.4161/bioa.26133 - DOI - PMC - PubMed
    1. Dulyaninova N.G., Malashkevich V.N., Almo S.C., and Bresnick A.R.. 2005. Regulation of myosin-IIA assembly and Mts1 binding by heavy chain phosphorylation. Biochemistry. 44:6867–6876. 10.1021/bi0500776 - DOI - PubMed

Publication types