. 2019 May;17(5):1195-1206.
doi: 10.1158/1541-7786.MCR-18-0048. Epub 2019 Jan 17.

Desmoglein 1 Regulates Invadopodia by Suppressing EGFR/Erk Signaling in an Erbin-Dependent Manner

Affiliations

Desmoglein 1 Regulates Invadopodia by Suppressing EGFR/Erk Signaling in an Erbin-Dependent Manner

Alejandra Valenzuela-Iglesias et al. Mol Cancer Res. 2019 May.

Abstract

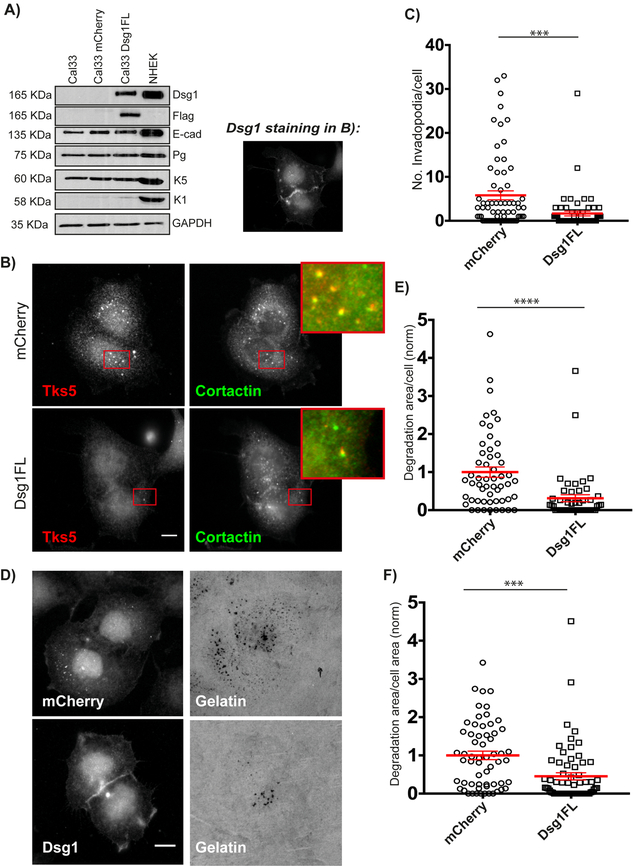
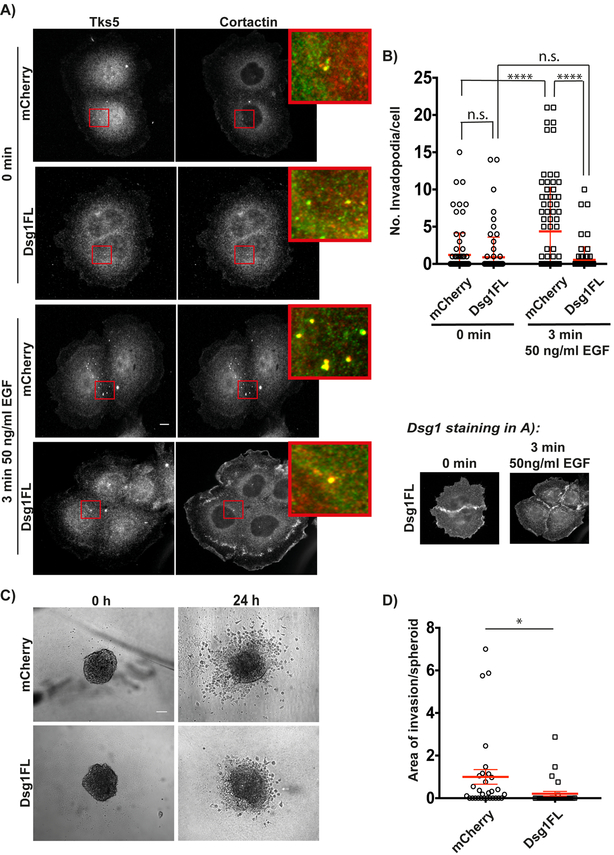
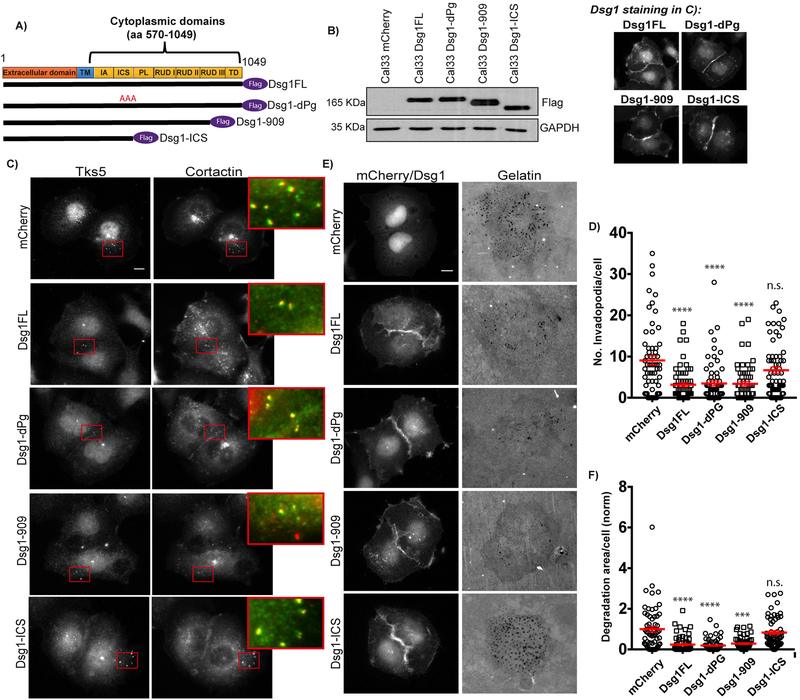
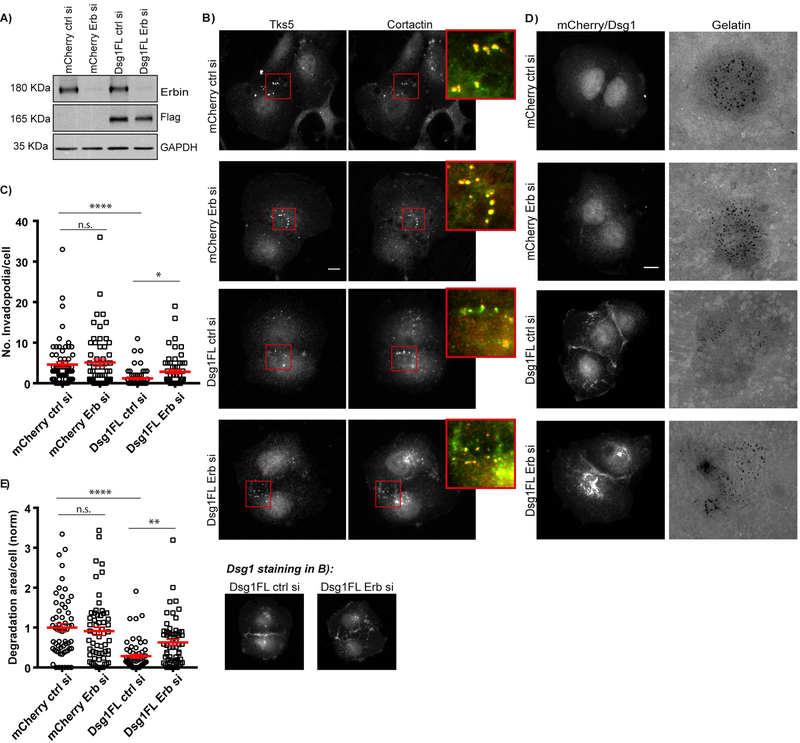
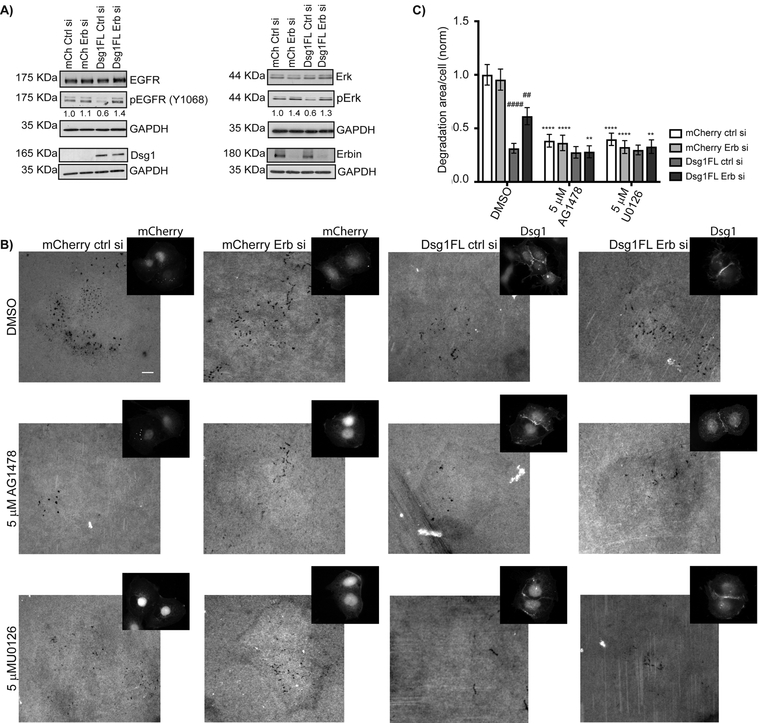
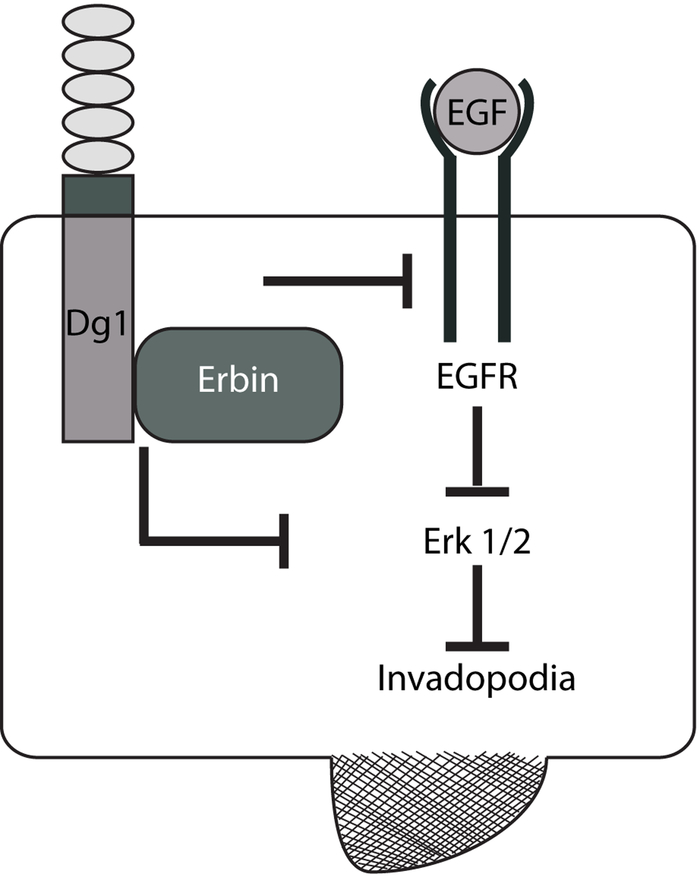
Loss of the desmosomal cell-cell adhesion molecule, Desmoglein 1 (Dsg1), has been reported as an indicator of poor prognosis in head and neck squamous cell carcinomas (HNSCC) overexpressing epidermal growth factor receptor (EGFR). It has been well established that EGFR signaling promotes the formation of invadopodia, actin-based protrusions formed by cancer cells to facilitate invasion and metastasis, by activating pathways leading to actin polymerization and ultimately matrix degradation. We previously showed that Dsg1 downregulates EGFR/Erk signaling by interacting with the ErbB2-binding protein Erbin (ErbB2 Interacting Protein) to promote keratinocyte differentiation. Here, we provide evidence that restoring Dsg1 expression in cells derived from HNSCC suppresses invasion by decreasing the number of invadopodia and matrix degradation. Moreover, Dsg1 requires Erbin to downregulate EGFR/Erk signaling and to fully suppress invadopodia formation. Our findings indicate a novel role for Dsg1 in the regulation of invadopodia signaling and provide potential new targets for development of therapies to prevent invadopodia formation and therefore cancer invasion and metastasis. IMPLICATIONS: Our work exposes a new pathway by which a desmosomal cadherin called Dsg1, which is lost early in head and neck cancer progression, suppresses cancer cell invadopodia formation by scaffolding ErbB2 Interacting Protein and consequent attenuation of EGF/Erk signaling.


Conflict of interest statement

The authors declare no potential conflicts of interest.

Figures

Figure 1.
Figure 1.. Desmoglein 1 regulates invadopodia formation and function.
A) Western blot of whole cell lysates from Cal33, Cal33-mCherry, Cal33-Dsg1FL and NHEK cells probed for Dsg1, Flag, E-cadherin (E-cad), Plakoglobin (Pg), Keratin 5 (K5), Keratin 1 (K1), and GAPDH (NHEK was used for comparison). B) Cal33-mCherry and Cal33-Dsg1FL cells stained for invadopodia markers, Tks5 and cortactin. Inset shows magnified image of invadopodia in red box. Smaller image shows Dsg1 staining in Dsg1FL cells. C) Quantification of the number of invadopodia per cell. n>400 invadopodia from >100 cells; three independent experiments. Unpaired student’s t-test with Welch’s correction. ***p=0.0005. Error bars indicate SEM. D) Cal33-mCherry and Cal33-Dsg1FL cells after overnight plating on 488-labeled gelatin. E) Quantification of invadopodial matrix degradation area per cell normalized to control. Normalization of data was done by dividing each area of degradation by the mean degradation area of mCherry expressing cells. n>100 cells; three independent experiments. Unpaired student’s t-test with Welch’s correction. ****p<0.0001. Error bars indicate SEM. F) Quantification of degradation area per cell area normalized to mCherry expressing cells. n>100 cells; three independent experiments. Unpaired student’s t-test with Welch’s correction. ***p=0.0003. Error bars indicate SEM. Scale bars equal 10 μm.
Figure 2.
Figure 2.. Desmoglein 1 suppresses EGF-induced invadopodium precursors and 3D invasion.
A) Cal33-mCherry and Cal33-Dsg1FL cells stained for invadopodia markers Tks5 and cortactin at 0 minutes (untreated) and 3 minutes after 50 ng/ml EGF stimulation. Inset shows magnified image of invadopodia in red box. B) Quantification of the number of invadopodia per cell at 0 minutes (untreated) and 3 minutes after EGF stimulation. n>500 invadopodia from >250 cells; three independent experiments. Two-way ANOVA with Sidak’s multiple comparison test. ****p<0.0001. Error bars indicate SEM. C) Phase-contrast images of invasion of Cal33-mCherry and Cal33-Dsg1FL spheroids embedded in rat tail collagen type I (5 mg/ml) at 0 h (untreated) and 24 h after EGF stimulation. D) Quantification of area of invasion per spheroid normalized to control at 24 h after EGF stimulation. n=30 spheroids; three independent experiments. Unpaired Student’s test with Welch’s correction. *p=0.034. Error bars indicate SEM. Scale bars equal 10 μm.
Figure 3.
Figure 3.. Erbin binding domain of Desmoglein 1 is required to regulate invadopodia.
A) Schematic of Dsg1 constructs. B) Western blot of whole cell lysates from Cal33-mCherry, -Dsg1FL, -Dsg1-dPg, -Dsg1–909, and -Dsg1-ICS probed for Flag and GAPDH. C) Cal33-mCherry, -Dsg1FL, -Dsg1-dPg, -Dsg1–909, and -Dsg1-ICS cells stained for invadopodia markers, Tks5 and cortactin. Inset shows magnified image of invadopodia in red box. Smaller images show Dsg1 staining in Dsg1 constructs. D) Quantification of the number of invadopodia per cell. n>1600 invadopodia from n>300 cells; three independent experiments. One-way ANOVA with Dunn’s post hoc test. ****p<0.0001. Error bars indicate SEM. E) Cal33-mCherry, -Dsg1FL, -Dsg1-dPg, -Dsg1–909, and -Dsg1-ICS cells after overnight plating on 488-labeled gelatin. F) Quantification of invadopodial matrix degradation area per cell normalized to control. n>300 cells; three independent experiments. One-way ANOVA with Dunn’s post-hoc test. ****p<0.0001 and ***p=0.0002. Error bars indicate SEM. Scale bars equal 10 μm.
Figure 4.
Figure 4.. Desmoglein 1 mediates invadopodia formation and function through Erbin.
A) Cal33-mCherry and Cal33-Dsg1 FL cells were transfected with control or Erbin siRNA and whole cells lysates were immunoblotted after 72 h of transfection with Erbin, Flag and GAPDH antibodies. B) Cal33-mCherry and Cal33-Dsg1FL cells treated with control or Erbin siRNA and stained for invadopodia markers, Tks5 and cortactin. Inset shows magnified image of invadopodia in red box. Smaller images show Dsg1 staining in Dsg1 expressing cells. C) Quantification of the number of invadopodia per cell. n>800 invadopodia from n>200 cells; three independent experiments. One-way ANOVA with Dunns’s multiple comparisons test. ****p<0.0001 and *p=0.0319. Error bars indicate SEM. D) Cal33-mCherry and Cal33-Dsg1FL cells treated with control or Erbin siRNA and plated on 488-labeled gelatin overnight. E) Quantification of invadopodial matrix degradation per cell normalized to control. n>200 cells; three independent experiments. One-way ANOVA with Dunns’s multiple comparison test. ****p<0.0001 and **p<0.01. Error bars indicate SEM. Scale bars equal 10 μm.
Figure 5.
Figure 5.. Desmoglein 1 attenuates invadopodia signaling in an Erbin-dependent manner.
A) Cal33-mCherry and Cal33-Dsg1FL cells were transfected with control or Erbin siRNA and whole cells lysates were immunoblotted after 72 h of transfection with EGFR, pEGFR (Y1068), Erk, pErk (p44/42), Erbin, Flag, and GAPDH antibodies. For quantification of phosphorylated proteins, each band was normalized to the amount of total protein. Three independent experiments. B) Cal33-mCherry and Cal33-Dsg1FL cells treated with control or Erbin siRNA plus vehicle (DMSO), EGFR (5 μM AG1478), and Erk (5 μM U0126) inhibitors and plated on 488-labeled gelatin for 6 h. Smaller images show mCherry IF and Dsg1 staining. Scale bars equal 10 μm. C) Quantification of invadopodial matrix degradation per cell. n>700 cells; three independent experiments. Two-way ANOVA with Dunn’s post-hoc test. Analysis within groups reveals that only DMSO treatment show significant decreases in Dsg1FL ctrl si and Dsg1FL Erb si as compared to mCherry ctrl si. ####p<0.0001 and ##p=0.032. Analysis across groups reveals significant decreases in degradation area/cell following AG1478 and U0126 drug treatment under all expression conditions except Dsg1FL ctrl si.****p<0.0001 and **p=0.0073. Error bars indicate SEM.
Figure 6.
Figure 6.. Model:
Dsg1 through its interaction with Erbin downregulates invadopodia signaling by dampening EGFR/Erk activation, which ultimately leads to a decrease in invadopodia formation and matrix degradation.

Similar articles

Cited by

References

    1. Marur S, and Forastiere AA. Head and Neck Squamous Cell Carcinoma: Update on Epidemiology, Diagnosis, and Treatment. Mayo Clin. Proc 2016; 91, 386–396. - PubMed
    1. Curry JM, Sprandio J, Cognetti D, Luginbuhl A, Bar-ad V, Pribitkin E, et al. Tumor Microenvironment in Head and Neck Squamous Cell Carcinoma. Semin. Oncol 2014; 41, 217–234. - PubMed
    1. Echarri JM, Lopez-Martin A, and Hitt R. Targeted Therapy in Locally Advanced and Recurrent/Metastatic Head and Neck Squamous Cell Carcinoma (LA-R/M HNSCC). Cancers 2016; 8, 1–22. - PMC - PubMed
    1. Sacco AG, and Worden FP. Molecularly targeted therapy for the treatment of head and neck cancer: a review of the ErbB family inhibitors. OncoTargets. Ther 2016; 9, 1927–1943. - PMC - PubMed
    1. Hartmann S, Bhola NE, and Grandis JR. HGF / Met Signaling in Head and Neck Cancer: Impact on the Tumor Microenvironment. Clin Cancer Res. 2016: 22, 4005–4013. - PMC - PubMed

Publication types

MeSH terms