. 2019 Jan 29;116(5):1501-1510.
doi: 10.1073/pnas.1813476116. Epub 2019 Jan 17.

Adaptive, locally linear models of complex dynamics

Affiliations

Adaptive, locally linear models of complex dynamics

Antonio C Costa et al. Proc Natl Acad Sci U S A. .

Abstract

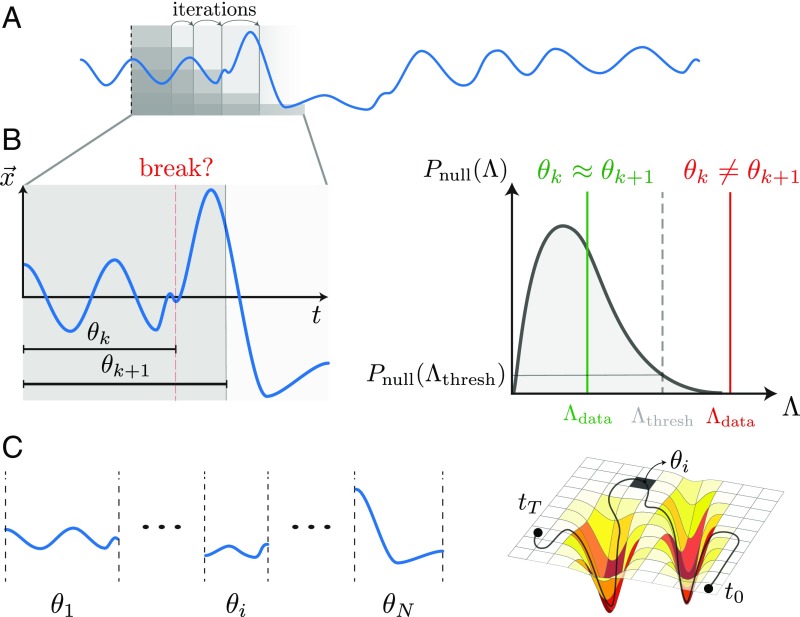
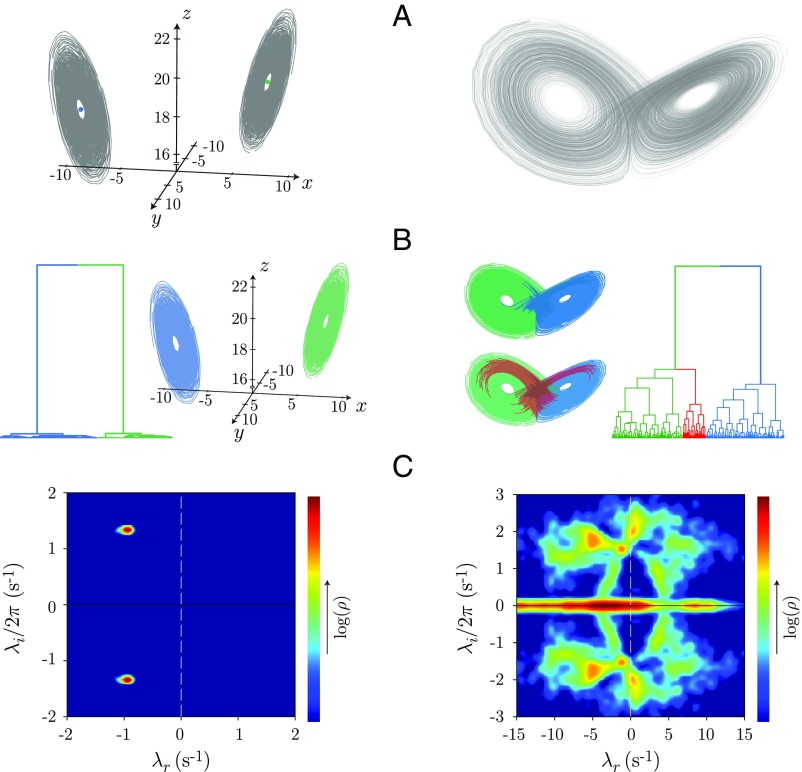
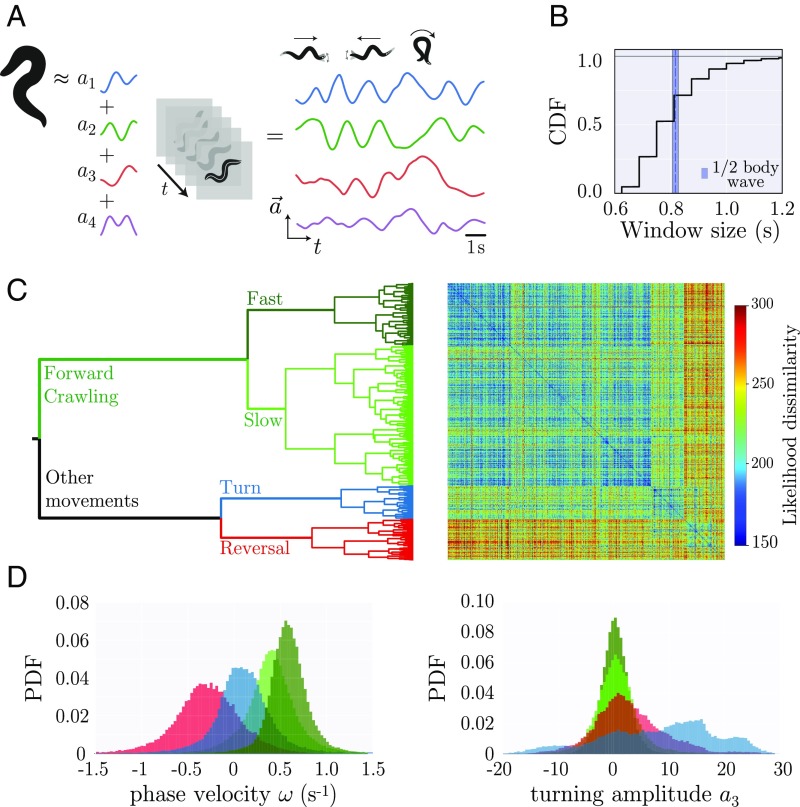
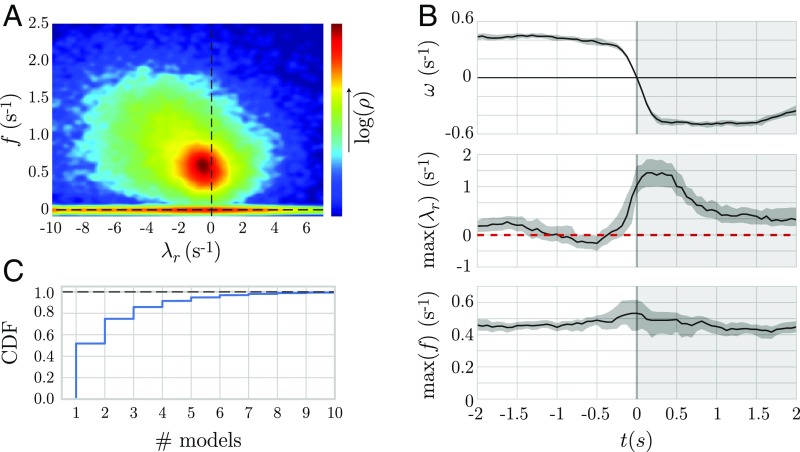
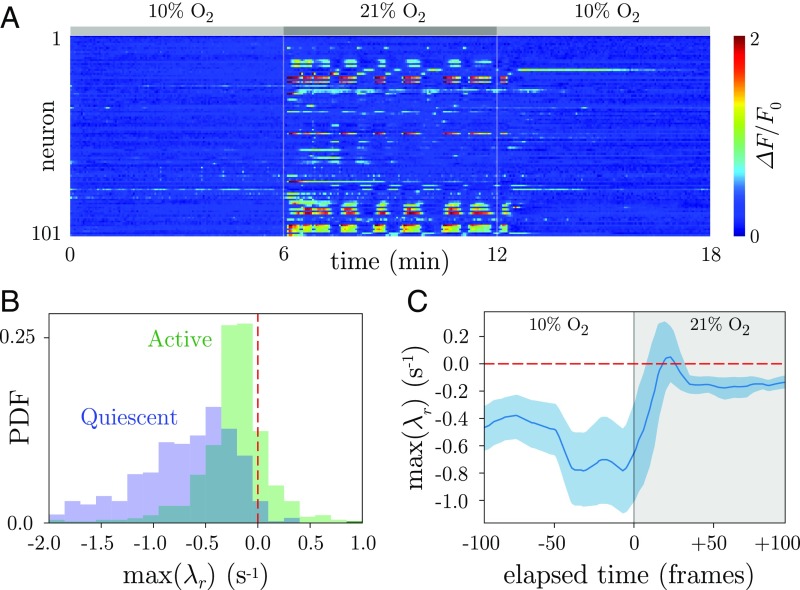
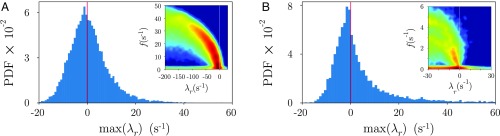
The dynamics of complex systems generally include high-dimensional, nonstationary, and nonlinear behavior, all of which pose fundamental challenges to quantitative understanding. To address these difficulties, we detail an approach based on local linear models within windows determined adaptively from data. While the dynamics within each window are simple, consisting of exponential decay, growth, and oscillations, the collection of local parameters across all windows provides a principled characterization of the full time series. To explore the resulting model space, we develop a likelihood-based hierarchical clustering, and we examine the eigenvalues of the linear dynamics. We demonstrate our analysis with the Lorenz system undergoing stable spiral dynamics and in the standard chaotic regime. Applied to the posture dynamics of the nematode Caenorhabditis elegans, our approach identifies fine-grained behavioral states and model dynamics which fluctuate about an instability boundary, and we detail a bifurcation in a transition from forward to backward crawling. We analyze whole-brain imaging in C. elegans and show that global brain dynamics is damped away from the instability boundary by a decrease in oxygen concentration. We provide additional evidence for such near-critical dynamics from the analysis of electrocorticography in monkey and the imaging of a neural population from mouse visual cortex at single-cell resolution.

Keywords: animal behavior; clustering; dynamical criticality; neural dynamics; time-series segmentation.


Figures

Fig. 1.
Fig. 1.
Schematic of the adaptive, locally linear segmentation algorithm. (A) A d-dimensional time series is depicted as a blue line. We iterate over pairs of subsequent windows and use a likelihood-ratio test to assess whether there is a dynamical break between windows. (B) We compare linear models θk and θk+1, found in the windows Xk and Xk+1, by the log-likelihood ratio Λdata (Eq. 3). To assess significance, we compute the distribution of log-likelihood ratios under the null hypothesis of no model change Pnull(Λ) and identify a dynamical break when Λdata>Λthresh where Pnull(Λthresh)=0.05. If no break is identified, we continue with the windows {θk+1,θk+2}. (C) The result of the segmentation algorithm is a set of windows of varying lengths and model parameters {θ1,,θN}. Our approach is similar to approximating a complex-shaped manifold by a set of locally flat patches and encodes a nonlinear time series through a trajectory within the space of local linear models.
Fig. 2.
Fig. 2.
Adaptive segmentation of the Lorenz dynamical system and likelihood-based clustering of the resulting model space. (A) Simulated Lorenz system for stable spiral dynamics (Left) {ρ=20,β=8/3,σ=10} and the standard chaotic regime (Right) {ρ=28,β=8/3,σ=10}. (B) Likelihood-based hierarchical model clustering. In the spiral dynamics, there is a large separation between models from each lobe, while the dynamics within lobe are very similar. In the chaotic regime, the model-space clustering first divides the two lobes of the attractor, and the full space is intricate and heterogeneous. (C) Dynamical eigenvalue spectrum for each regime, λr and λi, respectively represent the real and imaginary eigenvalues. The spiral dynamics (C, Left) exhibits a pair of stable, complex conjugate peaks, while in the chaotic regime (C, Right), we find a broad distribution of eigenvalues, often unstable, reflecting the complexity of the chaotic attractor.
Fig. 3.
Fig. 3.
Locally linear analysis of C. elegans posture dynamics reveals a rich space of behavioral motifs. (A) We transform image sequences into a 4D posture dynamics using “eigenworm” projections (35), where the first two modes (a1,a2) describe a body wave, with positive phase velocity ω for forward motion and negative ω when the worm reverses. High values of |a3| occur during deep turns, while a4 captures head and tail movements. (B) The cumulative distribution function (CDF) of window sizes reveals rapid posture changes on the timescale of the locomotor wave (the average duration of a half body wave is shown for reference). (C) Likelihood-based hierarchical clustering of the space of linear posture dynamics. At the top of the tree, forward crawling models separate from other behaviors. At the next level, forward crawling splits into fast and slower body waves, while the other behaviors separate into turns and reversals. Hierarchical clustering results in a similarity matrix with weak block structure; while behavior can be organized into broad classes, large variability remains within clusters. (D) Cluster branches reveal interpretable worm behaviors. We show the probability distribution function (PDF) of body-wave phase velocities and turning amplitudes at the fourth-branch level of the tree. In the first forward state (dark green), worms move faster than in the second branch (light green). In the turn branch (blue), the phase velocity is centered around zero, and high values of |a3| indicate larger turning amplitudes. In the reversal branch (red), we find predominantly negative phase velocities.
Fig. 4.
Fig. 4.
Linear posture dynamics in C. elegans is distributed across an instability boundary with spontaneous reversals evident as a bifurcation. (A) The eigenvalues of the segmented posture time series reveal a broad distribution of frequencies f=|Im(λ)|/2π with a peak f0.6s1 that spills into the unstable regime. (B) We align reversal events and plot the maximum real eigenvalue (λr) and the corresponding oscillation frequency. As the reversal begins, the dynamics become unstable, indicating a Hopf-like bifurcation in which a pair of complex conjugate eigenvalues crosses the instability boundary. The shaded region corresponds to a bootstrapped 95% confidence interval. (C) Instabilities are both prevalent and short-lived. We show the cumulative distribution function (CDF) of the number of consecutive stable or unstable models, demonstrating that bifurcations also occur on short times between fine-scale behaviors.
Fig. 5.
Fig. 5.
Quiescence stabilizes global brain dynamics in C. elegans. (A) We analyze whole-brain dynamics from previous experiments in which worms were exposed to varying levels of O2 concentration (52). We show the background-subtracted fluorescence signal ΔF/F0 from 101 neurons, while the O2 concentration changed in 6-min periods: Low O2 (10%) induces a quiescent state; high O2 (21%) induces an active state. (B) We plot the distribution of maximum real eigenvalues (λr) for the active and quiescent states. The active state is associated with substantial unstable dynamics, while the dynamics of the quiescent state is predominately stable, which is consistent with putative stable fixed-point dynamics. PDF, probability distribution function. (C) We plot the average maximum real eigenvalue as the O2 concentration is changed. We align the time series from different worms to the first frame of increased O2 concentration and show the accompanying increase in the maximum real eigenvalue, which crosses and remains near to the instability boundary. The shaded region corresponds to a bootstrapped 95% confidence interval, and curves were smoothed by using a five-frame running average.
Fig. 6.
Fig. 6.
Higher-dimensional applications of the adaptive locally linear model technique: The dynamics exhibit a wide range of frequencies and near-critical behavior. (A) Distribution of the least-stable real eigenvalues from each window of the local-linear models obtained from the analysis of ECoG recordings in nonhuman primates. A, Inset shows the full distribution of eigenvalues—color code is the same as in Fig. 3. (B) Distribution of the least-stable real eigenvalues from each window of the local linear models obtained in recordings of 240 neurons in the visual cortex of Mus musculus. B, Inset shows the full distribution of eigenvalues—color code is the same as in Fig. 3. Here, due to the high-dimensionality, a regularization procedure was added to the original technique (Materials and Methods). PDF, probability distribution function.

References

    1. Arratia PE, Voth GA, Gollub JP. Stretching and mixing of non-Newtonian fluids in time-periodic flows. Phys Fluids. 2005;17:1–10.
    1. Majda AJ, Lee Y. Conceptual dynamical models for turbulence. Proc Natl Acad Sci USA. 2014;111:6548–6553. - PMC - PubMed
    1. Alakent B, Doruker P, Çamurdan MC. Time series analysis of collective motions in proteins. J Chem Phys. 2004;120:1072–1088. - PubMed
    1. Yanagawa T, Chao ZC, Hasegawa N, Fujii N. Large-scale information flow in conscious and unconscious states: An ECoG study in monkeys. PLoS One. 2013;8:1–13. - PMC - PubMed
    1. Li K, Javer A, Keaveny EE, Brown AE. 2017. Recurrent neural networks with interpretable cells predict and classify worm behaviour. bioRxiv:10.1101/222208. Preprint, posted November 20, 2017.

Publication types

LinkOut - more resources