. 2019 Jan 17;10(1):278.
doi: 10.1038/s41467-018-08133-6.

ONECUT2 is a driver of neuroendocrine prostate cancer

Affiliations

ONECUT2 is a driver of neuroendocrine prostate cancer

Haiyang Guo et al. Nat Commun. .

Abstract

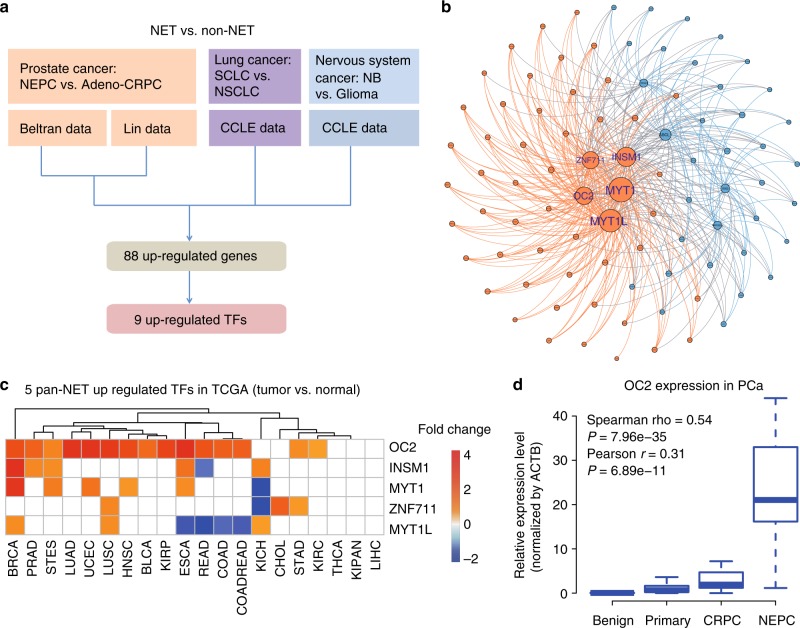
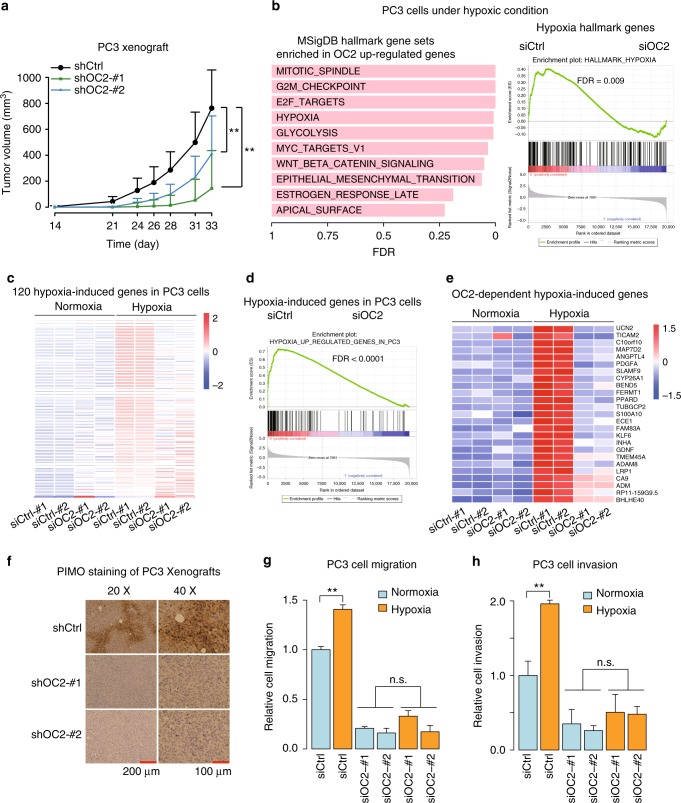
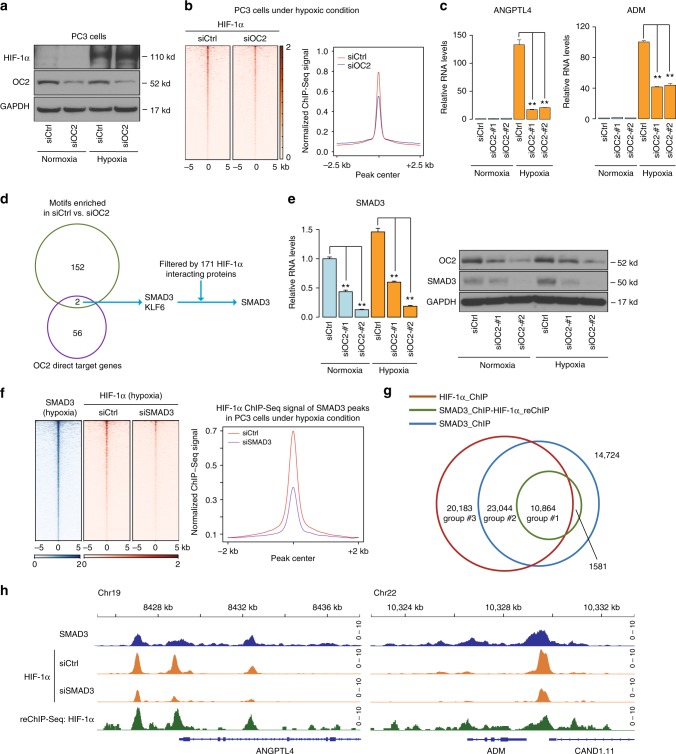
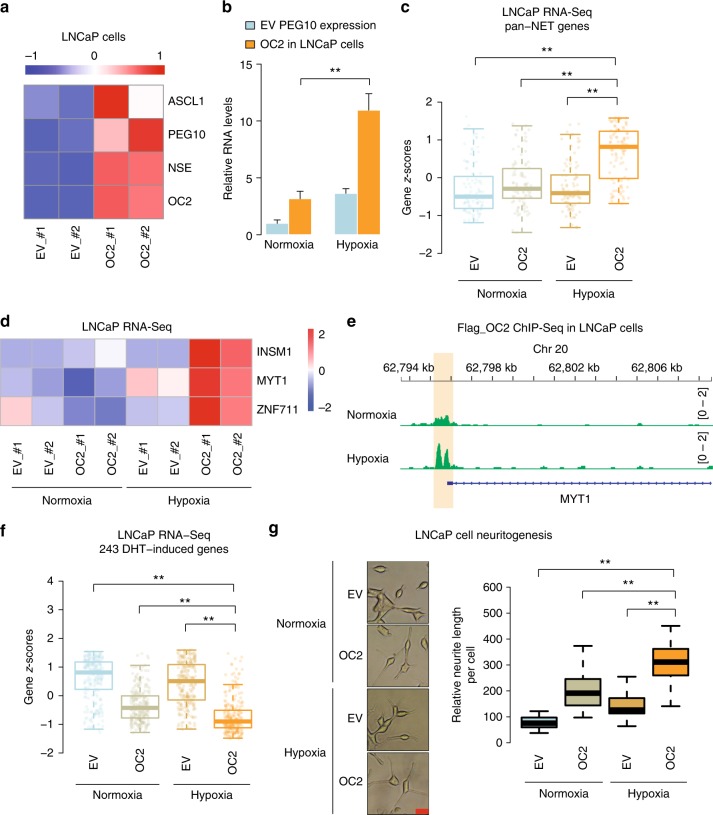
Neuroendocrine prostate cancer (NEPC), a lethal form of the disease, is characterized by loss of androgen receptor (AR) signaling during neuroendocrine transdifferentiation, which results in resistance to AR-targeted therapy. Clinically, genomically and epigenetically, NEPC resembles other types of poorly differentiated neuroendocrine tumors (NETs). Through pan-NET analyses, we identified ONECUT2 as a candidate master transcriptional regulator of poorly differentiated NETs. ONECUT2 ectopic expression in prostate adenocarcinoma synergizes with hypoxia to suppress androgen signaling and induce neuroendocrine plasticity. ONEUCT2 drives tumor aggressiveness in NEPC, partially through regulating hypoxia signaling and tumor hypoxia. Specifically, ONECUT2 activates SMAD3, which regulates hypoxia signaling through modulating HIF1α chromatin-binding, leading NEPC to exhibit higher degrees of hypoxia compared to prostate adenocarcinomas. Treatment with hypoxia-activated prodrug TH-302 potently reduces NEPC tumor growth. Collectively, these results highlight the synergy between ONECUT2 and hypoxia in driving NEPC, and emphasize the potential of hypoxia-directed therapy for NEPC patients.


Conflict of interest statement

The authors declare no competing interests.

Figures

Fig. 1
Fig. 1
Pan-cancer analysis identifies ONECUT2 as a potential master transcriptional regulator of neuroendocrine tumors. a Schematic illustration of pan-NET analysis (see Methods section and Supplementary Figure 1a for details). Ninety-three genes, including nine transcription factors, were commonly upregulated in NETs compared to the non-NET counterparts within the same cancer types. NET neuroendocrine tumor, NEPC neuroendocrine prostate cancer, Adeno-CRPC castration-resistant prostatic adenocarcinoma, SCLC small-cell lung cancer, NSCLC non-small-cell lung cancer (exclusive of large cell lung cancer), NB neuroblastoma, CCLE Cancer Cell Line Encyclopedia. b Network analysis of nine TFs and 79 non-TF genes commonly upregulated in poorly differentiated NETs. These 88 genes were classified into two communities using GEPHI, as labeled by color (orange and cyan). c Dysregulation of the five TFs from the major community from panel b in 20 cancer types from TCGA. log2 transformed fold changes represent difference in expression between tumor and normal tissue. Colored cells indicate significant expression changes (absolute-value of the log2(fold change) > 1 and P < 0.05). The Wilcoxon rank sum test was used to calculate P-values. d ONECUT2 expression in benign prostate tissues and prostate tumors. RNA-Seq data of 52 benign prostate tissues and 333 primary PCa were retrieved from TCGA. RNA-Seq data of 34 adeno-CRPC and 15 NEPC were retrieved from the Beltran dataset. Expression levels as measured by RPKM were normalized by housekeeping gene ACTB
Fig. 2
Fig. 2
ONECUT2 regulates hypoxia signaling in NE-like PC3 cells. a Lentiviral knockdown of ONECUT2 suppresses tumor growth in PC3 xenograft models. n = 9 for shCtrl; n = 10 for shOC2-#1; n = 10 for shOC2-#2. b Left panel: top 10 MSigDB Hallmark Gene Sets enriched in ONECUT2 upregulated genes under hypoxic conditions. Right panel: GSEA enrichment plot for “Hypoxia” gene set. Genes were ranked by fold changes between control and ONECUT2 knockdown samples in descending order. c Heatmap shows relative expression of 120 hypoxia-induced genes (fold change > 2 and P-value < 0.05) in PC3 cells with and without ONECUT2 knockdown under normoxic and hypoxic conditions. d GSEA enrichment plot of hypoxia-induced genes in PC3 cells. Genes were ranked by fold changes between control and ONECUT2 knockdown samples in descending order. e Heatmap shows abundance of ONECUT2-dependent hypoxia-induced genes. f Representative images of Pimonidazole (PIMO) IHC staining of PC3 xenograft tumors with and without silencing of ONECUT2. g, h The capacity of PC3 cell migration and invasion with and without silencing of ONECUT2, under normoxic and hypoxic conditions in PC3 cells. P-values were calculated by mixed-effects models of repeated-measures ANOVA for a, Wilcoxon rank sum test for c and one-way ANOVA for g and h. n.s. not significant; *: P < 0.05; **: P < 0.01. Source data are provided as a Source Data file
Fig. 3
Fig. 3
ONECUT2 modulates HIF1α binding to chromatin in NE-like PC3 cells. a Western blot of HIF1α and ONECUT2 in PC3 cells under normoxic and hypoxic conditions. Two different siRNAs targeting ONECUT2 were mixed together for knockdown experiments. b Left panel: heatmaps show HIF1α ChIP-Seq signal in PC3 cells under hypoxic conditions with and without knockdown of ONECUT2; right panel: pileup of HIF1α ChIP-Seq signals centered at HIF1α ChIP-Seq peaks center. c Expression of ANGPTL4 and ADM, two hypoxia-regulated genes, with and without knockdown of ONECUT2 in PC3 cells. d Schematic illustration of the analysis identifying SMAD3 as an ONECUT2 regulated HIF1α co-factor. Genes identified in motifs enriched in HIF1α binding sites and ONECUT2 target genes were further filtered by HIF1α interacting protein list from BioGRID. ONECUT2 target genes were defined as differentially expressed in ONECUT2 knockdown and control samples and with ONECUT2 binding sites nearby in PC3 cells under hypoxic conditions. e SMAD3 expression in response to ONECUT2 silencing in PC3 cells. f SMAD3 and HIF1α binding sites with and without silencing of SMAD3. g The overlap of SMAD3 ChIP-Seq, HIF1α ChIP-Seq and SMAD3-HIF1α ChIP-re-ChIP-Seq peaks. h SMAD3 ChIP-Seq, HIF1α ChIP-Seq and SMAD3-HIF1α ChIP-re-ChIP-Seq signal near the promoter regions of hypoxia-induced genes ANGPTL4 and ADM. Error bars indicate s.d. from at least two technical replicates. P-value is calculated by one-way ANOVA. **: P < 0.01. Source data are provided as a Source Data file
Fig. 4
Fig. 4
ONECUT2 synergizes with hypoxia in driving neuroendocrine plasticity in prostatic adenocarcinoma. a NEPC marker gene expression in LNCaP cells. mRNA abundance as measured by RT-qPCR assay was first normalized by housekeeping gene RPS28, and then z-score normalized; red represents higher signal and blue represents lower signal. b Expression of PEG10 in ONECUT2 overexpressing LNCaP cells under normoxic and hypoxic conditions. c Z-scores of the 92 pan-NET upregulated genes (ONECUT2 excluded) calculated in LNCaP RNA-Seq data. RNA-Seq experiments were performed in LNCaP cells with and without ONECUT2 overexpression under normoxic and hypoxic conditions. d Heatmap shows ONECUT2 overexpression and hypoxia synergistically promote expression of the core pan-NET transcriptional factors. e ONECUT2 ChIP-Seq signal at MYT1 promoter under normoxic and hypoxic conditions. f Z-scores of the 243 DHT-induced genes calculated in LNCaP RNA-Seq data. RNA-Seq experiments were performed in LNCaP cells with and without ONECUT2 overexpression under normoxic and hypoxic conditions. g Neuritogenesis analysis in LNCaP cell with and without overexpression of ONECUT2 under normoxic and hypoxic conditions. Error bars in b indicate s.d. from four technical replicates. P-values are calculated from a Student’s t-test in a and b and Wilcoxon rank sum test in c, f, and g. *: P < 0.05. **: P < 0.01. EV empty vector control, OC2 ONECUT2 overexpression. Source data are provided as a Source Data file
Fig. 5
Fig. 5
NEPC is highly hypoxic and sensitive to hypoxia-directed treatment. a, b Hypoxia marker gene CA9 IHC staining in two independent tissue microarray sets. The combined H-score, taking into account of both staining intensity and percentage, was used to quantify CA9 protein levels. (c) Representative images of tissue microarray analysis of AR, SYP, and CA9 IHC staining in benign prostate, primary PCa, adeno-CRPC, and NEPC tissues. Scale bar = 50 μm. d Correlation between ONECUT2 upregulated genes (summarized in z-scores) and hypoxia scores in Beltran adeno-CRPC/NEPC dataset. e PC3 xenograft tumor growth in response to hypoxia-activated prodrug TH-302 treatment, with and without silencing of ONECUT2. n = 7 for shCtrl_Vehicle; n = 6 for shCtrl_TH302; n = 8 for shOC2_Vehicle; n = 7 for shOC2_TH302. f Representative images of PIMO IHC staining of V16A xenograft tumors with and without overexpression of ONECUT2. Scale bar = 200 μm. g V16A xenograft tumor growth in response to TH-302 with and without overexpression of ONECUT2. n = 7 for EV_Vehicle; n = 8 for EV_TH302; n = 6 for OC2_Vehicle; n = 6 for OC2_TH302. h Relative expression levels of related genes in the adeno-CRPC (LTL484) and NEPC (LTL545) PDX models determined by microarray analysis. i TH-302 treatment suppresses tumor growth in NEPC patient-derived xenografts. n = 4 for vehicle group and n = 4 for TH-302 group in NEPC PDXs; n = 5 for vehicle group and n = 5 for TH-302 group in adeno-CRPC PDXs. In e, g, and i, inhibition rate (IR) of tumor growth was calculated as (Tumor volume Vehicle−Tumor volume TH-302)/Tumor volume Vehicle. P values were determined by mixed-effects models of repeated-measures ANOVA for e, g, and i. Source data are provided as a Source Data file

References

    1. Rickman DS, Beltran H, Demichelis F, Rubin MA. Biology and evolution of poorly differentiated neuroendocrine tumors. Nat. Med. 2017;23:1–10. doi: 10.1038/nm.4341. - DOI - PubMed
    1. Aggarwal R, Zhang T, Small EJ, Armstrong AJ. Neuroendocrine prostate cancer: subtypes, biology, and clinical outcomes. J. Natl. Compr. Cancer Netw. 2014;12:719–726. doi: 10.6004/jnccn.2014.0073. - DOI - PubMed
    1. Vashchenko N, Abrahamsson PA. Neuroendocrine differentiation in prostate cancer: implications for new treatment modalities. Eur. Urol. 2005;47:147–155. doi: 10.1016/j.eururo.2004.09.007. - DOI - PubMed
    1. Beltran H, et al. Challenges in recognizing treatment-related neuroendocrine prostate cancer. J. Clin. Oncol. 2012;30:e386–e389. doi: 10.1200/JCO.2011.41.5166. - DOI - PubMed
    1. Bluemn EG, et al. Androgen receptor pathway-independent prostate cancer is sustained through FGF signaling. Cancer Cell. 2017;32:474–489 e476. doi: 10.1016/j.ccell.2017.09.003. - DOI - PMC - PubMed

Publication types

MeSH terms