. 2019 Jan 17;9(1):186.
doi: 10.1038/s41598-018-36970-4.

In-vivo correlations between skin metabolic oscillations and vasomotion in wild-type mice and in a model of oxidative stress

Affiliations

In-vivo correlations between skin metabolic oscillations and vasomotion in wild-type mice and in a model of oxidative stress

Salvatore Smirni et al. Sci Rep. .

Abstract

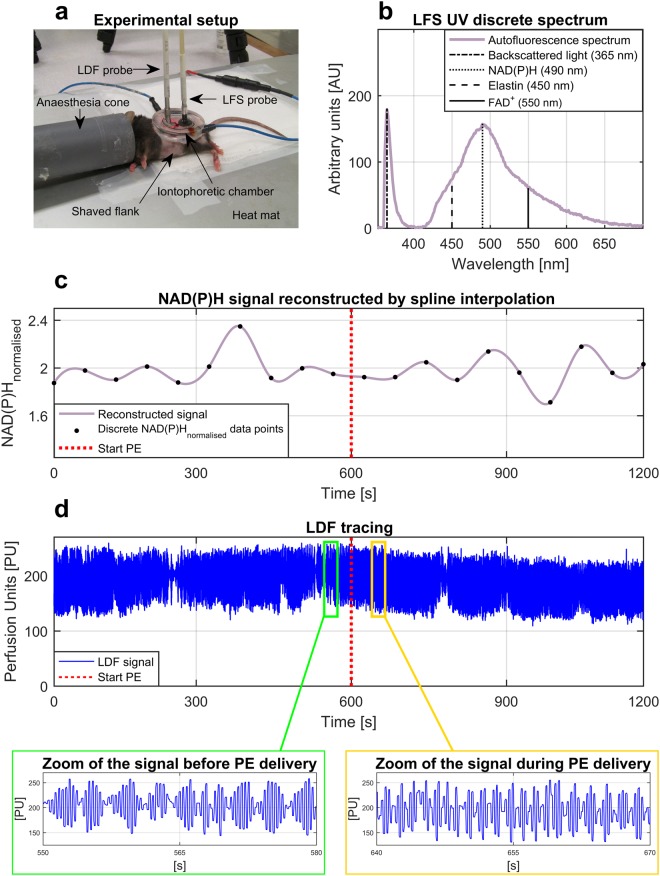
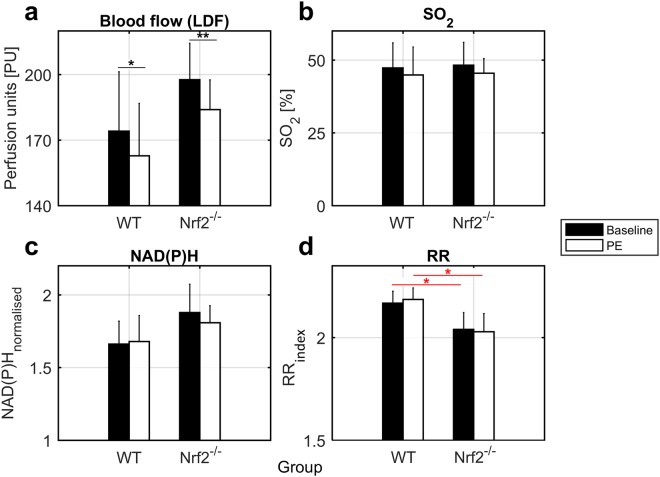
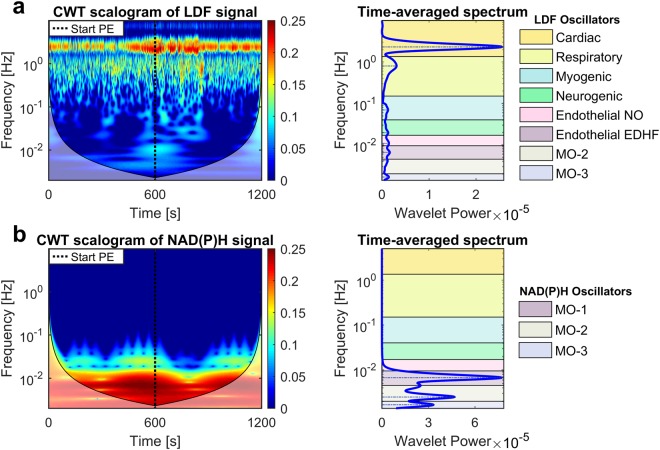
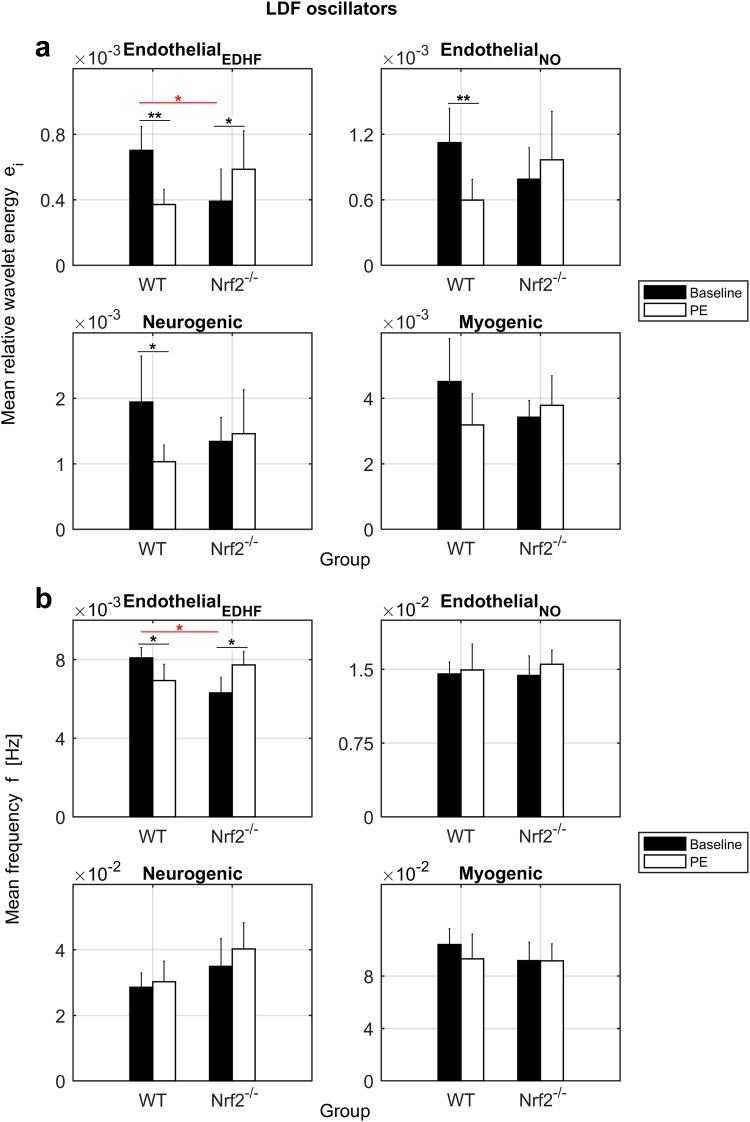
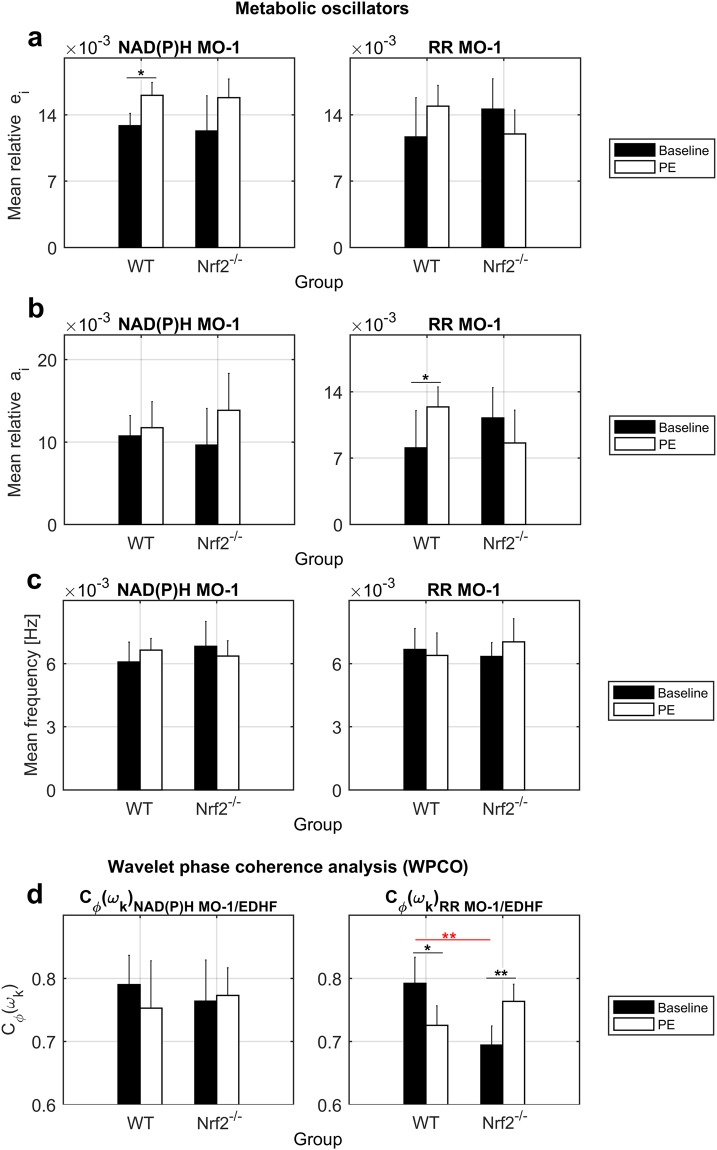
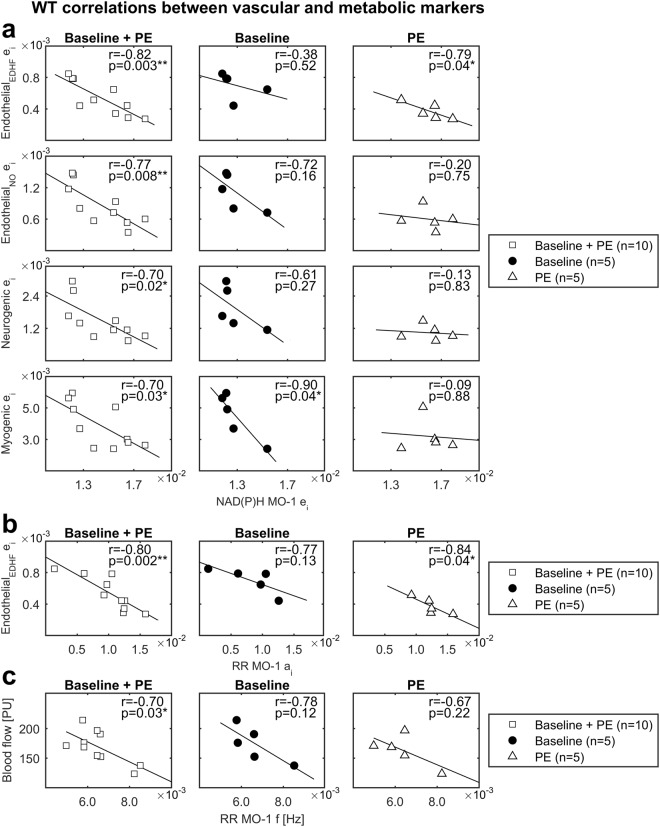
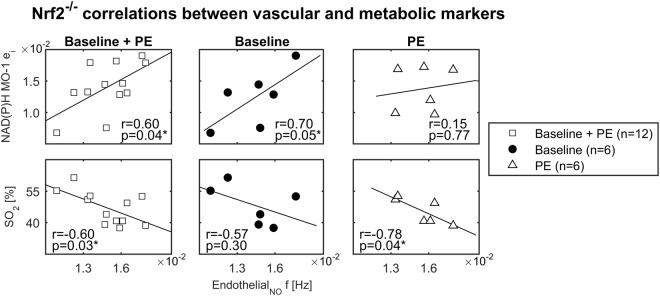
Arterioles in the cutaneous microcirculation frequently display an oscillatory phenomenon defined vasomotion, consistent with periodic diameter variations in the micro-vessels associated with particular physiological or abnormal conditions. The cellular mechanisms underlying vasomotion and its physiological role have not been completely elucidated. Various mechanisms were demonstrated, based on cell Ca2+ oscillations determined by the activity of channels in the plasma membrane or sarcoplasmic reticulum of vascular cells. However, the possible engagement in vasomotion of cell metabolic oscillations of mitochondrial or glycolytic origin has been poorly explored. Metabolic oscillations associated with the production of ATP energy were previously described in cells, while limited studies have investigated these fluctuations in-vivo. Here, we characterised a low-frequency metabolic oscillator (MO-1) in skin from live wild-type and Nrf2-/- mice, by combination of fluorescence spectroscopy and wavelet transform processing technique. Furthermore, the relationships between metabolic and microvascular oscillators were examined during phenylephrine-induced vasoconstriction. We found a significant interaction between MO-1 and the endothelial EDHF vasomotor mechanism that was reduced in the presence of oxidative stress (Nrf2-/- mice). Our findings suggest indirectly that metabolic oscillations may be involved in the mechanisms underlying endothelium-mediated skin vasomotion, which might be altered in the presence of metabolic disturbance.


Conflict of interest statement

The authors declare no competing interests.

Figures

Figure 1
Figure 1
Example of data collection from mouse skin. (a) Experimental setup for LFS and LDF recordings during local transdermal administration of 1% phenylephrine by iontophoresis. (b) Example of single UV discrete autofluorescence spectrum measured by LFS. (c) Example of 20 min NAD(P)H signal reconstructed by piecewise cubic spline interpolation of NAD(P)Hnormalised values extracted from 10 baseline UV spectra and 10 UV spectra collected during PE administration. (d) Example of 20 min blood flow tracing measured by LDF during iontophoresis.
Figure 2
Figure 2
Average trends of microvascular and metabolic biomarkers. (a) Blood flow (PU). (b) SO2 (%). (c) NAD(P)Hnormalised (dimensionless). (d) RRindex (dimensionless). Error bars = 2 standard errors (SE). Black bars = Baseline. White bars = PE. WT = Control. Nrf2−/− = Knockout. Black lines/asterisks = Significant changes during PE delivery. Red lines/asterisks = Significant differences between groups. t-test *p < 0.05, **p < 0.01.
Figure 3
Figure 3
CWT data processing of LDF and NAD(P)H signals. (a) Example of CWT scalogram (left) and corresponding time-averaged spectrum (right) from LDF signal. The scalogram describes the distribution of the wavelet spectral power/energy in the time-frequency domain using a gradient coloured map ranging from dark blue (low energy) to dark red (high energy). The chart displays a high-energy continuous band in the cardiac frequency interval, confirming that data were collected correctly. Physiologically, the wavelet energy represents a measure of how much a physiological component defined by a specific frequency interval contributes to blood flow signal at a specific time. The two transparent regions at the bottom-right and bottom-left of the scalogram represent regions outside of the “cone of influence” where data might not be reliable (frequencies < 5 × 10−3 Hz). The cone of influence is a time-frequency region where distortions of the CWT due to the finite temporal period of the measured signal are not relevant. Instead, the areas outside of the cone are close to the time limits of the time series, where the wavelet transform is affected by boundary effects making the calculations from this time-frequency region imprecise. The time-averaged spectrum (right graph) allows discriminating the wavelet energy peaks of the different oscillators at specific frequency intervals. As shown by the coloured tags in the legend, we identified the typical oscillators reported in literature: (I) Cardiac, (II) Respiratory, (III) Myogenic, (IV) Neurogenic, (V) Endothelial NO-dependent, (VI) Endothelial NO-independent (EDHF). Comparing the wavelet components between mice groups is powerful to distinguish healthy and diseased vascular conditions by quantifying the contribution of specific biological components. (b) Example of CWT analysis of the NAD(P)Hnormalised reconstructed signal. Three low-frequency metabolic oscillators were characterised: Metabolic oscillator-1 (MO-1), MO-2 and MO-3. These oscillators might reflect specific dynamic patterns of ATP energy production in the cutaneous tissue, which may be variable depending on the presence of healthy or diseased conditions. In this study, we focused on the dynamics of MO-1 because MO-2 and MO-3 intervals are located outside of the cone of influence where data might be inaccurate.
Figure 4
Figure 4
Results of LDF oscillators. (a) Mean relative energy ei (dimensionless) of the wavelet peaks. (b) Mean frequency f (Hz) of the wavelet peaks. Error bars = 2 SE. Black bars = Baseline. White bars = PE. WT = Control. Nrf2−/− = Knockout. Black lines/asterisks = Significant changes during PE administration. Red lines/asterisks = Significant differences between groups. t-test *p < 0.05, **p < 0.01.
Figure 5
Figure 5
Results of metabolic oscillators and WPCO analysis. (a) Mean energy ei (dimensionless), (b) mean amplitude ai (dimensionless), and (c) mean f (Hz) of NAD(P)H and RR MO-1 wavelet peaks. (d) Average phase coherence Cϕ(ωk) (dimensionless) between NAD(P)H or RR MO-1 and the endothelial EDHF oscillator. The WPCO analysis is useful to study the phase relationship between low-frequency oscillators, which cannot be performed using the analysis of synchronisation due to the noisy background in the slow CWT components. Error bars = 2 SE. Black bars = Baseline. White bars = PE. WT = Control. Nrf2−/− = Knockout. Black lines/asterisks = Significant changes during PE delivery. Red lines/asterisks = Significant differences between groups. t-test *p < 0.05, **p < 0.01.
Figure 6
Figure 6
Correlations in WT mice. (a) Correlations between NAD(P)H MO-1 ei and endothelial EDHF, endothelial NO, neurogenic, myogenic ei. (b) Correlation between RR MO-1 ai and endothelial EDHF ei. (c) Correlation between RR MO-1 f and blood flow. r = Pearson’s correlation coefficient. White squares = Baseline + PE (pooled data). Black dots = Baseline. White triangles = PE. *p ≤ 0.05, **p < 0.01.
Figure 7
Figure 7
Correlations in Nrf2−/− mice. Correlations between endothelial NO f and NAD(P)H MO-1 ei or SO2. r = Pearson’s correlation coefficient. White squares = Baseline + PE (pooled data). Black dots = Baseline. White triangles = PE. *p ≤ 0.05, **p < 0.01.

Similar articles

Cited by

References

    1. Aalkjaer C, Nilsson H. Vasomotion: cellular background for the oscillator and for the synchronization of smooth muscle cells. Br. J. Pharmacol. 2005;144:605–616. doi: 10.1038/sj.bjp.0706084. - DOI - PMC - PubMed
    1. Pradhan RK, Chakravarthy VS. Informational dynamics of vasomotion in microvascular networks: a review. Acta Physiol. (Oxf.). 2011;201(2):193–218. doi: 10.1111/j.1748-1716.2010.02198.x. - DOI - PubMed
    1. Traikov L, Ushiyama A, Lawlor G, Sasaki R, Ohkubo C. Subcutaneous arteriolar vasomotion changes during and after ELF-EMF exposure in mice in vivo. Environmentalis. 2005;25(2–4):93–101. doi: 10.1007/s10669-005-4271-0. - DOI
    1. Aalkjaer C, Boedtkjer D, Matchkov V. Vasomotion – what is currently thought? Acta Physiol. 2011;202(3):253–69. doi: 10.1111/j.1748-1716.2011.02320.x. - DOI - PubMed
    1. Okazaki K, et al. Role of the endothelium-derived hyperpolarizing factor in phenylephrine-induced oscillatory vasomotion in rat small mesenteric artery. Anesthesiology. 2003;98(5):1164–1171. doi: 10.1097/00000542-200305000-00019. - DOI - PubMed

Publication types

LinkOut - more resources