. 2018 Nov 5:83:e471-e481.
doi: 10.5114/pjr.2018.80218. eCollection 2018.

Tibial stress injuries - location, severity, and classification in magnetic resonance imaging examination

Affiliations

Tibial stress injuries - location, severity, and classification in magnetic resonance imaging examination

Agata Maria Gmachowska et al. Pol J Radiol. .

Abstract

Purpose: To describe and illustrate the spectrum of magnetic resonance imaging (MRI) findings of tibial stress injuries (TSI) and propose a simplified classification system.

Material and methods: Retrospective analysis of MRI exams of 44 patients with clinical suspicion of unilateral or bilateral TSI, using a modified classification system to evaluate the intensity and location of soft-tissue changes and bone changes.

Results: Most of the patients were young athletic men diagnosed in late stage of TSI. Changes were predominantly found in the middle and distal parts of tibias along medial and posterior borders.

Conclusions: TSI may be suspected in young, healthy patients with exertional lower leg pain. MRI is the only diagnostic method to visualise early oedematic signs of TSI. Knowledge of typical locations of TSI can be helpful in proper diagnosis before its evolution to stress fracture.

Keywords: athletic injuries; fractures; soft tissue injuries; stress; tibial fractures; tibial stress syndrome.


Figures

Figure 1
Figure 1
Grade 1 TSI: discrete periosteal oedema on medial and posterior side of distal part of left tibia, better seen on Ax PD fat sat images (arrows) than on Ax T1 FSE images. 46-year-old man with lower leg pain in last 10 days
Figure 2
Figure 2
Grade 2 TSI: periosteal oedema and bone marrow oedema without cortical abnormalities (ax PD FatSat)
Figure 3
Figure 3
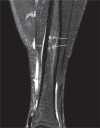
Another example of grade 2 TSI (Cor PD Fat Sat) – periosteal oedema and bone marrow oedema (arrows)
Figure 4
Figure 4
Grade 3 TSI: cortical abnormalities (arrow), periosteal and bone marrow oedema (Cor PD FatSat). Classical radiograph of the same patient on the right
Figure 5
Figure 5
The same patient with grade 3 TSI-periosteal oedema with discrete bone marrow oedema. Arrows show thickened cortex with loss of cortical signal void (ax PD fatsat, T1 fatsat, T1)
Figure 6
Figure 6
The same patient with grade 3 TSI – arrows show subtle intracortical linear hyperintensity (striations)
Figure 7
Figure 7
Bilateral TSI: grade 3 TSI on the left and grade 1 on the right. Left-sided periosteal and bone marrow oedema with cortical abnormalities on medio-posterior side. Subtle periosteal oedema on the right side in the same localisation
Figure 8
Figure 8
The same patient. Note that periosteal oedema is usually more extensive than changes in cortex
Figure 9
Figure 9
Grade 4 TSI. Fracture line can be difficult to visualise on T1 and T1 fat sat images (upper scans), but can be revealed on PD fat sat images and CT scans (lower scans). Changes in cortex are accompanied by periosteal oedema and subtle bone marrow oedema
Figure 10
Figure 10
The same patient. Contrast medium administration can also help to visualise fracture line (ax T1 fat sat images without contrast on the left and with contrast on the right)
Figure 11
Figure 11
Grade 4 TSI. Fracture line on coronal images (PDfatsat, T1WI)
Figure 12
Figure 12
Grade 4 TSI. Fracture line on sagittal images (PDfatsat, T1WI)
Figure 13
Figure 13
Grade 4 TSI. Fracture line on axial images (PDfatsat, T1WI)
Figure 14
Figure 14
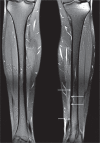
Bilateral TSI in 38-year-old runner. Cor PD fat sat image with proximal injury on the left and distal injury on the right (arrows)
Figure 15
Figure 15
The same patient. Proximal left tibia with grade 4 TSI and fracture line (arrow) and distal right tibia with cortical abnormalities (grade 3). Note that periosteal and bone marrow oedema is more intense in the left tibia
Figure 16
Figure 16
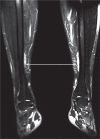
Bilateral periosteal oedema, more intense on the left (T2 SPAIR cor). No bone marrow oedema or cortical abnormalities were visible (grade 1 TSI). 33-year-old runner with right-sided lower leg pain
Figure 17
Figure 17
Healing periosteal reactions – a subtle periosteal new bone formation (callus)
Figure 18
Figure 18
Upper images show patient after stress fracture, healed after 6 months of rest (lower images)

References

    1. Gaeta M, Minutoli F, Scribano E, et al. CT and MR imaging findings in athletes with early tibial stress injuries: Comparison with bone scintigraphy findings and emphasis on cortical abnormalities. Radiology. 2005;235:553–561. - PubMed
    1. Taunton JE, Ryan MB, Clement DB, et al. A retrospective case-control analysis of 2002 running injuries. Br J Sports Med. 2002;36:95–101. - PMC - PubMed
    1. Fredericson M, Bergman AG, Hoffman KL, et al. Tibial stress reaction in runners: correlation of clinical symptoms and scintigraphy with a new magnetic resonance imaging grading system. Am J Sports Med. 1995;23:427–481. - PubMed
    1. Kijowski R, Choi J, Shinki K, et al. Validation of MRI classification system for tibial stress injuries. AJR Am J Roentgenol. 2012;198:878–884. - PubMed
    1. Beck BR, Bergman AG, Arendt EA, et al. Tibial stress injury: relationship of radiographics, nuclear medicine bone scanning, MR Imaging, and CT severity grades to clinical severity and time to healing. Radiology. 2012;263:811–818. - PubMed