. 2019 Jan 14:7:e6263.
doi: 10.7717/peerj.6263. eCollection 2019.

Variation in wild pea (Pisum sativum subsp. elatius) seed dormancy and its relationship to the environment and seed coat traits

Affiliations

Variation in wild pea (Pisum sativum subsp. elatius) seed dormancy and its relationship to the environment and seed coat traits

Iveta Hradilová et al. PeerJ. .

Abstract

Background: Seed germination is one of the earliest key events in the plant life cycle. The timing of transition from seed to seedling is an important developmental stage determining the survival of individuals that influences the status of populations and species. Because of wide geographical distribution and occurrence in diverse habitats, wild pea (Pisum sativum subsp. elatius) offers an excellent model to study physical type of seed dormancy in an ecological context. This study addresses the gap in knowledge of association between the seed dormancy, seed properties and environmental factors, experimentally testing oscillating temperature as dormancy release clue.

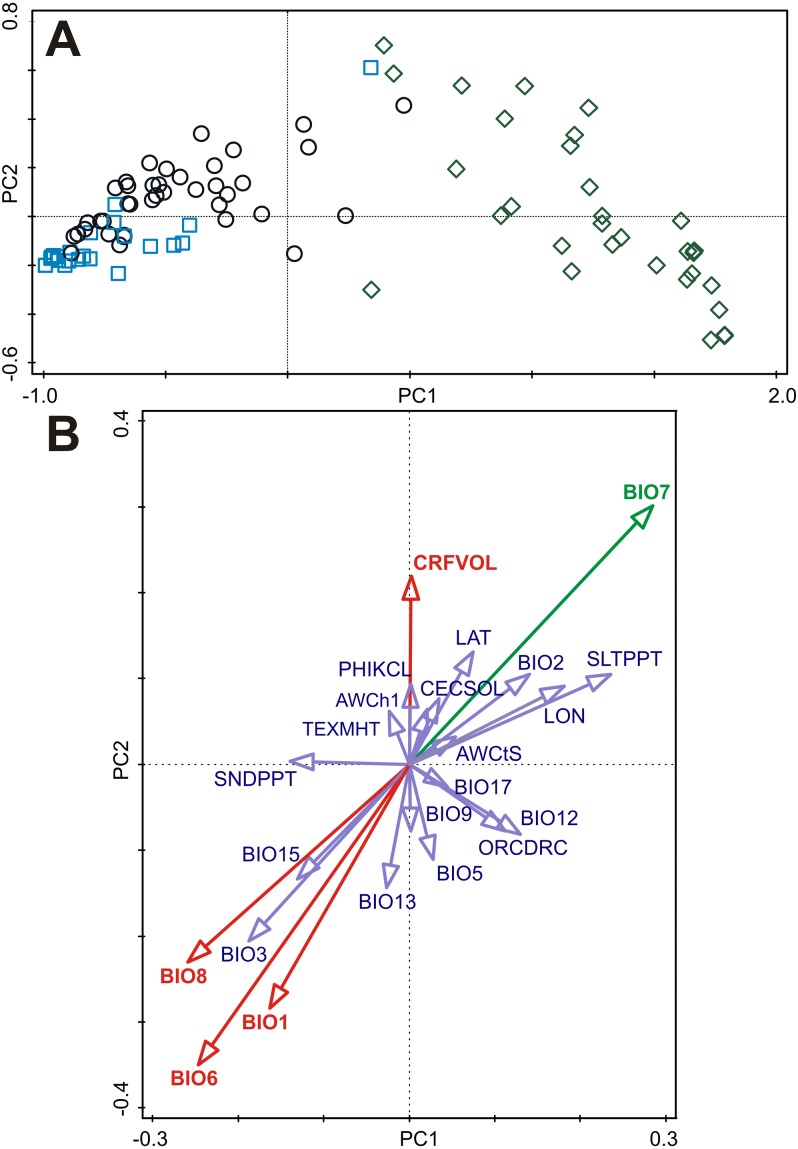
Methods: Seeds of 97 pea accessions were subjected to two germination treatments (oscillating temperatures of 25/15 °C and 35/15 °C) over 28 days. Germination pattern was described using B-spline coefficients that aggregate both final germination and germination speed. Relationships between germination pattern and environmental conditions at the site of origin (soil and bioclimatic variables extracted from WorldClim 2.0 and SoilGrids databases) were studied using principal component analysis, redundancy analysis and ecological niche modelling. Seeds were analyzed for the seed coat thickness, seed morphology, weight and content of proanthocyanidins (PA).

Results: Seed total germination ranged from 0% to 100%. Cluster analysis of germination patterns of seeds under two temperature treatments differentiated the accessions into three groups: (1) non-dormant (28 accessions, mean germination of 92%), (2) dormant at both treatments (29 acc., 15%) and (3) responsive to increasing temperature range (41 acc., with germination change from 15 to 80%). Seed coat thickness differed between groups with dormant and responsive accessions having thicker testa (median 138 and 140 µm) than non-dormant ones (median 84 mm). The total PA content showed to be higher in the seed coat of dormant (mean 2.18 mg g-1) than those of non-dormant (mean 1.77 mg g-1) and responsive accessions (mean 1.87 mg g-1). Each soil and bioclimatic variable and also germination responsivity (representing synthetic variable characterizing germination pattern of seeds) was spatially clustered. However, only one environmental variable (BIO7, i.e., annual temperature range) was significantly related to germination responsivity. Non-dormant and responsive accessions covered almost whole range of BIO7 while dormant accessions are found in the environment with higher annual temperature, smaller temperature variation, seasonality and milder winter. Ecological niche modelling showed a more localized potential distribution of dormant group. Seed dormancy in the wild pea might be part of a bet-hedging mechanism for areas of the Mediterranean basin with more unpredictable water availability in an otherwise seasonal environment. This study provides the framework for analysis of environmental aspects of physical seed dormancy.

Keywords: Dormancy; Germination; Legumes; Niche-modelling; Pea; Proanthocyanidins; Seed coat; Temperature oscillations; Testa.


Conflict of interest statement

The authors declare there are no competing interests.

Figures

Figure 1
Figure 1. Spatial distribution of tested samples and their categorized germination pattern in relationship to selected bioclimatic variables.
Categorized germination patterns of accessions tested at alternate temperature regimes 25/15 °C (A, B) and 35/15 °C (C, D) over smoothed bioclimatic variables BIO6 (Min Temperature of Coldest Month) and BIO7 (Temperature Annual Range) extracted from WorldClim 2.0 database. (D, dormant, N, non-dormant, R, responsive accessions. See Table S2 for details).
Figure 2
Figure 2. Cluster analysis of germination pattern of tested accessions in response to two alternate temperature regimes.
Figure presents results of UPGMA of Euclidean distances of the area under the curves of calculated absolute germination distribution functions (AGDF) at 25/15 °C and 35/15 °C temperature regimes (See Table S2 for details). Clusters are coloured to visualise several categories of germination pattern (green: N, non-dormant, violet: R, responsive to temperature, red: D, dormant at both temperature regimes).
Figure 3
Figure 3. Principal component analysis (PCA) of the B-spline coefficients describing pattern of germination and multiple correlations of environmental variables with ordination axes.
(A) The first and the second axes explain 87.3% and 5.6% of the total variation, respectively. Accessions are classified as either dormant (D, blue square), responsive (R, empty circle), or non-dormant (N, green diamond) according to the results of the cluster analyses (see Fig. 2). (B) Multiple correlations of environmental variables with the first and the second ordination axes of the PCA. Each arrow points in the direction of the steepest increase of the values for corresponding environmental variable. The angle between arrows indicates the sign of the correlation between the environmental variables. The length of the environmental variable arrows is the multiple correlation of that environmental variable with the ordination axes. Environmental variable in green is significantly correlated (spatial correlation) with both ordination axes. Environmental variables in red are significantly correlated (spatial correlation) with the second ordination axis. See Table S5 for Pearson correlation coefficients and corrected correlation coefficients (using Dutilleul method) of environmental variables with the first and the second ordination axes.
Figure 4
Figure 4. Relationship between germination responsivity of accessions in both temperature treatments and annual temperature range (BIO7).
Germination responsivity is represented by residuals of scores along the first canonical ordination axis of RDA with one PCNM variable as an explanatory variable. Accessions are classified as either dormant (D; blue square), responsive (R; empty circle), or non-dormant (N; green diamond) according to the results of the cluster analyses (see Fig. 2). The ellipses were created based on a model of bivariate normal distribution of the dormancy class symbols (estimated from a variance-covariance matrix of their X and Y coordinates) to cover 95% of that distribution’ cases. Black line represent fitted Generalized Additive Model (response variable: PC1, predictor: BIO7, distribution: normal, link function: identity, fitted model deviance: 1,113.01 with 94.996 residual DFs, null model deviance: 1,207.34 with 96 residual dfs, model AIC: 518.23, model test: F = 8.0, P = 0.0056).
Figure 5
Figure 5. Predictions of niche models for the different dormancy groups.
Colder colours represent areas of low probability of occurrence according to the models, while warmer colours correspond to areas of high probability, for dormant (A), responsive (B) and non-dormant (C) groups, respectively.
Figure 6
Figure 6. Box-plots of seed coat (testa) thickness of accessions classified into categories according to germination pattern under two temperature regimes.
The panels compare dormant (D) and non-dormant (N) accessions tested under 25/15 °C temperature regime (A); and dormant (D), temperature responsive (R) and non-dormant (N) accessions under 35/15 °C temperature regime (B).
Figure 7
Figure 7. Comparison of dormant and non-dormant wild pea seed germination pattern, seed morphology and seed coat structure.
The panels show the cumulative percentage over 28 days at 25/15 °C temperature regime of representative dormant (A) and non-dormant accessions (B) and seed micrographs and respective seed coat Toluidine stained sections at 40×magnification for dormant (C–F) and non-dormant (G–J) accessions.

Similar articles

Cited by

References

    1. Ader F. On reducing the proportion of hard seeds in legume seed lots. International Seed Testing Association Proceedings. 1965;30:911–921.
    1. Afzal SF, Ni J, Chen J, Wang Q, Liu W, Chen X, Tang C, Fu S, Wu L. Proanthocyanidins in seed coat tegmen and endospermic cap inhibit seed germination in Sapium sebiferum. PeerJ. 2017;6:e4690. doi: 10.7717/peerj.4690. - DOI - PMC - PubMed
    1. Akaike H. A new look at the statistical model identification. IEEE Transactions on Automatic Control. 1974;19:716–723. doi: 10.1109/TAC.1974.1100705. - DOI
    1. Appelhagen I, Thiedig K, Nordholt N, Schmidt N, Huep G, Sagasser M, Weisshaar B. Update on transparent testa mutants from Arabidopsis thaliana: characterisation of new alleles from an isogenic collection. Planta. 2014;240:955–970. doi: 10.1007/s00425-014-2088-0. - DOI - PubMed
    1. Baskin CC, Baskin JM. Seeds: ecology, biogeography, and evolution of dormancy and germination. Academic Press; San Diego: 2014.

LinkOut - more resources