Case Reports
. 2018 Nov 12;6(1):167-173.
doi: 10.1002/acn3.695. eCollection 2019 Jan.

Pilomotor seizures marked by infraslow activity and acetazolamide responsiveness

Affiliations
Case Reports

Pilomotor seizures marked by infraslow activity and acetazolamide responsiveness

Richard Wennberg et al. Ann Clin Transl Neurol. .

Abstract

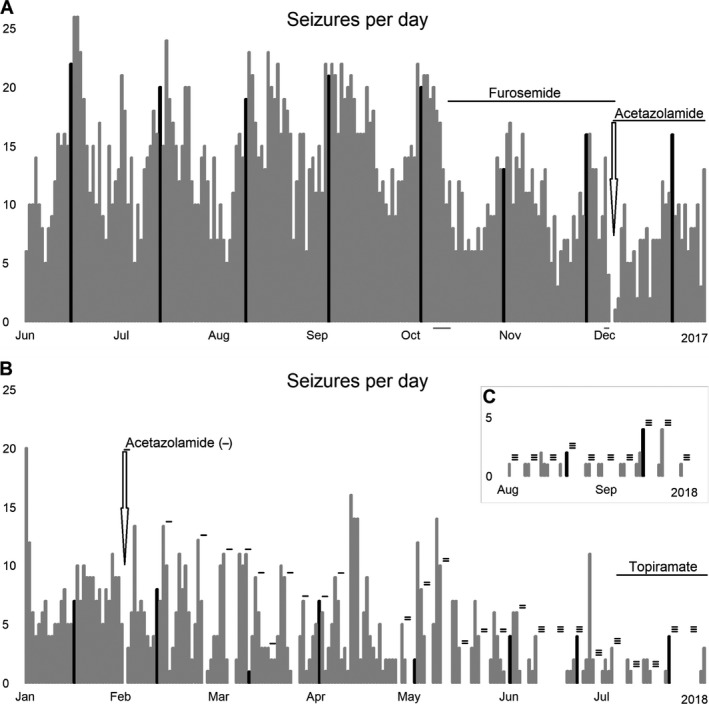
A patient with pilomotor seizures post anti-LGI1 limbic encephalitis, refractory to immunotherapy and anti-epileptic drugs, was investigated with electroencephalography and magnetoencephalography. Seizures occurred daily (14.9 ± 4.9/day), with catamenial exacerbation, inducible by hyperventilation. Anterior temporal ictal onsets were heralded (by ~15 sec) by high amplitude ipsilateral electromagnetic infraslow activity. The catamenial/ventilatory sensitivity and the infraslow activity (reflecting glial depolarization) suggested an ionic, CO 2/pH-related glioneuronal mechanism. Furosemide decreased seizure frequency by ~33%. Acetazolamide led to immediate seizure freedom, but lost efficacy with daily treatment. A cycling acetazolamide regimen (2 days on, 4 days off) plus low-dose topiramate maintained >95% reduction (0.5 ± 0.9/day) in seizures.


Figures

Figure 1
Figure 1
Pilomotor EEG seizure onsets marked by high amplitude infraslow activity (ISA) approximately 15 sec before rhythmic ictal activity (underlined) over right (A, B) or left (C) anterior temporal region. Aura (“chills”) sensed shortly after ISA onsets (asterisks indicate patient activations of event marker). The ISA shows: a first electropositive peak maximal over the central (C4 or C3) greater than posterior temporal/parietal region ipsilateral to the subsequent anterior temporal (F8/F10 > T4/T10 or F7/F9 > T3/T9) ictal activity; a second electropositive peak maximal over the contralateral central region; and a third contralateral electronegative central peak preceding return of the ISA to baseline (vertical line) during the anterior temporal ictal activity. Low frequency filter (LFF) 0.07 Hz. High frequency filter (HFF) 30 Hz. MRI shows mild bilateral mesial temporal FLAIR hyperintensities. (D) Voltage topographic plots of ISA seizure onsets over right (top) and left (bottom) hemispheres; data averaged from seven right‐ and left‐sided seizures recorded during one 24‐h video‐EEG monitoring session. First peak (left column) shows maximal surface positivity (white) over ipsilateral central>temporoparietal area; second peak, approximately 5 sec later (right column), shows contralateral central positivity and simultaneous ipsilateral central negativity (dark), a topography not readily ascribable to a neuronal dipolar source. LFF 0.07 Hz. HFF 1 Hz.
Figure 2
Figure 2
(A) Simultaneous MEG and EEG recording of a right‐sided pilomotor seizure. Selected right hemispheric MEG channels shown (10 magnetometer, 36 gradiometer) from total 306‐channel acquisition. ISA evident in MEG, but much more prominent in EEG, the first (^), second (^^) and third (^^^) ISA peaks accentuated (compared to the EEG recordings in Fig. 1) because of the longer time constant (LFF 0.03 Hz). Coincident with ISA onset, a distinct amplitude suppression of faster cortical rhythms is apparent in the MEG recording, beginning to recover after ~7.5 sec (around the time of the second ISA peak), regaining baseline amplitudes ~15 sec after ISA onset, just before the appearance of rhythmic ictal activity over the right temporal lobe (horizontal bar). M  =  magnetometers. G1 =  planar gradiometers. G2 =  planar gradiometers (orthogonal to G1). HFF 30 Hz. (B) Time‐frequency plot of broadband (0.03–330 Hz) MEG signal from right hemisphere sensors over the 15‐min period surrounding the seizure shown in (A). ISA epoch from onset to return to baseline marked by vertical lines: plot shows decrease in power (blue) of right hemispheric activity during ISA. Topographic plots above show alpha frequency (~10 Hz) suppression maximal over centrotemporoparietal area and beta frequency (~20 Hz) suppression maximal more anteriorly, over frontotemporal area (whole head 204 gradiometer channel data). Rhythmic right temporal ictal pattern evident in time‐frequency plot as increased power (red) in delta band (underlined). (C) Beamformer source reconstruction of the rhythmic ictal signal from two right temporal seizures (top) and a left temporal seizure (bottom) recorded with MEG shows ictal localization to the anterobasolateral temporal regions (gradiometer data, results thresholded at 99.5%; single‐shell forward model based on subject's brain MRI scan). Insets: topographic plots of MEG log spectral power differences between the rhythmic component of the ictal periods and interictal baseline periods at a central frequency 2 Hz (204 orthogonal gradiometer sensors). Beamformer analyses of the ISA component of the three ictal events did not return meaningful MEG source solutions. No interictal epileptiform discharges were recorded.
Figure 3
Figure 3
(A) Daily pilomotor seizure frequency over seven months in 2017 shows catamenial exacerbations, slight decrease during daily furosemide (20 mg) trial (first horizontal black bar); and 44‐h period of transient seizure freedom (arrow) at start of one‐month acetazolamide (125 mg BID) trial (second horizontal black bar). Other antiepileptic drugs (AEDs): levetiracetam 1500 mg BID June to October, decreased to 500 mg BID at commencement of furosemide; clobazam 10 mg daily August to October, discontinued at commencement of furosemide. Vertical black bars = first day of menstrual cycle. Horizontal grey bars = days of video‐EEG and MEG recording (first), repeat 24‐h video‐EEG recording (second). (B) Daily seizure frequency over seven months in 2018 shows 46‐h period of seizure freedom (arrow) after reintroduction of acetazolamide, two‐day course, 125 mg BID, end of January. Over the next weeks two‐day courses of acetazolamide 125 mg BID (single horizontal bars) were alternated with progressively shortened drug‐free intervals to determine optimal cycling regimen: efficacy was lost or diminished at intervals less than 4 days. Three weeks later, acetazolamide reintroduced in a cycling 250 mg BID regimen, 2 days on (double horizontal bars), 4 days off, with repeated periods of seizure freedom lasting ~72 h. Acetazolamide dosage increased to 375 mg BID mid June, same 2 days on (triple horizontal bars), 4 days off regimen, with periods of seizure‐freedom lasting 84–144 h. Other AEDs: levetiracetam 500 mg BID, decreased to 250 mg BID early June, discontinued mid‐June (to relieve emotional adverse effects); phenytoin (started December 30, 2017) 500 mg daily; topiramate (long horizontal bar; gradually uptitrated to 50 mg BID July. (C) Continuation of seizure frequency graph in (B), same cycling acetazolamide 375 mg BID regimen, topiramate downtitrated to 25 mg BID (to relieve paresthesiae, blurred vision adverse effects). Vertical black bars = first day of menstrual cycle.

Similar articles

Cited by

References

    1. Andrade DM, Tai P, Dalmau J, Wennberg R. Tonic seizures: a diagnostic clue of anti‐LGI1 encephalitis? Neurology 2011;76:1355–1357. - PMC - PubMed
    1. Irani S, Michell AW, Lang B, et al. Faciobrachial dystonic seizures precede Lgi1 antibody limbic encephalitis. Ann Neurol 2011;69:892–900. - PubMed
    1. Navarro V, Kas A, Apartis E, et al. Motor cortex and hippocampus are the two main cortical targets in LGI1‐antibody encephalitis. Brain 2016;139:1079–1093. - PubMed
    1. Wennberg R, Steriade C, Chen R, Andrade D. Frontal infraslow activity marks the motor spasms of anti‐LGI1 encephalitis. Clin Neurophysiol 2018;129:59–68. - PubMed
    1. Steriade C, Mirsattari SM, Murray BJ, Wennberg R. Subclinical temporal EEG seizure pattern in LGI1‐antibody—mediated encephalitis. Epilepsia 2016;57:e155–e160. - PubMed

Publication types