. 2019 Jun;226(2):e13256.
doi: 10.1111/apha.13256. Epub 2019 Feb 20.

Impaired butyrate absorption in the proximal colon, low serum butyrate and diminished central effects of butyrate on blood pressure in spontaneously hypertensive rats

Affiliations

Impaired butyrate absorption in the proximal colon, low serum butyrate and diminished central effects of butyrate on blood pressure in spontaneously hypertensive rats

Tao Yang et al. Acta Physiol (Oxf). 2019 Jun.

Abstract

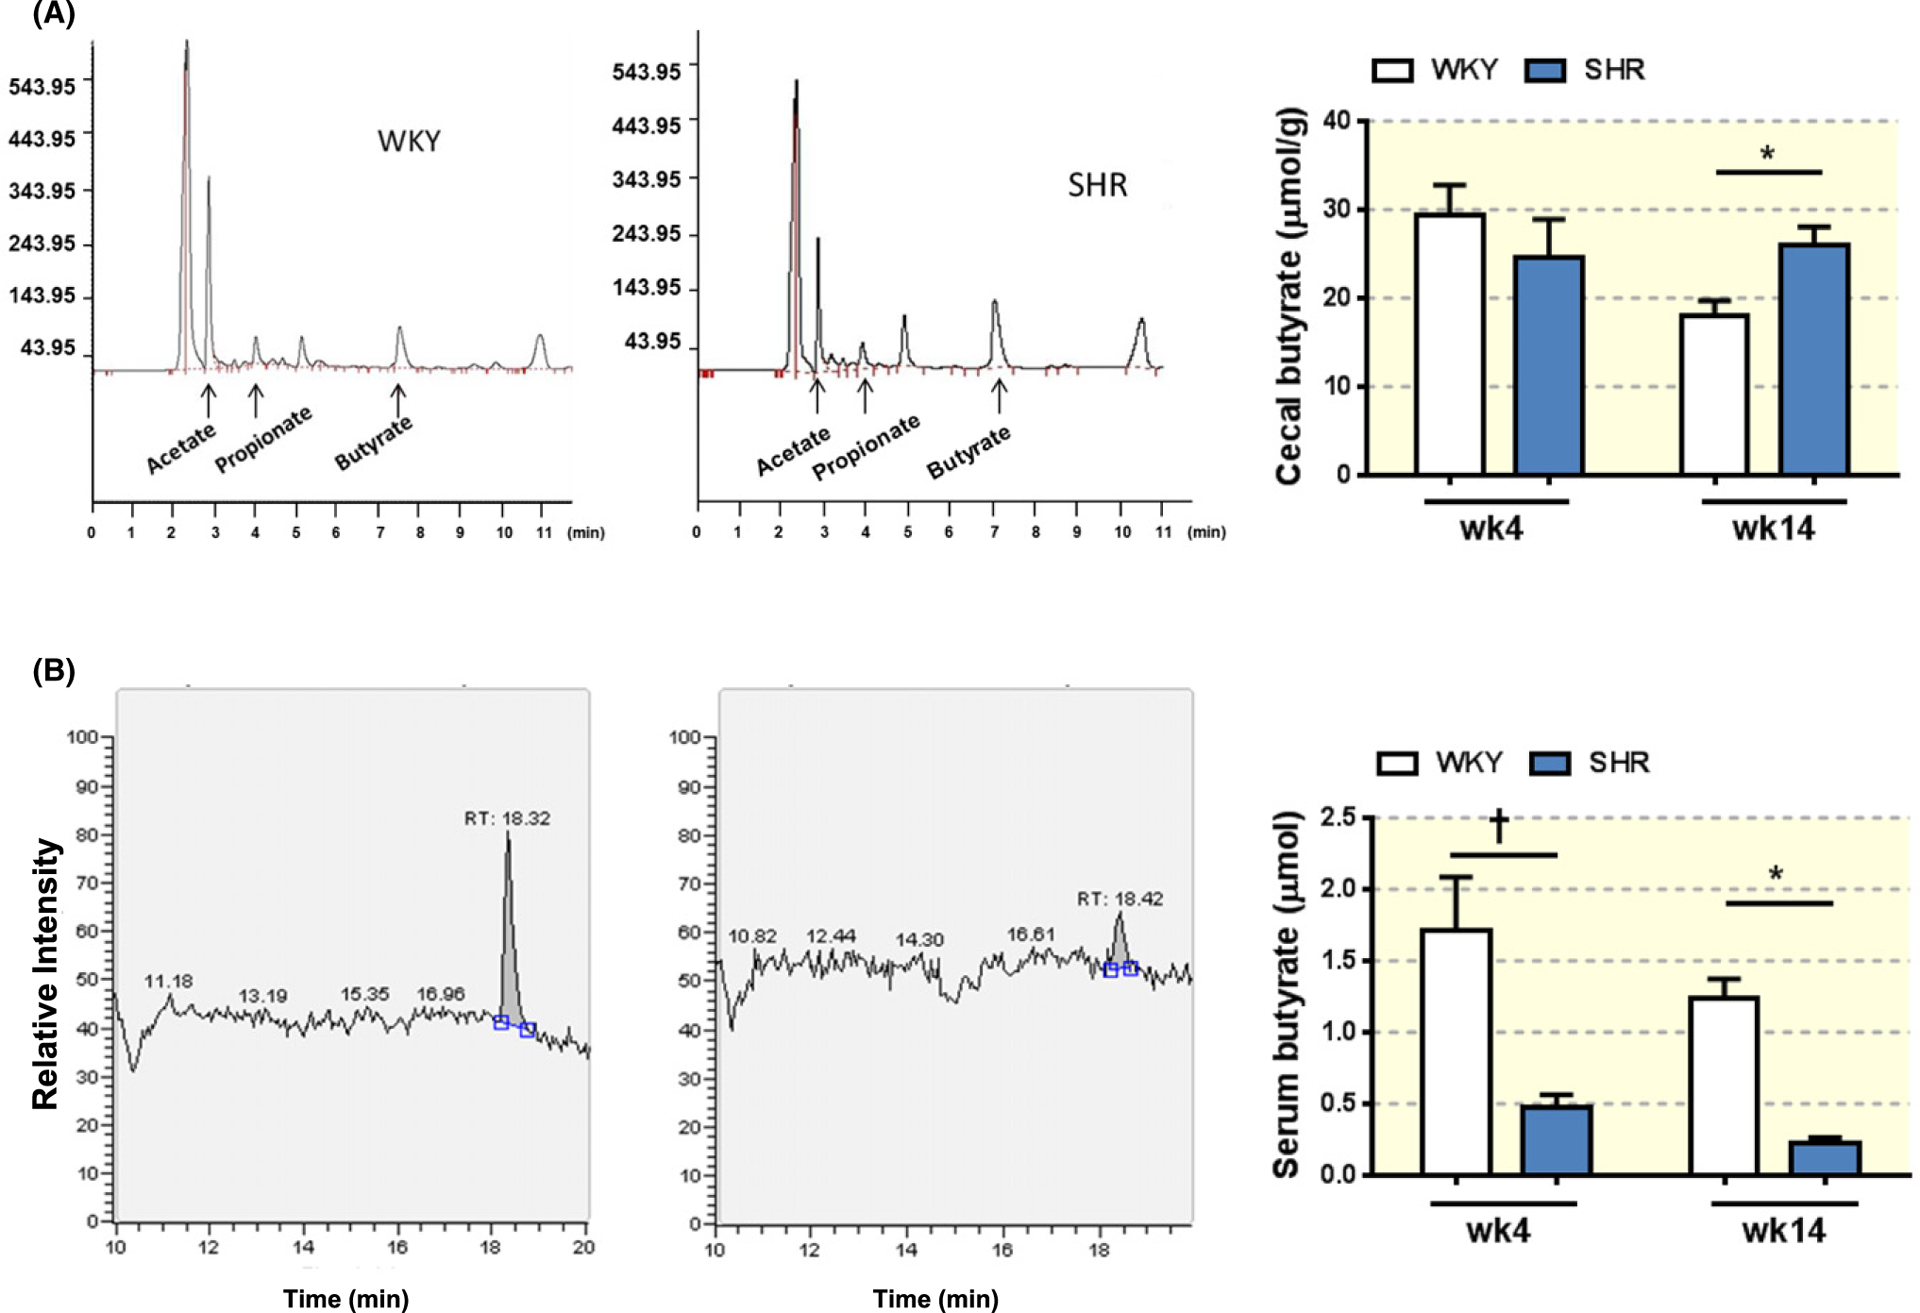
Aim: Butyrate is a major gut microbiota-derived metabolite. Reduced butyrate-producing bacteria has been reported in the spontaneously hypertensive rat (SHR), a model of hypertension characterized by dysfunctional autonomic nervous system and gut dysbiosis. Here, we demonstrate a potential mechanism for butyrate in blood pressure regulation.

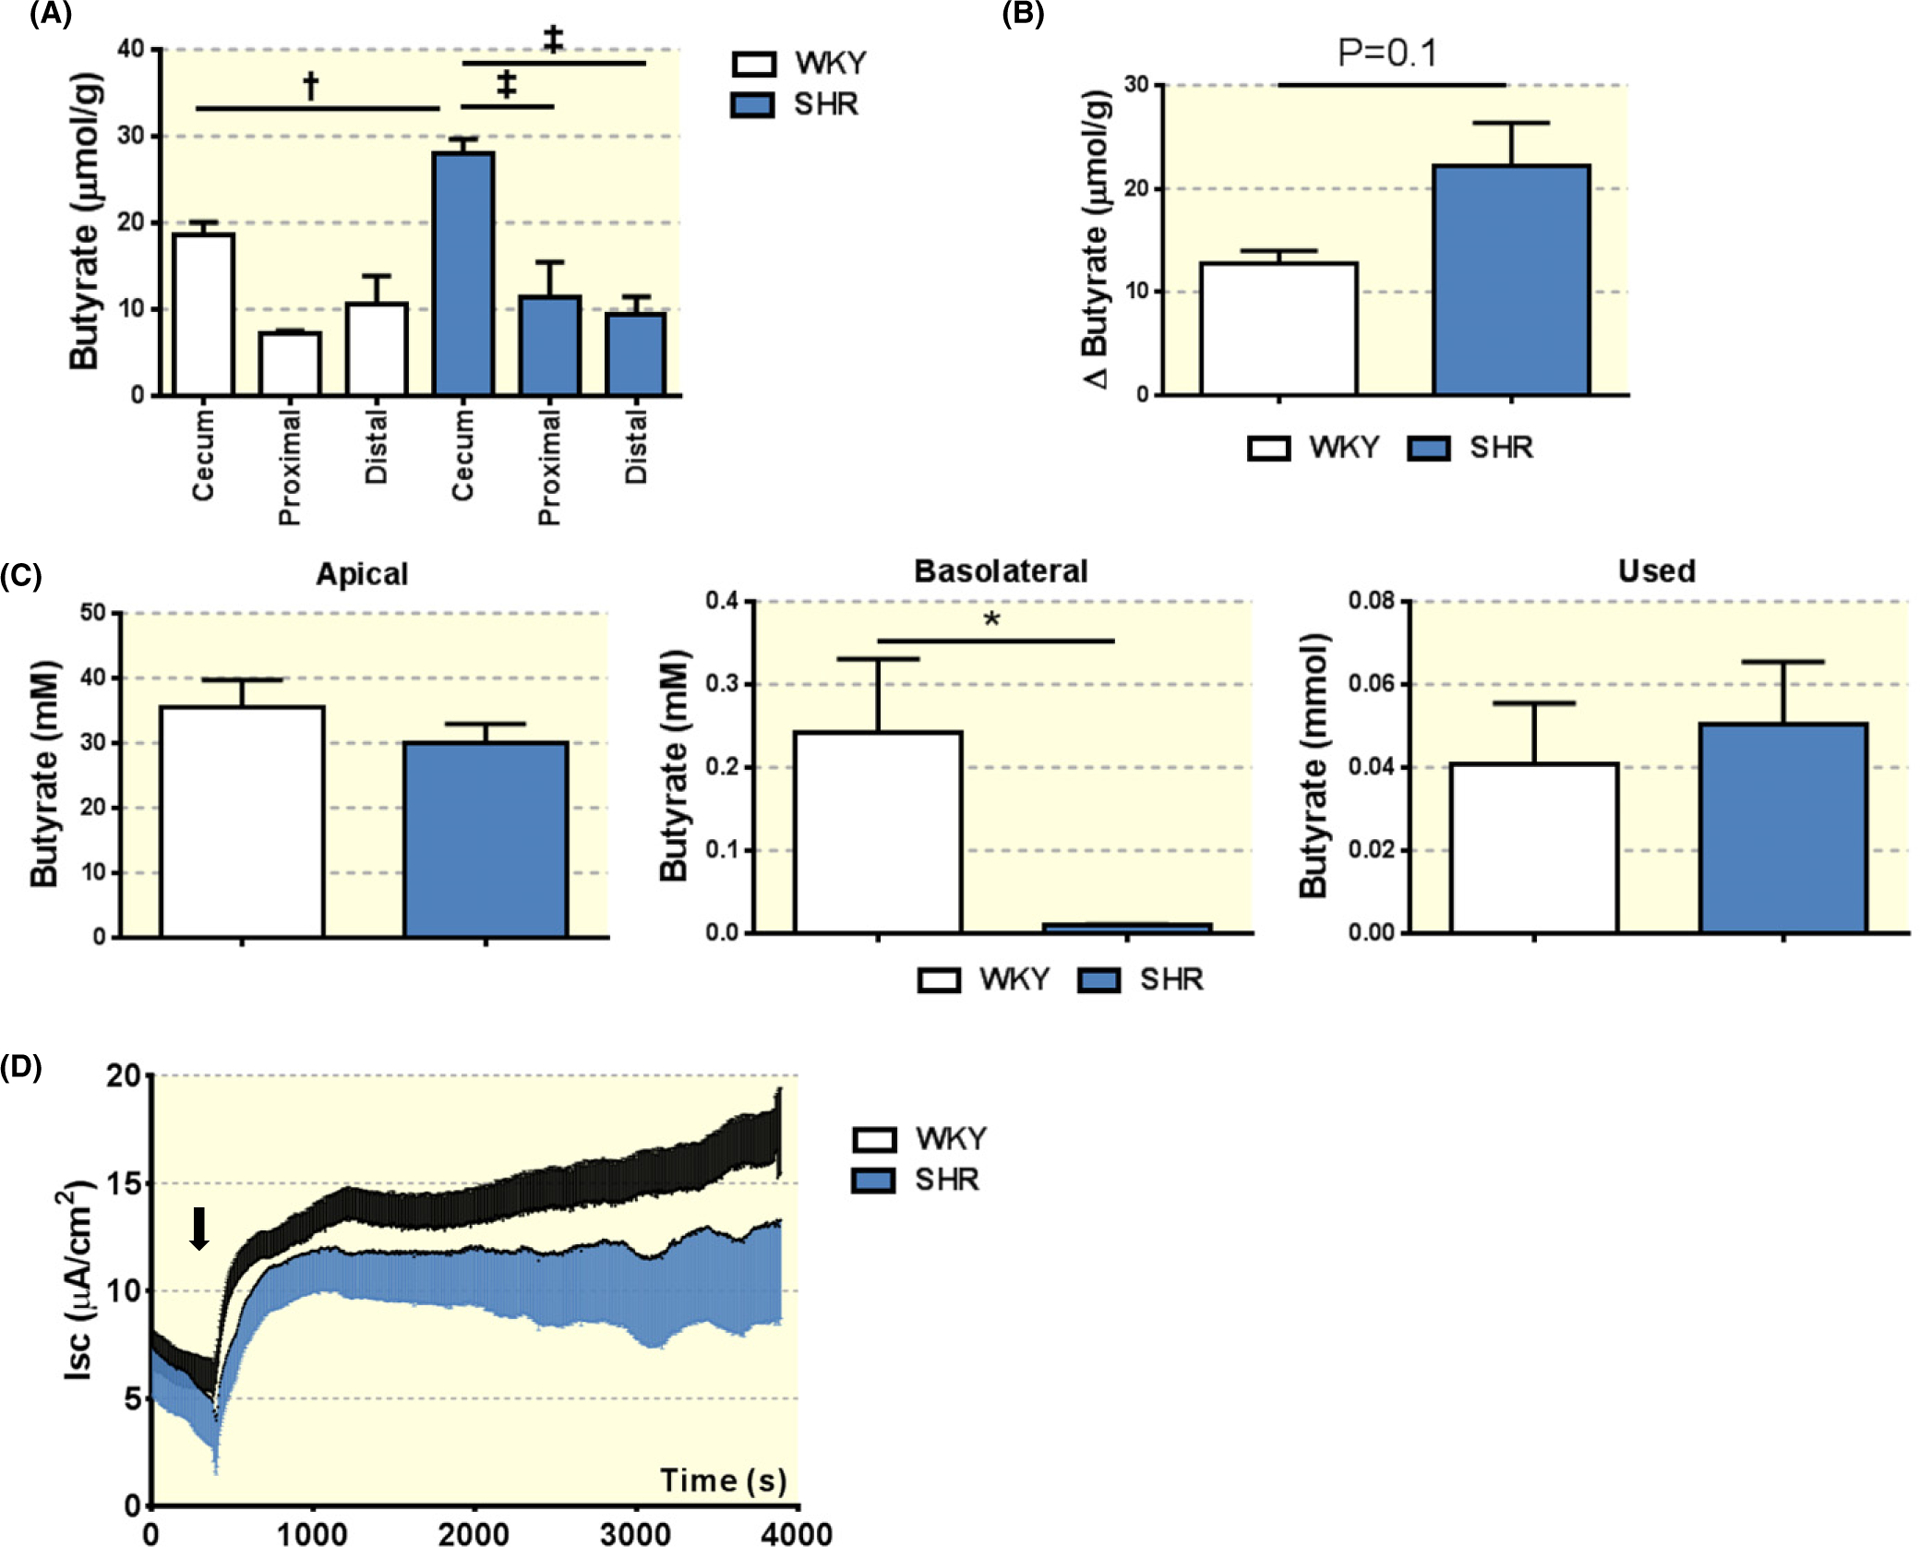
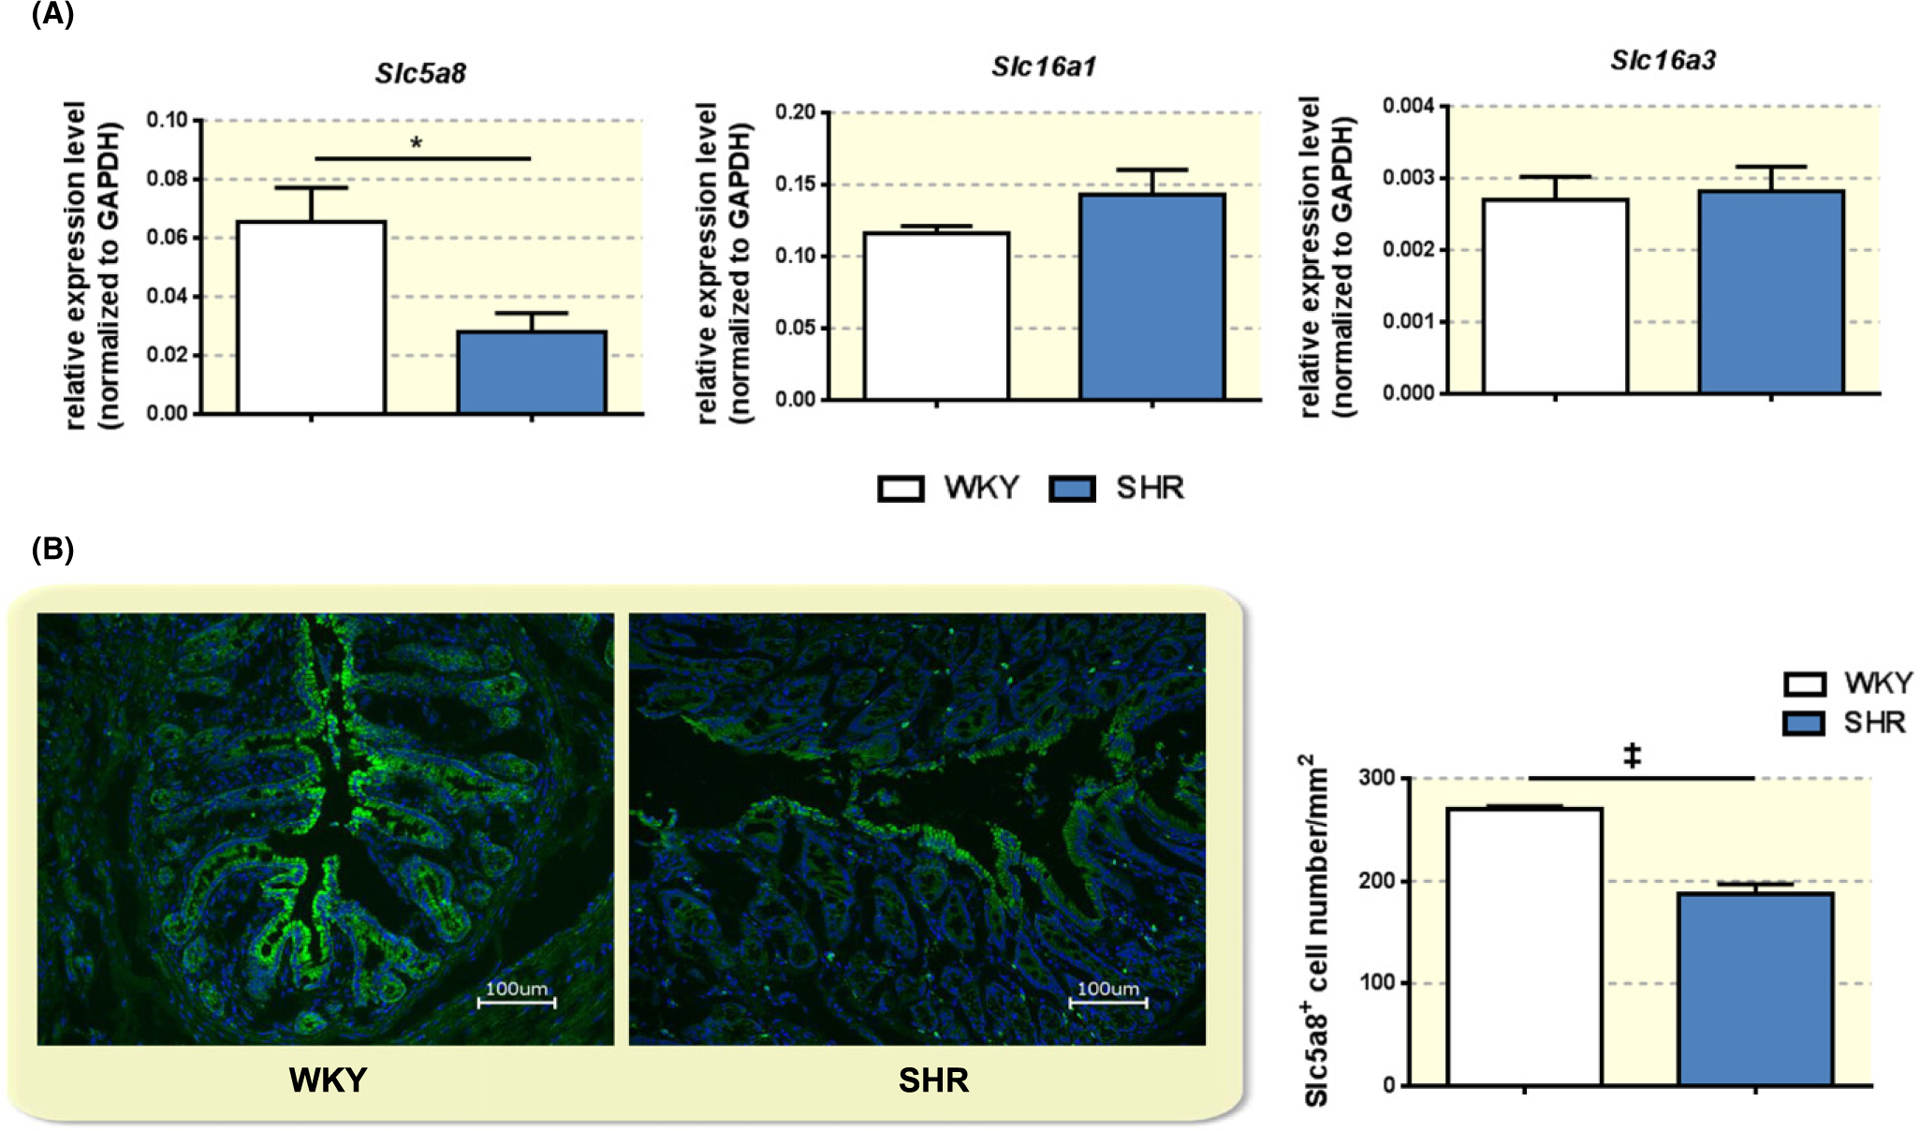
Methods: High-performance liquid chromatography and liquid chromatography-mass spectrometry were performed to measure butyrate levels in feces and serum. Ussing chamber determined butyrate transport in colon ex vivo. Real-time PCR and immunohistochemistry evaluated expression of butyrate transporter, Slc5a8, in the colon. Mean arterial blood pressure was measured in catheterized anesthetized rats before and after a single butyrate intracerebroventricular injection. Activity of cardioregulatory brain regions was determined by functional magnetic resonance imaging to derive neural effects of butyrate.

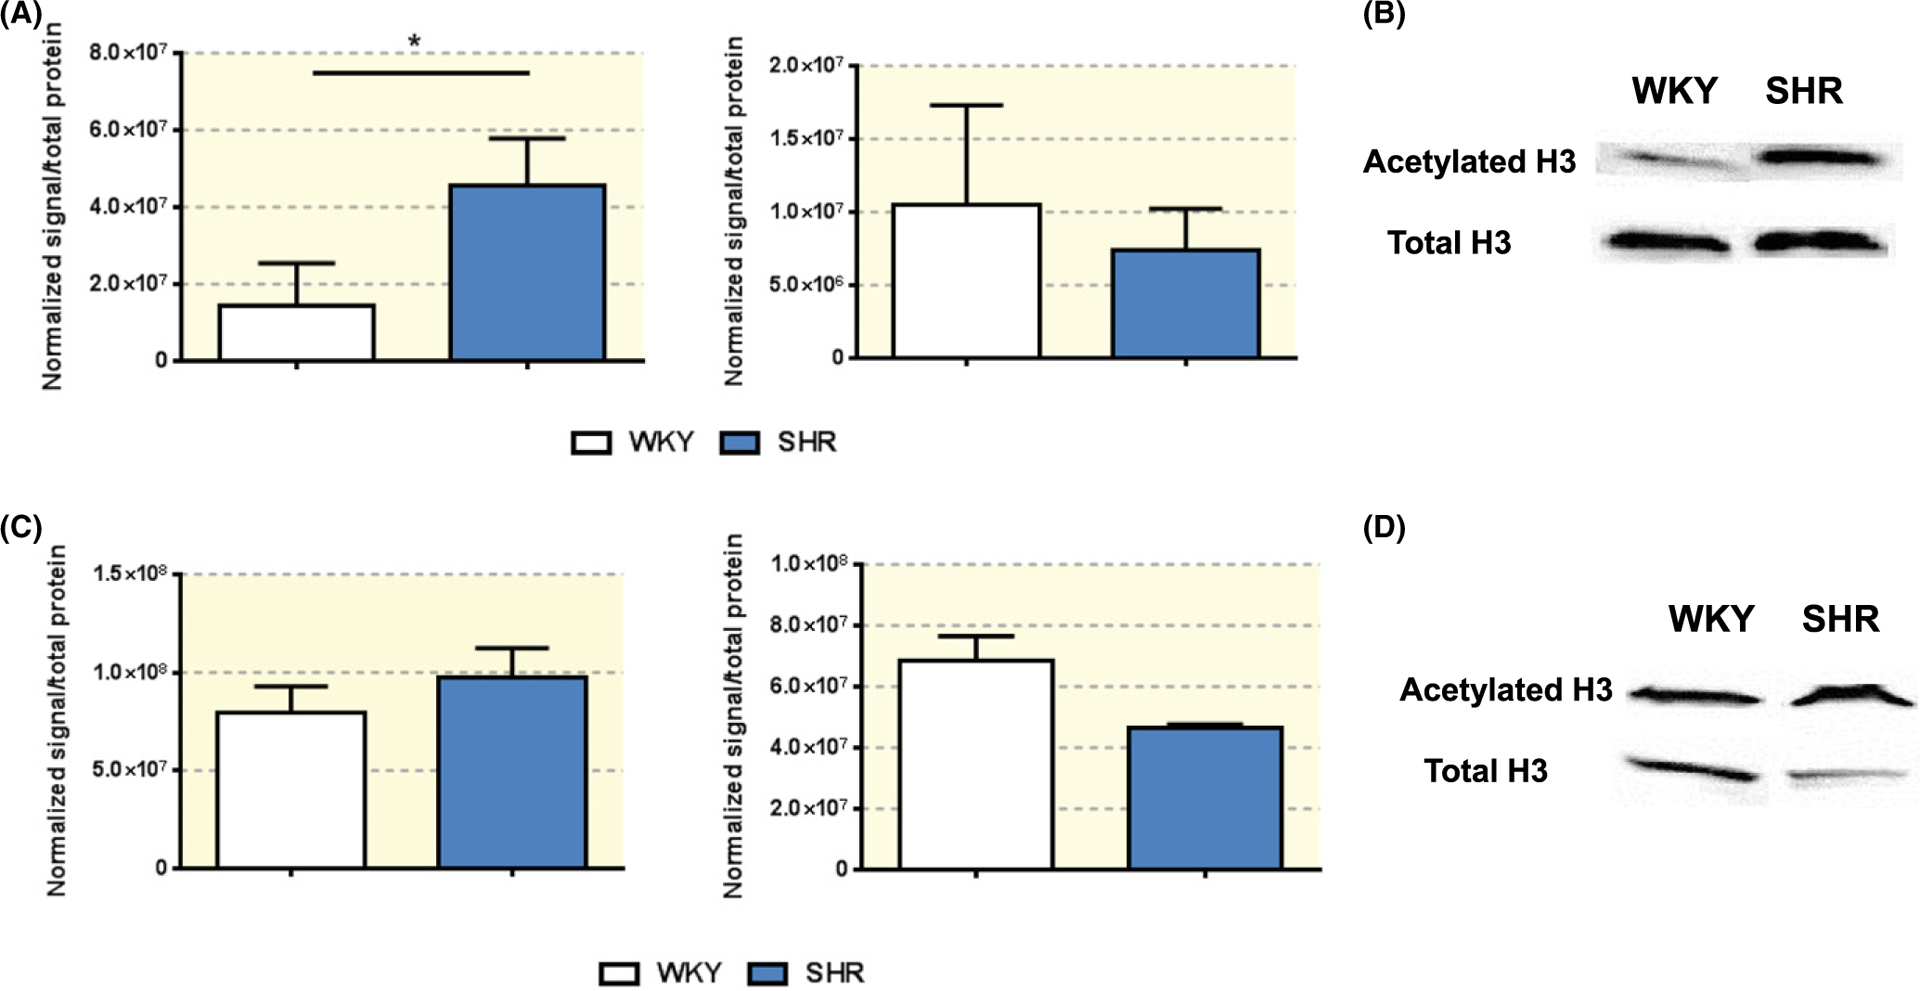
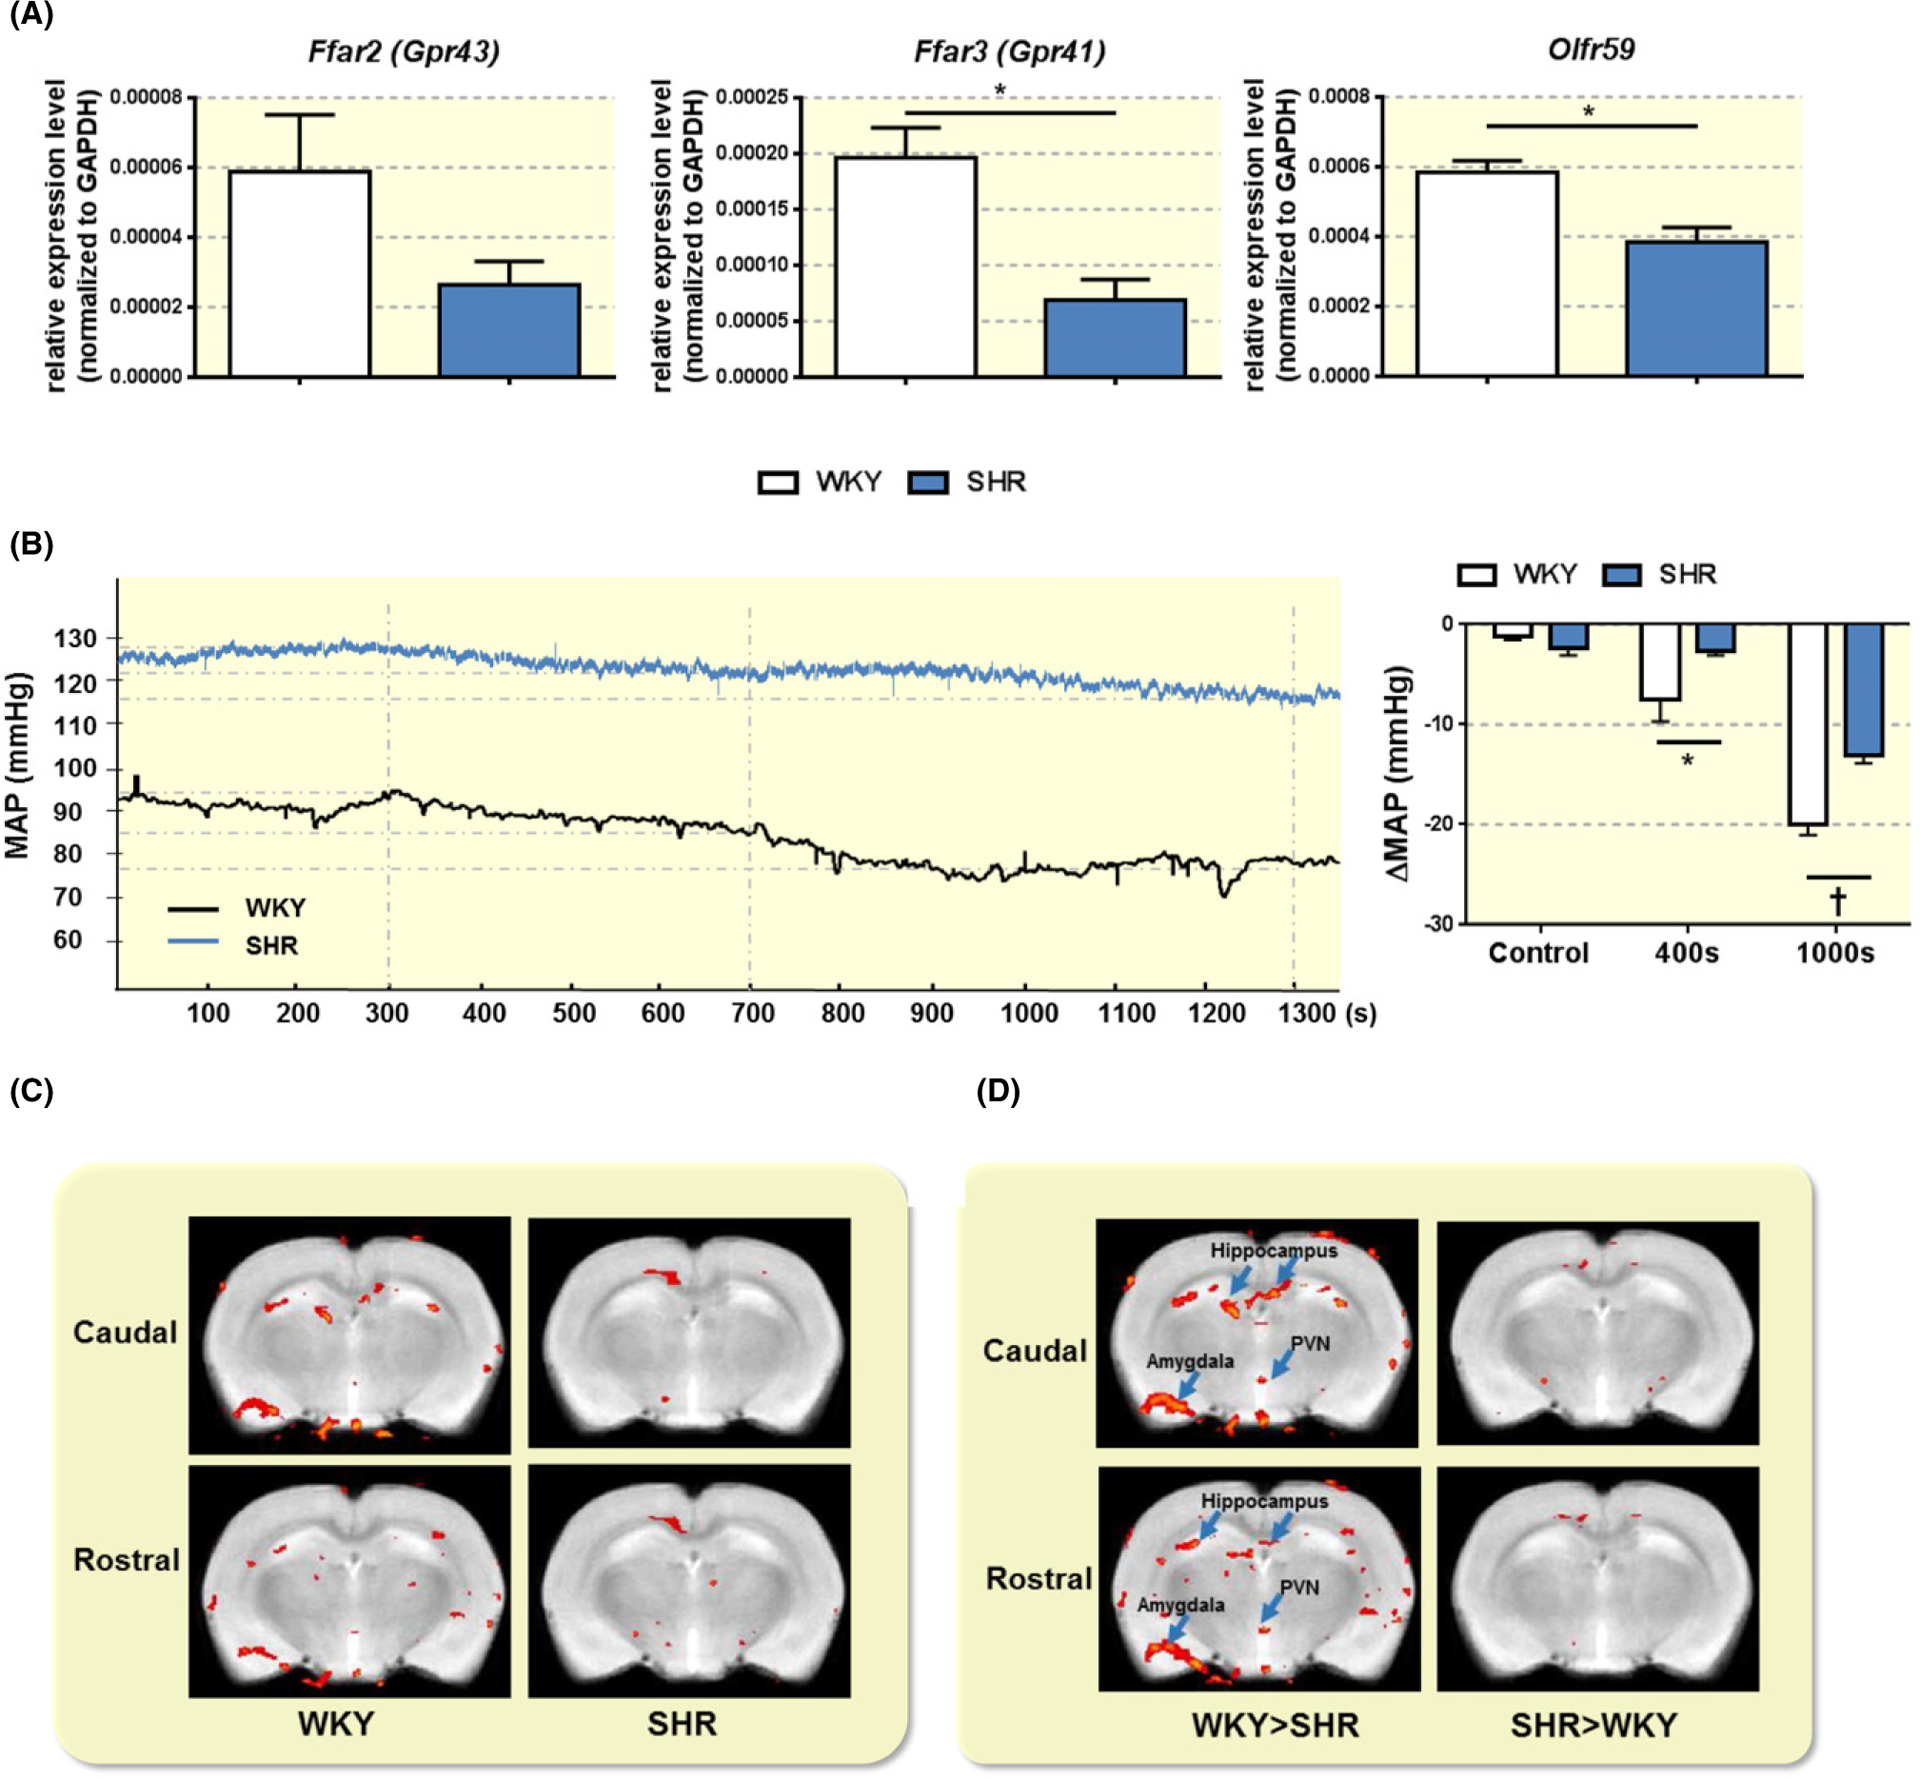
Results: In the SHR, we demonstrated elevated butyrate levels in cecal content, but diminished butyrate levels in circulation, possibly due to reduced expression of Slc5a8 transporter in the colon. In addition, we observed lower expression levels of butyrate-sensing receptors in the hypothalamus of SHR, likely leading to the reduced effects of centrally administered butyrate on blood pressure in the SHR. Functional magnetic resonance imaging revealed reduced activation of cardioregulatory brain regions following central administration of butyrate in the SHR compared to control.

Conclusion: We demonstrated a reduced availability of serum butyrate in the SHR, possibly due to diminished colonic absorption. Reduced expression of butyrate-sensing receptors in the SHR hypothalamus may explain the reduced central responsiveness to butyrate, indicating microbial butyrate may play a role in blood pressure regulation.

Keywords: absorption; blood pressure; butyrate; gut microbiota; neuronal activity.


Conflict of interest statement

CONFLICT OF INTEREST

No conflict of interest to disclose.

Figures

FIGURE 1
FIGURE 1
Levels of butyrate in the cecum and serum in juvenile and adult WKY and SHR. A, Representative peaks for three SCFAs, acetate, propionate and butyrate in the cecal contents from adult (14 weeks old, wk14) WKY (A, left panel) and SHR (A, middle panel) as measured by HPLC. Absolute cecal levels of butyrate were determined in adult and juvenile (4 weeks old, wk4) WKY and SHR (A, right panel). Two-way ANOVA was performed with Sidak’s multiple comparison test. *P < 0.05, P < 0.01. B, Representative LC-MS figures show typical peaks for butyrate in serum from adult WKY (B, left panel) and SHR (B, middle panel). Absolute butyrate levels in the serum of juvenile and adult WKY and SHR were determined by LC-MS (B, right panel). Two-way ANOVA was performed with Sidak’s multiple comparison test. *P < 0.05, P < 0.01
FIGURE 2
FIGURE 2
Impaired butyrate transport across the proximal colon epithelium in the SHR. A, Butyrate levels in the cecum, proximal and distal colon of adult WKY and SHR. Fecal samples were collected at indicated segments of the intestine, and subjected to HPLC for measurement of butyrate levels. One-way ANOVA was performed with Sidak’s multiple comparison test. *P < 0.05, P < 0.01, P < 0.001. B, Decrease in butyrate levels in proximal colon relative to cecum of adult WKY and SHR. Unpaired t-test P = 0.1. C, Butyrate absorption in the proximal colon of adult WKY and SHR. Proximal colon was isolated from adult WKY and SHR and mounted in the Ussing chamber. Krebs buffer containing 40 mmol/L butyrate was applied on the apical side of the proximal colon. One hour following the incubation, butyrate levels in both apical and basolateral solutions were determined by LC-MS. “Used” butyrate represents the difference between total butyrate initially applied to the chamber and the butyrate levels in the apical and basolateral solutions. *P < 0.05 in unpaired t-test. D, Short circuit current measurements (Isc) show no difference in proximal colon ionic transport between WKY and SHR at baseline and upon addition of butyrate. The black arrow indicates addition of butyrate to the apical side of proximal colon
FIGURE 3
FIGURE 3
Decreased butyrate transporter Slc5a8 in the proximal colon of SHR. A, Relative expression levels of specific SCFA transporters Slc5a8, Slc16a1 and Slc16a3 were determined by quantitative real time PCR in the proximal colon of adult WKY and SHR. *P < 0.05 by unpaired t-test. B, Immunohistochemistry and quantification of Slc5a8 in the proximal colon of adult WKY and SHR. Note the expression of Slc5a8 is mainly within the epithelial cells on the apical side of the colon. P < 0.001 by unpaired t-test
FIGURE 4
FIGURE 4
Acetylation of histone H3 in the proximal colon and hypothalamus of WKY and SHR. A, Western blot in the proximal colon of adult WKY and SHR shows total acetylated histone 3 (H3) protein levels (far left panel) and total H3 protein levels (middle panel), with representative blots, normalized for total protein loaded onto gel, showed in B. *P < 0.05 by unpaired t-test, Welch correction. C, Western blot in the hypothalamus of adult WKY and SHR shows total acetylated histone 3 (H3) protein levels (far left panel) and total H3 protein levels (middle panel), with representative blots, normalized for total protein loaded onto gel, showed in D, Unpaired t-test, Welch correction
FIGURE 5
FIGURE 5
Reduced relative expression levels of SCFA-sensing receptors in hypothalamus and reduced effect of ICV butyrate on mean arterial pressure (MAP) and activation of brain regions in the SHR. A, Total RNA from hypothalamus of adult WKY and SHR was isolated and subjected to real time PCR analysis of relative expression of SCFA receptors Ffar2, Ffar3 and Olfr59. *P < 0.05 by unpaired t-test. B, Representative tracings of MAP in anesthetized adult WKY and SHR. WKY and SHR rats were acutely microinjected with 1 μL of 1 mmol/L butyrate ICV. MAP was monitored in real time via a femoral artery catheter connected to Spike2. Dotted vertical line represents time of MAP analysis following butyrate injection. In the far right panel, ICV injection of butyrate produced a larger decrease in MAP in the WKY compared to the SHR. The bar graph indicates average reduction in MAP at 400 and 1000 s following butyrate injection. *P < 0.05 and P < 0.001 by unpaired t-test. C, Effect of equivalent ICV injection of butyrate on neuronal activation in specific brain regions of interest (ROIs) in anesthetized adult WKY and SHR as measured by functional magnetic resonance imaging (fMRI). Butyrate injection produced pronounced neuronal activation in several brain regions of the WKY, including the hippocampus, amygdala and hypothalamic paraventricular (PVN). Average volume of activation of specific ROIs in WKY and SHR is presented in the left panel and the right panel respectively, depicting neuronal activation immediately following ICV butyrate injection. D, Relative comparison of WKY and SHR butyrate-dependent fMRI responses. Images on the left show the ROIs with stronger butyrate-dependent signal in the WKY (WKY > SHR), while images on the right show the ROIs with stronger butyrate-dependent signal in the SHR (SHR > WKY) immediately following a single ICV butyrate injection. Caudal and rostral panels represent −1.7 mm and −2.3 mm from Bregma as per Paxinos and Watson Rat Brain Atlas

Similar articles

Cited by

References

    1. Adnan S, Nelson JW, Ajami NJ, et al. Alterations in the gut microbiota can elicit hypertension in rats. Physiol Genomics. 2017;49(2):96–104. - PMC - PubMed
    1. Li J, Zhao F, Wang Y, et al. Gut microbiota dysbiosis contributes to the development of hypertension. Microbiome. 2017;5(1):14. - PMC - PubMed
    1. Yang T, Santisteban MM, Rodriguez V, et al. Gut dysbiosis is linked to hypertension. Hypertension. 2015;65(6):1331–1340. - PMC - PubMed
    1. Mercado J, Valenzano MC, Jeffers C, et al. Enhancement of tight junctional barrier function by micronutrients: compound-specific effects on permeability and claudin composition. PLoS ONE. 2013;8(11):e78775. - PMC - PubMed
    1. Bordin M, D’Atri F, Guillemot L, Citi S. Histone deacetylase inhibitors up-regulate the expression of tight junction proteins. Mol Cancer Res. 2004;2(12):692–701. - PubMed

Publication types