. 2019 Apr;63(7):e1800821.
doi: 10.1002/mnfr.201800821. Epub 2019 Feb 4.

Eicosapentaenoic Acid Reduces Adiposity, Glucose Intolerance and Increases Oxygen Consumption Independently of Uncoupling Protein 1

Affiliations

Eicosapentaenoic Acid Reduces Adiposity, Glucose Intolerance and Increases Oxygen Consumption Independently of Uncoupling Protein 1

Mandana Pahlavani et al. Mol Nutr Food Res. 2019 Apr.

Abstract

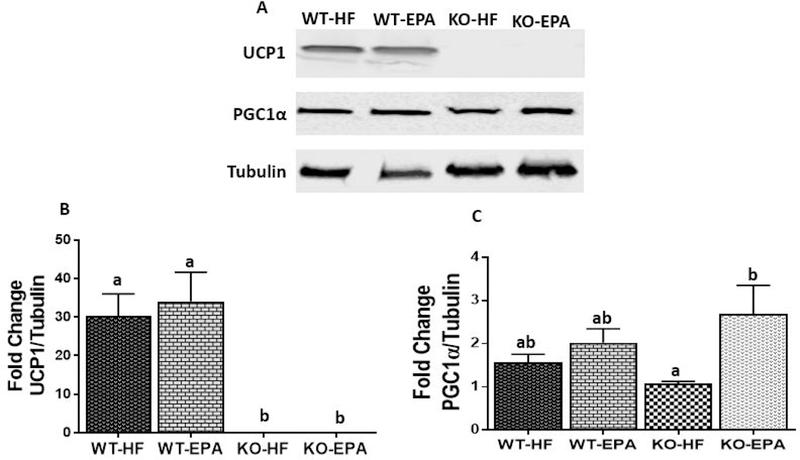
Scope: Brown adipose tissue (BAT) dissipates energy through uncoupling protein 1 (UCP1) and has been proposed as an anti-obesity target. It was reported previously that a high-fat (HF) diet enriched in eicosapentaenoic acid (EPA) significantly increased UCP1 and other thermogenic markers in BAT. It is hypothesized that these effects are mediated through UCP1-dependent regulation.

Methods and results: Wild-type (WT) and UCP1 knockout (KO) B6 male mice were housed at thermoneutrality and fed a HF diet, without or with eicosapentaenoic acid (EPA)-enriched fish oil. HF-fed KO mice were heavier and had higher BAT lipid content than other groups. Protective effects of EPA in WT, previously observed at 22 °C (reduced adiposity, improved glucose tolerance, and increased UCP1), disappeared at thermoneutrality. Mitochondrial proteins, cytochrome c oxidase subunit 1 (COX I), COX I, II, and IV were reduced in the KO mice compared to WT. Unexpectedly, EPA attenuated weight and fat mass gain and improved glucose tolerance in the KO mice. Finally, EPA increased BAT peroxisome proliferator-activated receptor gamma coactivator 1 alpha (PGC1α) protein and gene expression, and whole-body oxygen consumption in KO mice, consistent with increased mitochondria DNA (mtDNA)/nuclear DNA (nucDNA) ratio.

Conclusions: EPA rescued the weight gain and glucose intolerance in UCP1 KO mice at thermoneutrality, independent of UCP1; these effects may be mediated in part via increased oxygen consumption and BAT PGC1α.

Keywords: brown adipose tissue; obesity; omega 3 fatty acids; thermoneutrality; uncoupling protein 1.


Conflict of interest statement

Conflict of interest

There is no conflict of interest for this study.

Figures

Figure. 1.
Figure. 1.. Genotyping of WT and UCP1 KO mice:
Positive/negative PCR products were measured by gel. Agarose electrophoresis of (A) WT (B) KO products.
Figure. 2.
Figure. 2.. Body weight and food intake in WT and UCP1 KO mice fed a HF diet vs. EPA.
A: weekly food intake. B: weekly body weight. Data are expressed as mean± SEM. WT, wild-type; KO, knock out; HF, high fat. Groups represented with same letter indicate no difference. p <0.05; n =10–12 mice per group.
Figure. 3.
Figure. 3.. The effect of UCP1 and thermoneutral environment on glucose homeostasis in WT and UCP1 KO mice fed a HF diet vs. EPA.
A: glucose tolerance test. B: Area under the curve of GTT. C: insulin tolerance test D: Area under the curve of ITT. Data are expressed as mean± SEM. WT, wild-type; KO, knock out; HF, high fat. Groups represented with same letter indicate no difference. p <0.05; n =10–12 mice per group.
Figure. 4.
Figure. 4.. Final body weight, epididymal fat pad weight, fat percentage, and lean percentage in WT and UCP1 KO mice fed a HF diet vs. EPA.
A: final body weight. B: epididymal fat pad weight. C: fat percentage. D: lean percentage. Data are expressed as mean± SEM. WT, wild-type; KO, knock out; HF, high fat. Groups represented with same letter indicate no difference. p <0.05; n =10–12 mice per group.
Figure. 5.
Figure. 5.. Histology of interscapular BAT, triglyceride content, and BAT weight in WT and UCP1 KO male mice fed a HF diet vs. EPA.
A: histology images (20X) of interscapular BAT, B: triglyceride content, C: interscapular BAT weight. Data are expressed as mean± SEM. WT, wild-type; KO, knock out; HF, high fat. Groups represented with same letter indicate no difference. p <0.05; n 6–10 mice per group.
Figure. 6.
Figure. 6.. Gene expression of thermogenic and calcium cycling markers in interscapular BAT in WT and UCP1 KO mice fed a HF diet vs. EPA. Thermogenic markers:
A: Pgc1α, B: Sirt1, C: Ucp1, D: Ucp2, E: Trpv2. Data are expressed as mean± SEM. WT, wild-type; KO, knock out; HF, high fat. Groups represented with same letter indicate no difference. p <0.05; n =10 mice per group.
Figure. 7.
Figure. 7.. Interscapular BAT protein content in WT and UCP1 KO mice fed a HF diet vs. EPA.
A: UCP1 and Pgc1α protein content. B and C: Blots were normalized to α-Tubulin. Data are expressed as mean± SEM. WT, wild-type; KO, knock out; HF, high fat. Groups represented with same letter indicate no difference. p <0.05; n =6 mice per group.
Figure. 8.
Figure. 8.. (A) Oxygen consumption rate, (B) mitochondria DNA (mtDNA)
measured as a ratio of mtDNA to nuclear DNA (nucDNA) in WT and UCP1 KO mice fed a HF diet vs. EPA. Data are expressed as mean± SEM. WT, wild-type; KO, knock out; HF, high fat. Groups represented with same letter indicate no difference. p <0.05; n= 4–6 mice per group.
Figure. 9.
Figure. 9.. Interscapular BAT OXPHOS protein content in WT and UCP1 KO mice, fed a HF diet vs. EPA.
(A) COX I, II, III, IV, V protein content. (B-F) blots were normalized to GAPDH. Data are expressed as mean± SEM. WT, wild-type; KO, knock out; HF, high fat. Groups represented with same letter indicate no difference. p <0.05, n= 6 mice per group.
Figure. 10.
Figure. 10.. Immunofluorescence analysis (10×) of UCP1 and COX IV expression
of interscapular BAT in WT and UCP1 KO mice sections, fed a HF diet vs. EPA in thermoneutral environment. WT, wild-type; KO, knock out; HF, high fat, n=3.

Similar articles

Cited by

References

    1. Hales CM, Carroll MD, Fryar CD, Ogden CL, Prevalence of Obesity Among Adults and Youth: United States, 2015–2016. NCHS data brief 2017, 1–8. - PubMed
    1. Ogden CL, Carroll MD, Flegal KM, Prevalence of obesity in the United States. Jama 2014, 312, 189–190. - PubMed
    1. Cummins TD, Holden CR, Sansbury BE, Gibb AA, Shah J, Zafar N, Tang Y, Hellmann J, Rai SN, Spite M, Bhatnagar A, Hill BG, Metabolic remodeling of white adipose tissue in obesity. American journal of physiology. Endocrinology and metabolism 2014, 307, E262–277. - PMC - PubMed
    1. Wu J, Cohen P, Spiegelman BM, Adaptive thermogenesis in adipocytes: is beige the new brown? Genes Dev 2013, 27, 234–250. - PMC - PubMed
    1. Symonds ME, Brown Adipose Tissue Growth and Development. Scientifica 2013, 2013, doi:10.1155/2013/305763. - DOI - PMC - PubMed

Publication types

MeSH terms

Substances