

Comparison of Wait Times for New Patients Between the Private Sector and United States Department of Veterans Affairs Medical Centers
- PMID: 30657532
- PMCID: PMC6484544
- DOI: 10.1001/jamanetworkopen.2018.7096
Comparison of Wait Times for New Patients Between the Private Sector and United States Department of Veterans Affairs Medical Centers
Abstract
Importance: Concerns have been raised about the adequacy of health care access among patients cared for within the United States Department of Veterans Affairs (VA) health care system.
Objectives: To determine wait times for new patients receiving care at VA medical centers and compare wait times in the VA medical centers with wait times in the private sector (PS).
Design, setting, and participants: A retrospective, repeated cross-sectional study was conducted of new appointment wait times for primary care, dermatology, cardiology, or orthopedics at VA medical centers in 15 major metropolitan areas in 2014 and 2017. Comparison data from the PS came from a published survey that used a secret shopper survey approach. Secondary analyses evaluated the change in overall and unique patients seen in the entire VA system and patient satisfaction survey measures of care access between 2014 and 2017.
Main outcomes and measures: The outcome of interest was patient wait time. Wait times in the VA were determined directly from patient scheduling. Wait times in the PS were as reported in Merritt Hawkins surveys using the secret shopper method.
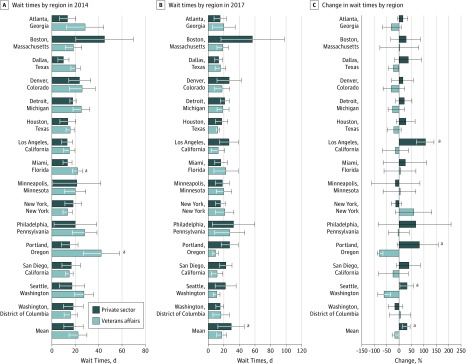
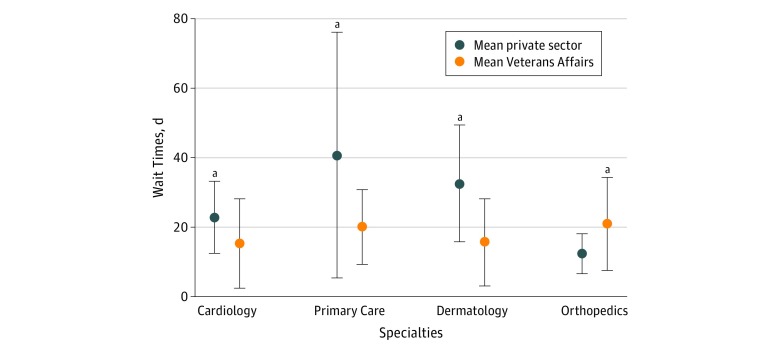
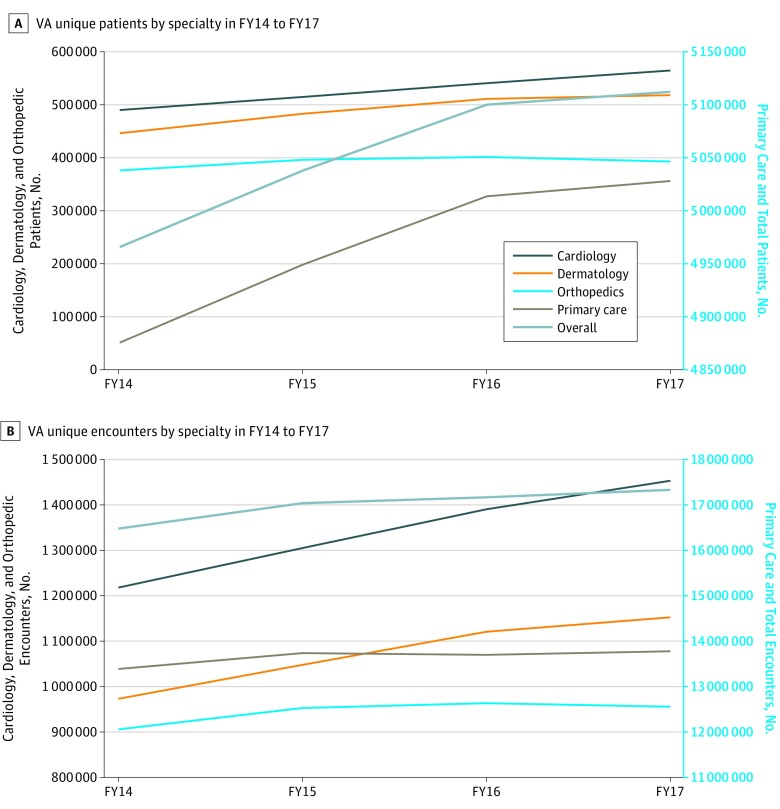
Results: Compared with the PS, overall mean VA wait times for new appointments in 2014 were similar (mean [SD] wait time, 18.7 [7.9] days PS vs 22.5 [7.3] days VA; P = .20). Department of Veterans Affairs wait times in 2014 were similar to those in the PS across specialties and regions. In 2017, overall wait times for new appointments in the VA were shorter than in the PS (mean [SD], 17.7 [5.9] vs 29.8 [16.6] days; P < .001). This was true in primary care (mean [SD], 20.0 [10.4] vs 40.7 [35.0] days; P = .005), dermatology (mean [SD], 15.6 [12.2] vs 32.6 [16.5] days; P < .001), and cardiology (mean [SD], 15.3 [12.6] vs 22.8 [10.1] days; P = .04). Wait times for orthopedics remained longer in the VA than the PS (mean [SD], 20.9 [13.3] vs 12.4 [5.5] days; P = .01), although wait time improved significantly between 2014 and 2017 in the VA for orthopedics while wait times in the PS did not change (change in mean wait times, increased 1.5 days vs decreased 5.4 days; P = .02). Secondary analysis demonstrated an increase in the number of unique patients seen and appointment encounters in the VA between 2014 and 2017 (4 996 564 to 5 118 446, and 16 476 461 to 17 331 538, respectively), and patient satisfaction measures of access also improved (satisfaction scores increased by 1.4%, 3.0%, and 4.0% for specialty care, routine primary care, and urgent primary care, P < .05).
Conclusions and relevance: Although wait times in the VA and PS appeared to be similar in 2014, there have been interval improvements in VA wait times since then, while wait times in the PS appear to be static. These findings suggest that access to care within the VA has improved over time.
Conflict of interest statement
Figures
Comment in
-
Waiting for Care in Veterans Affairs Health Care Facilities and Elsewhere.JAMA Netw Open. 2019 Jan 4;2(1):e187079. doi: 10.1001/jamanetworkopen.2018.7079. JAMA Netw Open. 2019. PMID: 30657527 No abstract available.
References
-
- VA head: 18 more vets left off waiting list in Phoenix area died. https://www.cbsnews.com/news/va-head-18-more-vets-left-off-waiting-list-.... Published June 6, 2014. Accessed December 14, 2018.
-
- Longman P, Gordon S VA health care: a system worth saving. http://www.vasocialworkers.org/Documents/59VAR0817%20Longman%20Gordon%20.... Published August 2017. Accessed December 18, 2017.
-
- US Dept of Veterans Affairs. Average wait times at individual facilities. https://www.accesstopwt.va.gov/main/statemap/true. Accessed December 18, 2017
-
- Lee T. The VA: a model for the whole health care system. https://catalyst.nejm.org/veterans-affairs-health-care-system/. Published October 3, 2017. Accessed December 18, 2017.
-
- Helfand M. An evidence-based wait time threshold. https://www.hsrd.research.va.gov/publications/esp/WaitTimesMemo.pdf. Published August 2014. Accessed December 18, 2017.
